Crypto analyst Merlijn has revealed that the Bitcoin price is following a 100-year pattern, which could determine its next move. The analyst also highlighted key levels, which would determine whether the leading crypto breaks out or breaks down.
Bitcoin Price Is Following a 100-Year-Old Pattern
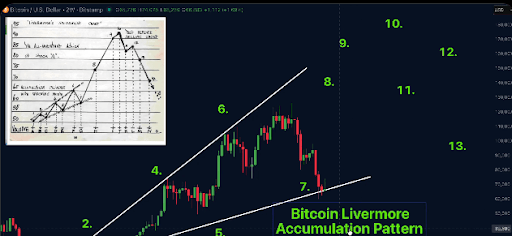
In an X post, Merlijn noted that the Bitcoin price is following this structure that Jesse Livermore mapped in the 1920s, with the leading crypto following every step perfectly. The analyst said that a BTC hold above $70,000 would confirm the next leg, while a drop below $60,000 would mean accumulation would extend.
The analyst’s accompanying chart showed that the Bitcoin price could rally to as high as $170,000 based on this Livermore Accumulation pattern. This rally to a new all-time high (ATH) of $170,000 is expected to happen by the end of the year or at the start of 2027. That price level is expected to mark a top for the leading crypto, which could then drop to $90,000.
In another X post, Merlijn indicated that the Bitcoin price is likely to see another leg down. This came as he noted a BTC descending channel with one move left. The analyst said that higher lows within the channel have been made, while rejections at resistance have occurred, so a final flush to $45,000 looks likely.
Once the Bitcoin price sees that final flush to $45,000, Merlijn predicts the leading crypto could then break out to $140,000. Meanwhile, the final flush to $45,000 could be invalidated if BTC holds $65,000 and the descending channel breaks. However, the max pain target activates if BTC were to lose that price level.
BTC Entering Final Discount Zone
Crypto analyst Ali Martinez said that the Bitcoin price is approaching the final discount window before the next bull market if history repeats itself. He further remarked that if the fractal holds, then there could be a golden entry window between October 6 and October 16. Meanwhile, the buy zone would be between $41,500 and $45,000.
Martinez added that this could be the launchpad to start a new 4-year cycle for the Bitcoin price. “The countdown to the next Bitcoin vertical move has begun,” he said. The analyst had recently noted that the BTC price was stuck in a no-trade zone and that it is a waiting game right now. He warned that there won’t be a big move until the leading crypto either breaks above $70,685 or falls below $65,636, a level that Merlijn highlighted.
At the time of writing, the Bitcoin price is trading at around $70,600, up over 3% in the last 24 hours, according to data from CoinMarketCap.