Bitcoin continues to struggle below the $70,000 level as persistent selling pressure keeps the market in a defensive posture. The inability to reclaim this psychological threshold has weighed on sentiment, with traders increasingly cautious amid elevated volatility and tightening liquidity conditions. While corrective phases are common after strong rallies, the current environment reflects sustained stress rather than a brief pullback, leaving investors closely monitoring key structural support levels.
A recent report from Axel Adler highlights the extent of the ongoing downtrend. According to the analysis, Bitcoin has fallen from roughly $125,000 in October last year to around $66,400 today — a decline of approximately 47% over four months. The report emphasizes two critical on-chain levels now shaping the market outlook: Realized Price, which is trending downward, and the Long-Term Holder (LTH) cost basis, which continues to rise.
If current trajectories persist, these levels are expected to converge within a quarter into a key support corridor estimated between roughly $43,000 and $51,000. This zone could represent the last major structural support before a deeper bearish phase develops. For now, as long as Bitcoin remains above the Realized Price near $55,000, broader market structure remains intact, though continued weakness keeps downside risks elevated.
On-Chain Cost Basis Signals Compression of Bitcoin’s Long-Term Support Zone
Adler further explains that the Bitcoin On-chain Cost Basis 7-day Rate of Change chart provides a clearer view of how key structural support levels are evolving. The metric tracks weekly percentage changes in Realized Price, Short-Term Holder (STH) cost basis, and Long-Term Holder (LTH) cost basis, allowing analysts to assess not only absolute levels but also the speed at which they are converging.
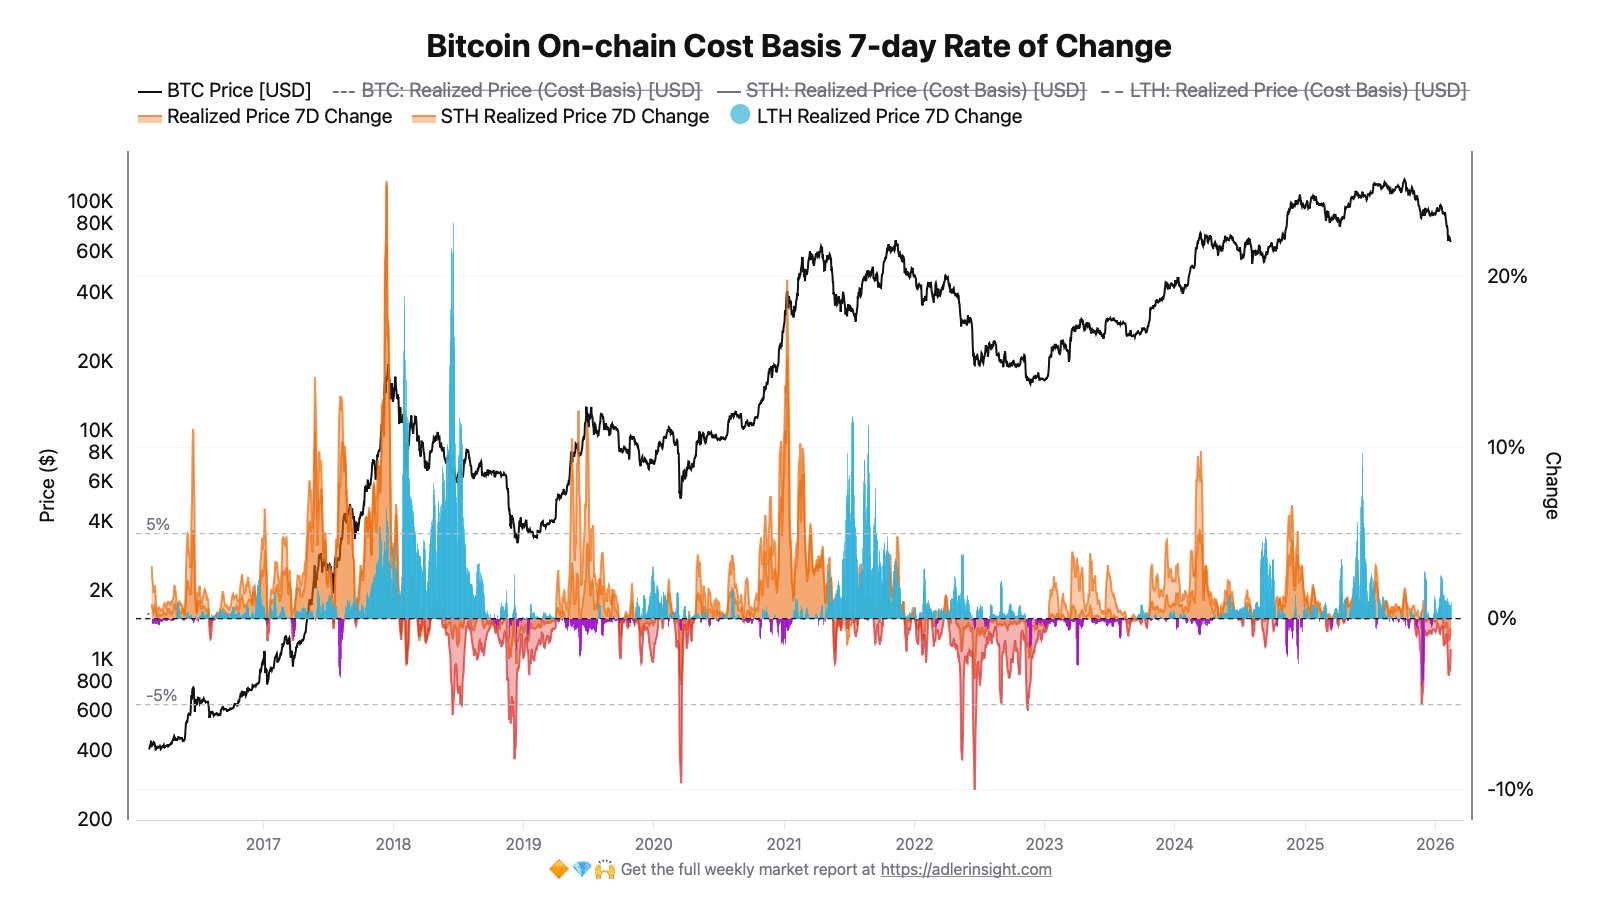
Currently, LTH cost basis is rising about 0.96% per week, placing it near roughly $43,223 on a quarterly horizon. Meanwhile, Realized Price is declining around 0.55% per week, projecting a level near $51,157 over the same period. As a result, the support corridor between these levels is compressing from roughly $16,700 today to under $8,000, indicating tightening long-term structural support.
This development is not an immediate trading signal but rather a forward-looking framework. Within a quarter, the $43K–$51K zone could become a decisive structural boundary. Sustained price action below that range would significantly increase the probability of a deeper bearish phase.
Short-term pressure remains elevated as STH cost basis continues falling near 1.77% weekly. However, Realized Price remains the first major support, with LTH cost basis representing the deeper long-term defense level.