$XRP is trading at $1.0873 on July 29, up 1.83%, attempting a bounce within a descending wedge that has squeezed the price since the May peak, as the monthly RSI is at the most oversold reading in the token's history.
$XRP is Still Inside the Descending Wedge, and the Supertrend is Bearish
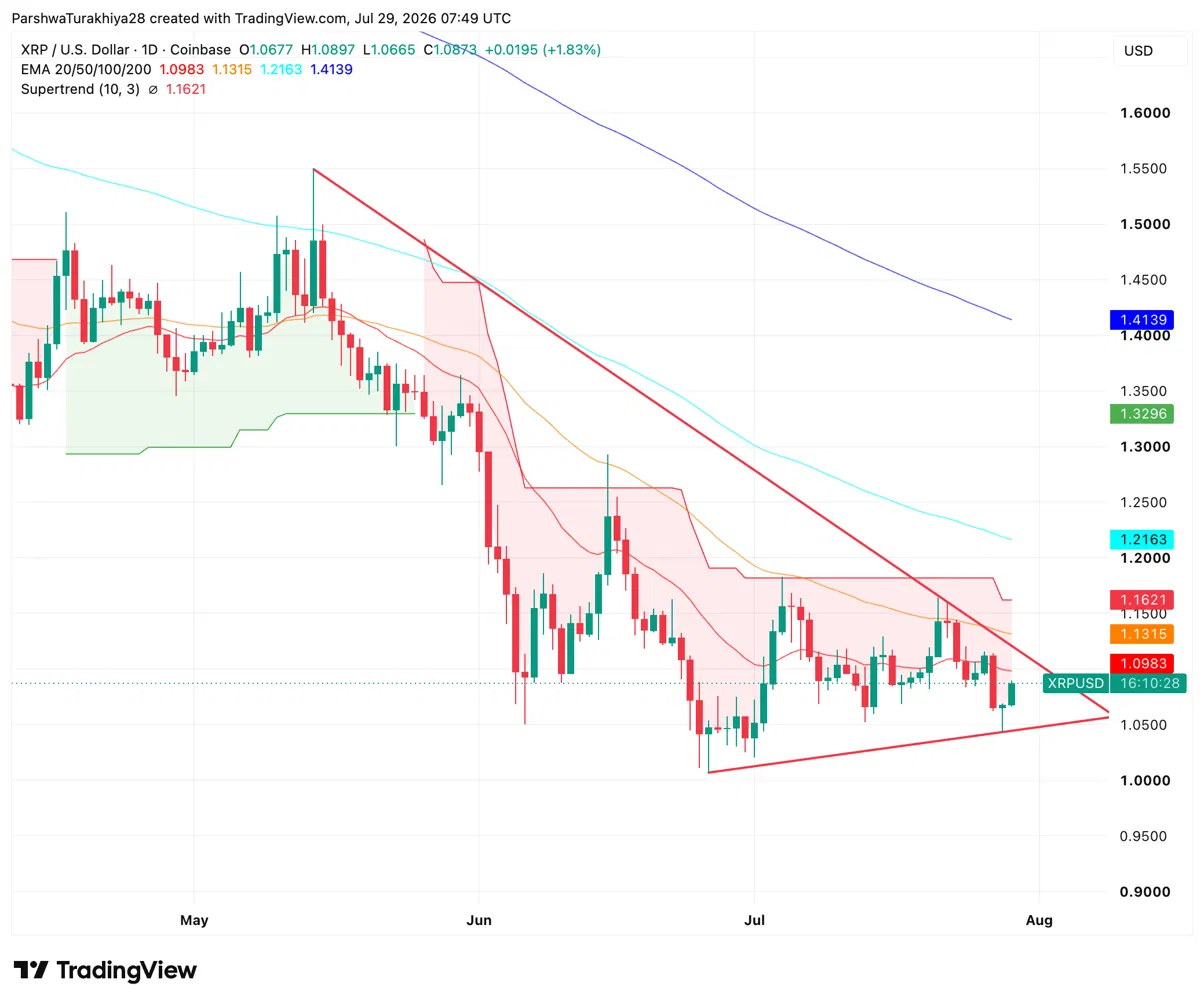
The daily chart shows how $XRP is compressing inside a descending wedge, with both trendlines noticeably converging. The lower trendline has held several tests around the $1.05 level. Today's bounce is pressuring the upper trendline around $1.10–$1.12. The Supertrend at $1.1621 is in a bearish position above the price and is the first indicator that needs to flip to confirm a trend change on the daily timeframe.
All four EMAs are sloping downwards above the current price. The 20-day EMA at $1.0983 is the immediate ceiling, nearly exactly matching the current price. The Ichimoku Cloud remains bearish overhead, adding another layer to the stack of resistance above. The round number $1.00 and the June low define the floor if the wedge breaks downward.
What are the Key Support and Resistance Levels for $XRP Today?
Resistance
- $1.0983 — 20-day EMA, immediate ceiling at the current price
- $1.1315 — 50-day EMA
- $1.1621 — Supertrend, needs to flip bullish to confirm the trend
- $1.2163 — 100-day EMA, extended upside target
Support
- $1.0665 — Today's session low and wedge lower trendline
- $1.0500 — Recent support zone after previous wedge floor tests
- $1.0000 — Round number and June low, last floor before uncharted territory
$XRP's Monthly RSI is More Oversold Than During the COVID Crash
$XRP is now at its most oversold levels ever.
— Ash Crypto (@AshCrypto) July 28, 2026
— Down 72% from its ATH.
— It has hit a 2-year low near $1 last month.
— Monthly RSI is now more oversold than during the 2020 COVID crash.
Do you think the bottom is in? pic.twitter.com/jOV8xbk3gr
Analyst Ash Crypto noted on July 28 that $XRP's monthly RSI has reached its highest oversold reading in history, surpassing even the COVID lows of March 2020. $XRP is now down 72% from its all-time high and hit a two-year low near $1.00 last month.
The monthly RSI reading is a slow-moving signal that takes time to confirm, but historically, extreme oversold readings over a monthly period have preceded multi-month recoveries rather than continued straight-line declines. The delay from the CLARITY Act and geopolitical noise from Iran are suppressing short-term momentum, but the monthly signal is the type long-term investors watch as an accumulation zone indicator.
OSL Hong Kong Opens Retail $XRP Trading with Settlement on the $XRP Ledger
Hong Kong retail just got the green light on $XRP. 🇭🇰
— Xaif Crypto (@Xaif_Crypto) July 29, 2026
OSL HK opens $XRP/USD and $XRP/HKD to retail at 8PM today, first exchange in HK to do it. Now sitting alongside BTC, ETH, and SOL as the only retail-approved assets there.
Asia keeps building the on-ramps the US is still... https://t.co/qPeYa2sOj3 pic.twitter.com/NJrsocPwjZ
OSL Hong Kong has become the first exchange in Hong Kong to open $XRP trading to retail investors. $XRP joins Bitcoin, Ethereum, and Solana as the only four assets available for retail trading on the platform. Settlement occurs directly via the $XRP Ledger.
This move expands regulated retail access for $XRP in Asia at a time when the token is reaching its most oversold monthly RSI levels historically. It adds an institutional demand signal to the on-chain ecosystem, which is already showing net exchange outflows.
What Spot Net Flows and Derivatives Show About Current Positioning
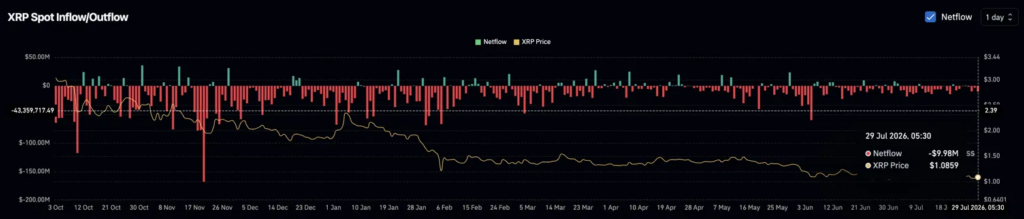
$XRP spot flow recorded -$9.98M on July 29, meaning more $XRP moved off exchanges than onto them. The net flow chart shows a sustained pattern of net outflows throughout July despite price weakness. Historically, holders removing supply from sell-side turnover during a price decline represent a bullish undercurrent beneath the bearish surface price movement.
$XRP Derivatives Overview — July 29, 2026
| Metric | Value | What it Means |
| 24h Volume | $2.55B (+9.70%) | Active trading without significant new directional positioning |
| Open Interest | $2.45B (-0.08%) | Almost flat, no major new bets |
| Long Liquidations (24h) | $3.60M | Long positions absorbing the bulk of recent volatility pain |
| Short Liquidations (24h) | $945.84K | Shorts experiencing far less pain than longs |
| Top Trader L/S (Accounts) | 2.86 | Large accounts confidently net long |
| Top Trader L/S (Positions) | 1.49 | Position sizes also net long |
| Retail L/S Ratio | 1.0421 | Nearly balanced — retail not overly committed either way |
The retail long/short ratio at 1.0421 is almost perfectly balanced, showing that small traders are not too invested either way ahead of the FOMC decision. This is unusual for a market at historically extreme oversold readings and suggests that retail has not yet begun chasing the monthly RSI signal.
$XRP Price Forecast: Upside and Downside Targets
- Upside Case: The wedge upper trendline breaks above $1.10, $XRP reclaims the 20-day EMA at $1.0983, OSL Hong Kong retail flows increase demand from Asia, and the monthly RSI extreme attracts spot accumulation towards the Supertrend at $1.1621 and the 50-day EMA at $1.1315, as the CLARITY Act window narrows to its final days.
- Downside Case: The wedge upper trendline rejects the price again, $XRP loses the lower trendline near $1.05, and the CLARITY Act fails to make it to a vote before the August 8 recess, pushing price closer to the $1.00 round number as the most oversold monthly RSI in history remains low without a catalyst to spark a recovery.