Lost the 75,000 Mark, Is Bitcoin About to Experience Its Final Drop?

marsbitPublicado a 2026-05-28Actualizado a 2026-05-28

Resumen

Bitcoin fell below the $75,000 support level on May 28th, trading near $74k amid a broader market correction. Major altcoins like ETH, NEAR, WLD, and ONDO also declined, with the market fear index dropping to 34. Over $470 million in liquidations occurred in 24 hours, mostly long positions. The downturn is linked to external pressures. Geopolitical tensions flared as the US conducted new strikes on an Iranian military base, impacting risk assets. Simultaneously, US spot Bitcoin ETFs shifted to consistent net outflows in May, indicating institutional profit-taking, with funds potentially rotating into outperforming AI and tech stocks. Analysts note BTC's long-term fundamentals remain sound. However, short-term price action depends on capital flows, which are currently negative. Key support is identified between $75k-$76k; a break below could lead to a test of $70k-$72k. On-chain data suggests short-term trading activity has plummeted to levels typical of bear market bottoms, signaling either a bottoming phase or a potential final decline before a reversal. Experts advise a diversified strategy as Bitcoin appears to be in a bottoming area.

Original Author: Ma He, Foresight News

On May 28, after repeated battles around the $75,000 mark, the price of Bitcoin finally lost its footing, now sliding to around $74,000. ETH is oscillating repeatedly around $2,000. Previously strong performers like NEAR, WLD, and ONDO have all seen pullbacks.

The market fear and greed index has currently fallen back to 34, indicating a state of panic.
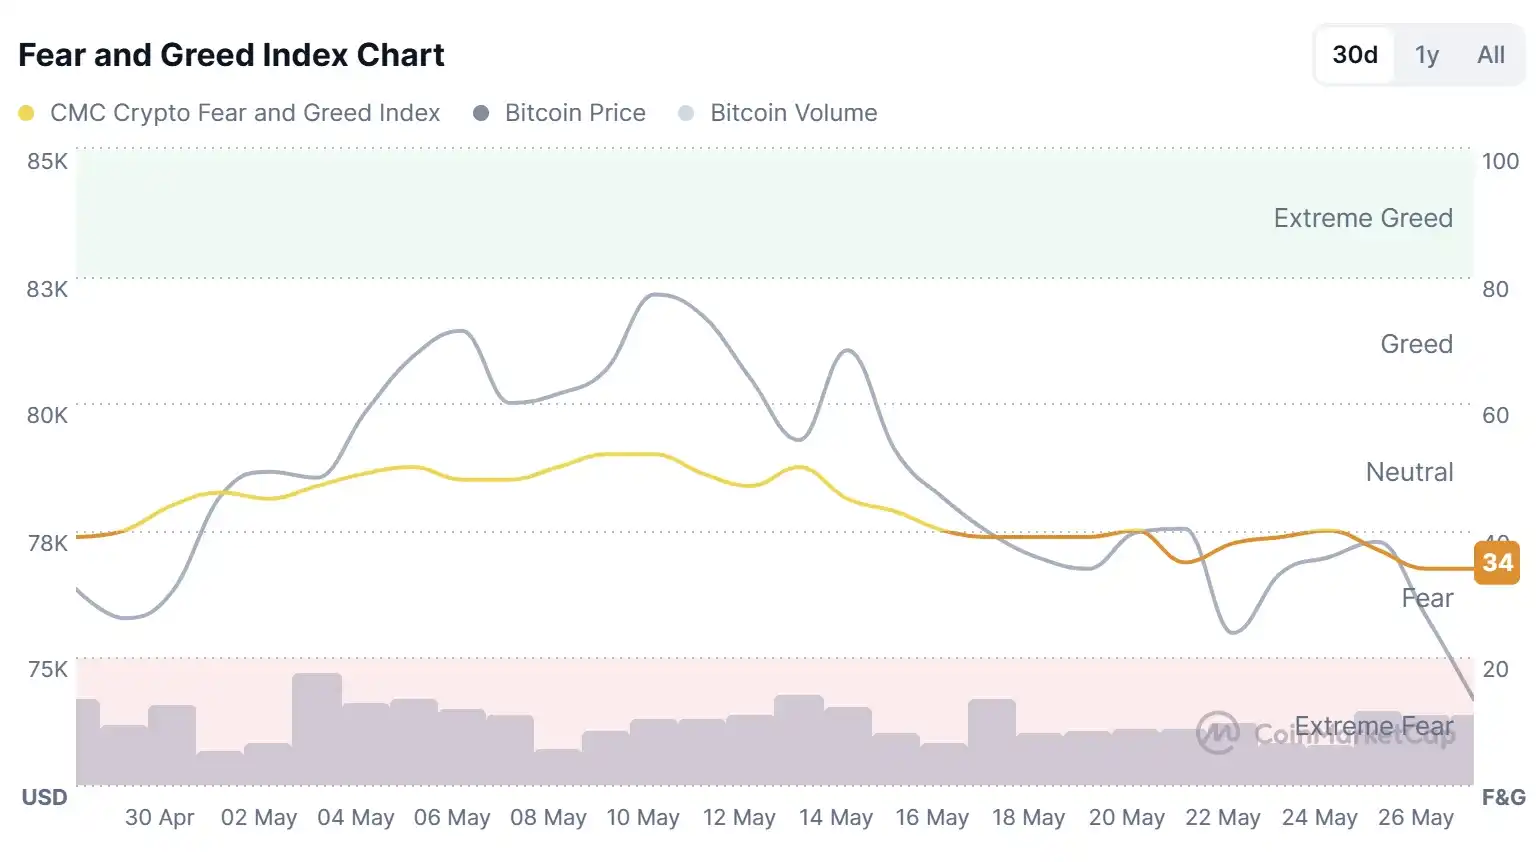
Data from Coinglass shows that in the past 24 hours, $470 million worth of open interest contracts were liquidated across the network, with long positions accounting for $420 million of that.

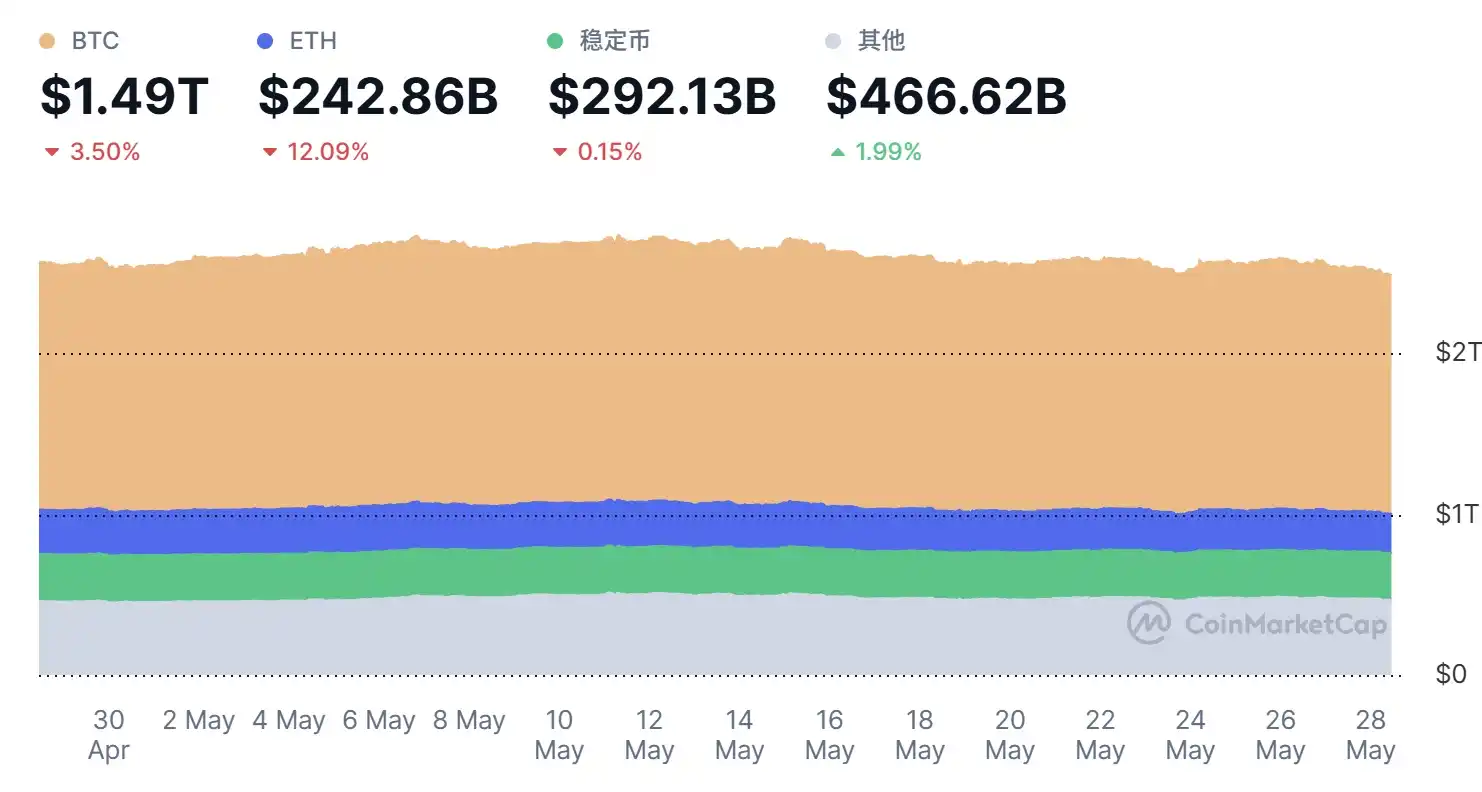
Over the past several weeks, Bitcoin has been oscillating repeatedly between $75,000 and $80,000. It briefly attempted to break above $78,000 but failed to hold. In the past 30 days, BTC has fallen by 3.5%, ETH by about 12%, and stablecoins have also declined by 0.15%.
Regarding macro data, Brent crude oil rose slightly to $97 per barrel, silver fell slightly to $73, the Dow Jones Industrial Average rose 182.60 points (+0.36%) to a new record high. The S&P 500 index rose 1.24 points (+0.02%). The Nasdaq Composite Index stood at 26,674.73 points, up 18.55 points (+0.07%). Spot gold fell below $4,400 per ounce, the first time since March 27, losing over $50 intraday, a drop of 1.25%.

US-Iran Conflict "Reignites"

Geopolitical risks in the Middle East have become another significant external variable. Since 2026, tensions between the US, Iran, and related parties over issues like Iran's nuclear facilities and shipping security in the Strait of Hormuz have repeatedly escalated and eased. In recent months, the US has adopted a strategy combining military action with diplomatic pressure, accompanied by airstrikes, port blockade rumors, and repeated ceasefire negotiations.

Even during windows of ceasefire or diplomatic progress, market pricing for the risk of "reignition" has not completely subsided.

Early on May 28, US President Trump stated that the United States would continue to control Iran's assets. Iran has begun to provide us with what we want. If things don't go well, US Secretary of Defense Hagesse will finish the job. We can end the war with Iran very quickly, and perhaps we must do so. However, I don't think we need to.

Around 5:00 AM Beijing Time, according to reports from Iranian media Fars News, local residents said explosions were heard at Bandar Abbas port in southern Iran.

A US official told Reuters that the US military conducted new strikes on an Iranian military base posing a threat to US forces and commercial navigation in the Strait of Hormuz. US forces also intercepted and shot down multiple Iranian drones posing a threat to US forces and commercial maritime traffic.

Renewed tensions related to the Strait of Hormuz have come into focus, intensifying oil price volatility and putting pressure on global risk assets. In this environment, Bitcoin has exhibited more risk-asset characteristics rather than the traditional "digital gold" safe-haven function—geopolitical uncertainty boosts demand for the US dollar and US Treasuries while suppressing risk appetite, leading to capital outflows from the crypto market.

ETF Net Outflows Reveal Institutional Profit-Taking

Since their launch in early 2024, US spot Bitcoin ETFs have seen cumulative net inflows once exceeding $57 billion, becoming a major channel for institutional Bitcoin allocation. However, a clear reversal in flows has emerged since May 2026.
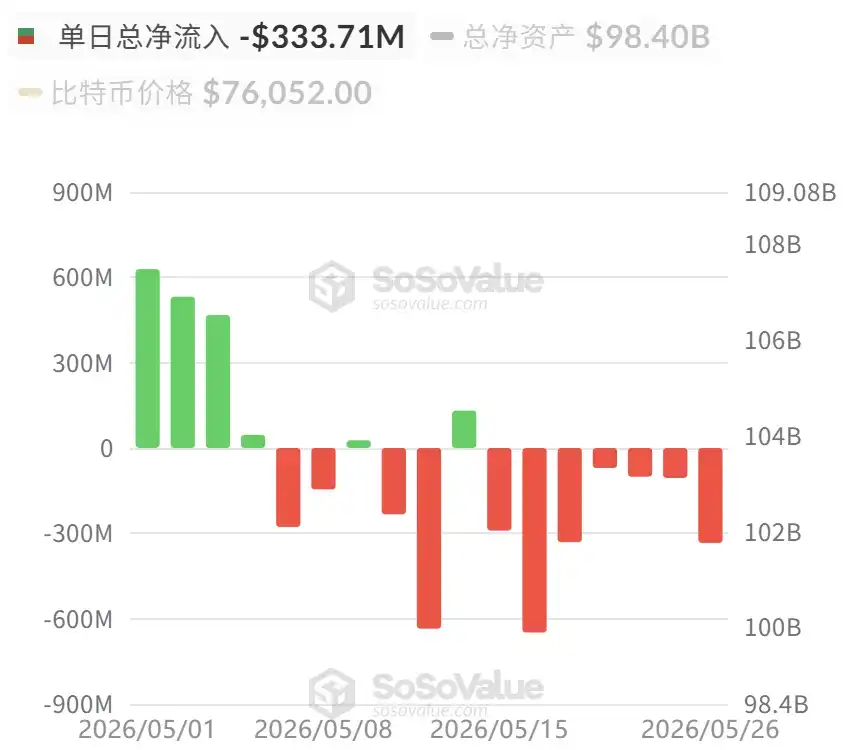
According to tracking data from SoSoValue, between May 5 and 26, US Bitcoin ETFs recorded consecutive net outflows, with daily outflow amounts ranging from tens of millions of dollars to a peak of $600 million, occurring twice.

The situation for spot Ethereum ETFs is similarly pessimistic, mirroring Bitcoin with substantial net outflows since early May.
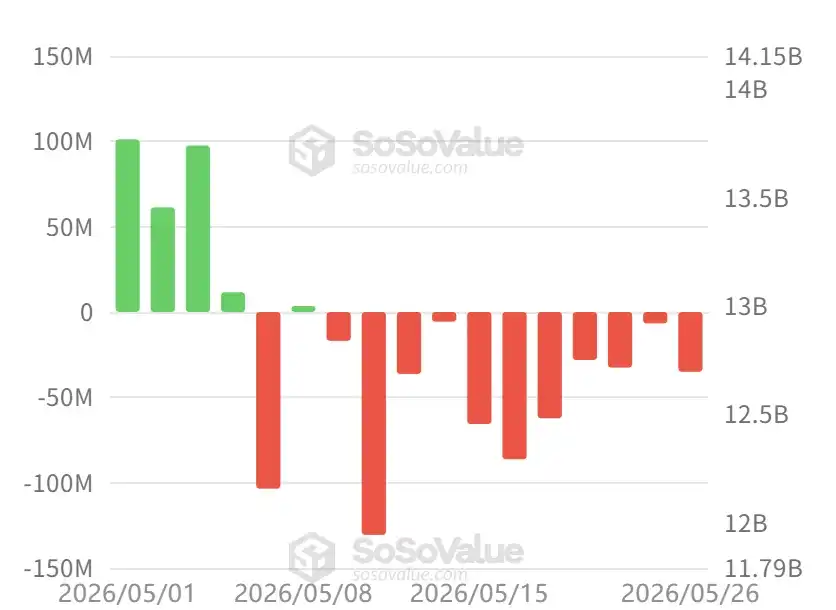
This may not be simple "panic selling," but more likely systematic profit-taking by earlier gainers. ETF holders include traditional asset managers, family offices, and hedge funds, who have chosen to lock in profits via the redemption mechanism after Bitcoin's recovery from lows to the $75,000-$80,000 range. Some funds may have rotated into better-performing AI-related tech stocks—the S&P 500 and Nasdaq indices hitting new highs during the same period, while the crypto market underperformed overall, highlighting capital reallocation within risk assets.

Subsequent Trends

Wintermute published a post stating that BTC's consecutive two weeks of over $1 billion in ETF outflows (following six weeks of inflows) indicate institutions are capitalizing on strength to realize some recent positive returns. More noteworthy is AI. Nvidia delivered a textbook-level performance exceeding expectations, but there was almost no post-market movement. Incremental beats are no longer moving the needle. If the AI momentum fades, the macro picture (record-low consumer confidence, sticky inflation, a hawkish Fed under Governor Waller) will gain more weight, and cryptocurrencies will not be immune.

BTC's long-term structure remains sound (reserves at multi-year lows, long-term holders continue accumulating, CLARITY progressing, HYPE doing what major tokens should do early on). But short-term price is driven by capital flows, and currently, they are negative. The $75,000 to $76,000 range is a key line for BTC. Holding here, BTC will reattempt to assault $80,000; breaking below this range could lead to a quick slide towards $70,000 to $72,000.

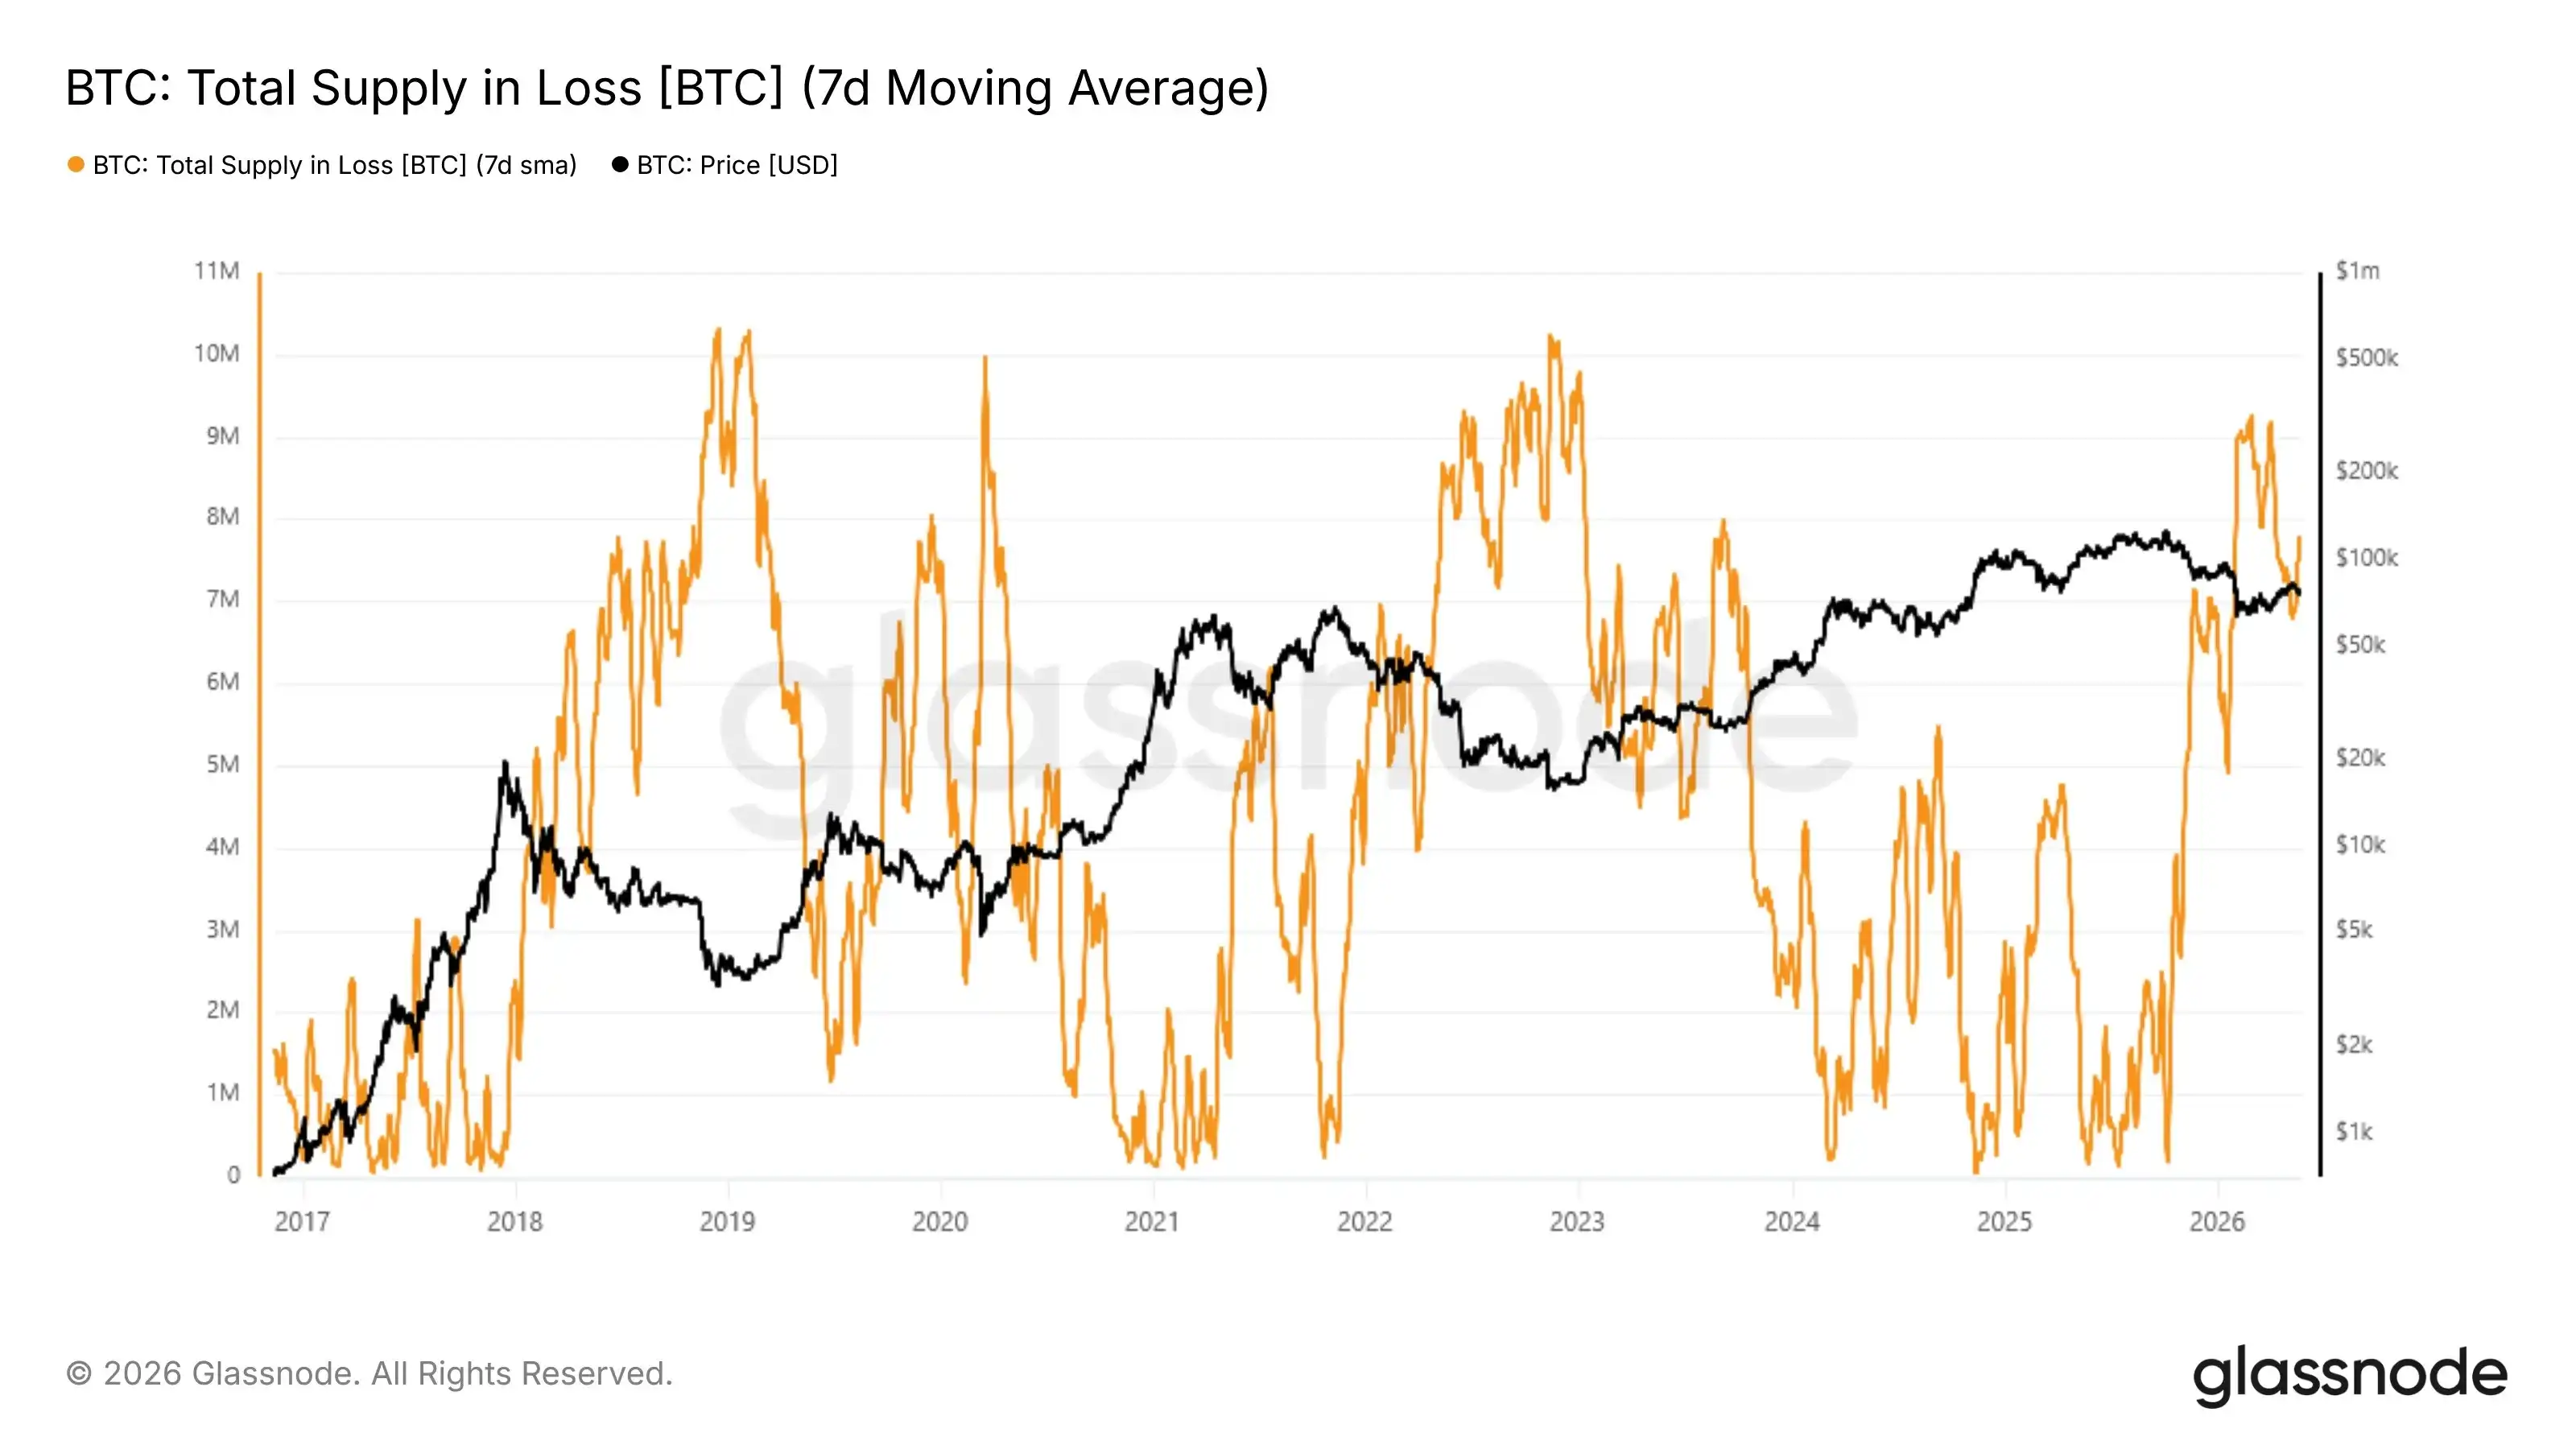
glassnode tweeted that at a price of $76,000, approximately 7.75 million BTC are in a loss position. This supply overhang is a structural feature of bear markets and is typically only resolved when weak hands capitulate.
BIT tweeted that, regarding Bitcoin, the sustained rally over the past period largely depended on the interplay between institutional demand and market supply available for sale. Over the past year, Bitcoin spot ETFs and Strategy have been significant sources of such demand. When ETF inflows accelerated and Strategy continuously increased Bitcoin holdings, Bitcoin prices typically continued to rise.
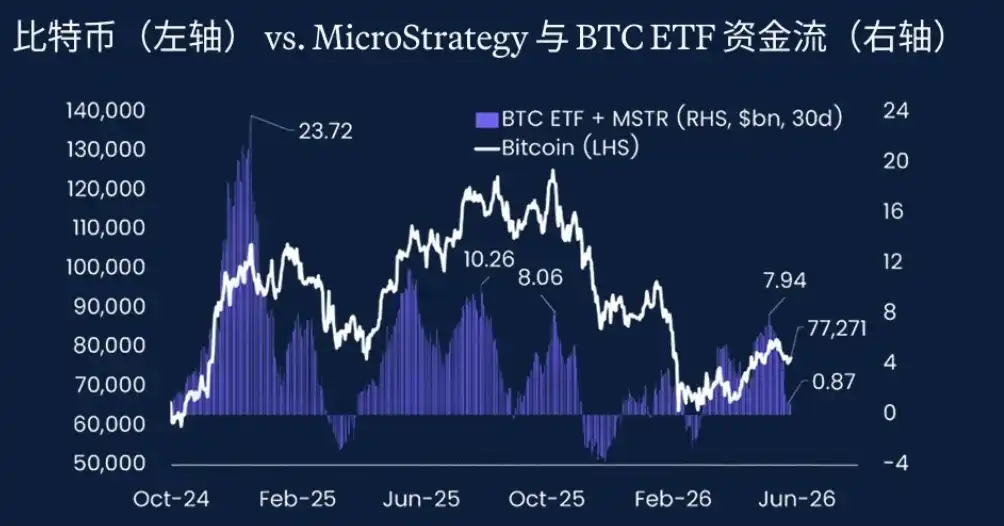
BIT stated that the combined net purchases of ETFs and Strategy have now fallen to only $870 million, primarily due to significant ETF outflows, shifting from net buying to net selling. Before ETF inflows stabilize and rebound, Bitcoin may remain in a consolidation phase in the short term.

Analyst Murphy stated that using the on-chain indicator "Weight of Short-Term Capital Activity" (i.e., the USD value proportion represented by short-term coin turnover), one can observe the current state of the BTC market. This indicator reflects the latest short-term trading behaviors like speculation, arbitrage, profit-taking, or panic selling. Currently, this weight has fallen to historically extreme lows, only seen at the absolute bottom of bear markets in the past 15 years. This means short-term turnover has significantly cooled down, economic value is sedimenting towards long-term holdings, and the market is in a phase of low volatility, accumulation, or with pronounced bottoming characteristics.
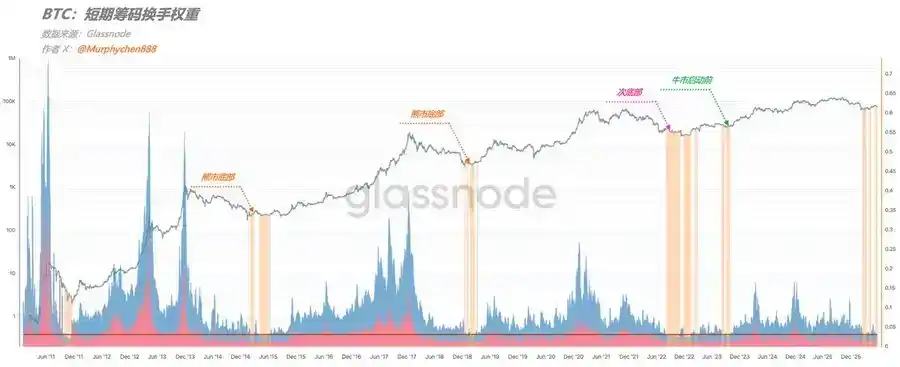
Murphy's judgment, based on this, is that the current market might be in one of three phases: the bottom of a bear market; a sub-bottom, possibly with one last drop; or accumulation before a bull market launch. However, rational judgment can temporarily rule out pre-bull accumulation. It's currently not advisable to fully bet on a single scenario; a diversified portfolio strategy to cope with different outcomes is recommended. The relative position on the long-term macro direction indicates Bitcoin is near a bottom.


Preguntas relacionadas

QAccording to the article, what happened to Bitcoin's price on May 28th and what is a key support level mentioned?

AOn May 28th, the Bitcoin price failed to hold above the $75,000 level and slipped to around $74,000. The article mentions that the $75,000 to $76,000 range is a critical line for Bitcoin; holding here could allow it to rechallenge $80,000, while breaking below could lead to a quick slide toward $70,000 to $72,000.

QWhat are the two main external factors cited in the article as contributing to the recent market pressure on cryptocurrencies?

AThe two main external factors are: 1) Renewed geopolitical tensions in the Middle East, specifically between the US and Iran, which increases risk-off sentiment and strengthens the US dollar. 2) Sustained net outflows from US Bitcoin and Ethereum spot ETFs, indicating profit-taking by institutional investors.

QWhat does the analysis from Wintermute suggest about the relationship between the AI sector and cryptocurrency markets in the current context?

AWintermute suggests that the AI sector has been attracting capital. They note that if the momentum in AI stocks (exemplified by Nvidia) fades, the broader negative macro picture would gain more weight, and cryptocurrency markets would not be immune to the resulting pressure.

QAccording to analyst Murphy's on-chain indicator, what are the three possible market stages Bitcoin could currently be in?

ABased on the 'short-term fund activity weight on-chain' indicator, analyst Murphy suggests the current market could be in one of three stages: 1) The bottom of a bear market. 2) A secondary bottom, possibly before one final drop. 3) Accumulation before a bull market launch. However, he rationally excludes the bull market pre-accumulation scenario for now.

QWhat is the reported state of the market fear and greed index, and what does the data from Coinglass show about liquidations in the past 24 hours?

AThe market fear and greed index has fallen to 34, indicating a state of 'fear'. Coinglass data shows that over the past 24 hours, $470 million worth of contracts were liquidated across the network, with long positions accounting for $420 million of that total.

Lecturas Relacionadas

Justin Sun’s Interview with Hurun Report: A New Order and Certainty for Value Flow in the Era of Transformation

In an interview with *Hurun Report*, Justin Sun, founder of TRON, discussed the evolution of the Web3 industry as it moves from initial exploration to large-scale adoption. He emphasized that the core value of blockchain lies in building an open and inclusive internet of value, enabling anyone globally to transfer and use funds efficiently and at low cost, regardless of location or access to banking. Sun highlighted that projects with lasting impact are those built on genuine demand and real-world usage. He pointed to the stablecoin payment ecosystem as the most mature and scalable application currently, noting that TRON has rapidly become one of the world's largest stablecoin networks. The circulation of USDT on TRON has surpassed $86.3 billion, driven by actual use cases such as cross-border transfers and daily payments, demonstrating strong network effects. Regarding strategy, Sun outlined a methodology combining data-driven iteration, rapid execution, and user-centric focus. He cited the decision to partner with Tether to launch TRC-20 USDT as a key strategic move, based on an assessment of market trends and long-term potential, which has become a significant growth engine for the TRON ecosystem. On globalization, Sun stressed the importance of local compliance and cultural adaptation, noting that success in different markets depends on deep understanding and local partnerships. He also addressed the convergence of AI and blockchain, describing it as a transformative direction where blockchain provides decentralized infrastructure for AI, while AI enhances the intelligence and user experience of blockchain systems. For industry participants and young entrepreneurs, Sun advised continuous learning and adaptability in a fast-changing environment, focusing on building irreplaceable core strengths rather than spreading resources too thinly. Through infrastructure development, global strategy, and technological foresight, TRON aims to advance the practical implementation and evolution of the value internet.

marsbitHace 29 min(s)

Justin Sun’s Interview with Hurun Report: A New Order and Certainty for Value Flow in the Era of Transformation

marsbitHace 29 min(s)

Samsung Leverages Technology Cycles, SK Hynix Relies on HBM, What Enabled Micron to Win a Trillion-Dollar Market Cap?

Micron Technology, the Idaho-based memory chip maker, recently saw its market cap surpass $1 trillion, securing its position as one of the top three DRAM manufacturers alongside Samsung and SK Hynix. Its survival and growth story is marked by a unique combination of political maneuvering and hard-won manufacturing efficiency, but also strategic missteps that now challenge its future. Founded in 1978 in Boise without significant government or capital backing, Micron repeatedly turned to Washington for survival during critical junctures. In the 1980s, it filed anti-dumping complaints against Japanese firms, leading to the U.S.-Japan Semiconductor Agreement. Ironically, this created an opening for Samsung, which Micron had earlier licensed its 64K DRAM technology to. In 2002, Micron avoided heavy fines in a price-fixing investigation by acting as a whistleblower against its competitors, cementing its reputation as a "political opportunist." A major strategic error occurred in 2013 with its $2.5 billion acquisition of bankrupt Japanese firm Elpida. This deal burdened Micron with integrating incompatible manufacturing processes just as the industry was pivoting toward HBM (High Bandwidth Memory), a critical technology for AI. SK Hynix had launched its first HBM chip that same year. By the time AI demand exploded with ChatGPT in 2022, SK Hynix commanded about 85% of the HBM3 market, while Micron, playing catch-up, held only around 3%. In 2017, Micron employed similar tactics against a new competitor, Chinese startup Fujian Jinhua, by alleging intellectual property theft, which led to U.S. sanctions effectively crippling the firm. However, this strategy backfired in 2023 when China banned Micron's products from its critical infrastructure, causing its revenue share from China to plummet from 14% in FY2023 to just 7.1% by FY2025. Today, Micron faces a triple squeeze: it lags in the high-margin HBM race, faces pricing pressure in low-end DRAM from Chinese manufacturers like CXMT, and has lost crucial access to the booming Chinese AI server market. Despite its political strategies, Micron's core strength is its exceptional manufacturing cost control, achieved through decades of engineering. Its DRAM chips have a smaller cell area than its rivals, yielding more chips per wafer. This efficiency has been vital for weathering industry downturns. However, this advantage cannot compensate for the decade lost in HBM development. Micron is now racing to ramp up production of its HBM3E, certified by NVIDIA, and develop HBM4. Its future hinges on whether it can close this technological "time debt" through relentless R&D and execution, in a marathon where its competitors, having started earlier, are not slowing down.

marsbitHace 48 min(s)

Samsung Leverages Technology Cycles, SK Hynix Relies on HBM, What Enabled Micron to Win a Trillion-Dollar Market Cap?

marsbitHace 48 min(s)

Deconstructing Mysterious Researcher Serenity's Chokepoint Algorithm and the Global Revaluation of Equity Assets

Unmasking Serenity's "Chokepoint Theory": A Framework for AI-Era Investment This article deconstructs the investment methodology of the pseudonymous online researcher Serenity (formerly AleaBito on Reddit), who claims extraordinary returns by identifying critical bottlenecks in AI and robotics supply chains. Rejecting Wall Street's typical top-down analysis, Serenity employs a bottom-up, reverse-engineering approach. Starting with an end product like an Nvidia GPU cluster, he meticulously maps the global supply chain down to its most essential, irreplaceable physical components—the "choke points." These are low-profile, often monopolized sub-sectors where a disruption could paralyze entire downstream industries, analogous to a strategic strait controlling global oil flow. His primary focus is the physical evolution of AI data centers, specifically the shift from copper interconnects to silicon photonics and Co-Packaged Optics (CPO). He identifies five critical, monopolized technical barriers within CPO: high-precision fiber alignment components (e.g., FOCI), external light sources and high-power lasers (e.g., SIVE), molecular beam epitaxy equipment (ALRIB/Riber), ultra-high-purity red phosphorus raw materials, and Silicon-on-Insulator (SOI) wafers (Soitec). Serenity extends this framework to humanoid robotics, arguing that while the AI "brain" resides in the US, the physical "body" hardware (actuators, gears, motors) is dominated by Asian manufacturers. He highlights a looming "demand tsunami" for specific rare earth elements essential for robot motors, presenting a severe future supply chain and geopolitical challenge. The article cites several of his investment targets (RPI, SIVE, Soitec, VLN, NBIS) where identifying such choke points, coupled with correcting market mispricings (e.g., ticker code confusion for VLN), allegedly led to significant re-ratings. Ultimately, the article posits that Serenity's core value is not in providing stock picks, but in demonstrating a paradigm: using deep technical analysis to find the silent, indispensable "physical switches" within complex systems, thereby exploiting institutional research blind spots. However, it warns of major risks, including illiquidity in micro-cap stocks, potential "pump-and-dump" accusations, and the foundational gamble that his identified technological paths (like CPO) are the correct and inevitable ones.

marsbitHace 50 min(s)

Deconstructing Mysterious Researcher Serenity's Chokepoint Algorithm and the Global Revaluation of Equity Assets

marsbitHace 50 min(s)

Cross-strait Regulators Jointly Block Hong Kong Stock Account Openings: Where Can Your Money Go Now?

**Summary:** On May 22, 2026, financial regulators in mainland China and Hong Kong launched a synchronized crackdown targeting informal channels used by mainland investors to trade in Hong Kong and US stocks via Hong Kong-based securities firms. The Hong Kong Securities and Futures Commission (SFC) issued a stringent circular to licensed brokers, mandating stricter onboarding procedures for mainland clients. New requirements include a mandatory written declaration stating that all investment funds originate from *outside* mainland China and are from legal sources. The SFC also demanded the closure of accounts opened with suspicious documents and dormant accounts. Simultaneously, China's securities regulator, along with seven other ministries, initiated a two-year rectification plan, penalizing firms like Futu and Tiger Brokers for illegal cross-border operations. This effectively ends the previously common grey-area practice for mainlanders. Immediate impacts are evident. Social media reports show mainland investors traveling to Hong Kong for in-person account openings are now frequently denied after signing the new declaration, even at firms like uSMART that still accept applications. The declaration acts as both a compliance shield for brokers and a filter for clients. While major internet brokers have halted new mainland accounts, limited options remain. A few Hong Kong-licensed firms like uSMART, Fosun Wealth, and Cheerful still offer avenues, but approval is not guaranteed and hinges on proving offshore fund sources. Crucially, funding accounts must now be in the investor's own name at qualified Hong Kong or international banks, blocking previous informal methods like third-party transfers. For compliant access, official channels like Stock Connect, QDII, and the Cross-boundary Wealth Management Connect remain open. Individuals with verifiable overseas residency or status have better prospects. The crackdown signals the definitive end of the loosely regulated expansion period, forcing mainland investors toward stricter, fully compliant pathways for overseas asset allocation.

marsbitHace 55 min(s)

Cross-strait Regulators Jointly Block Hong Kong Stock Account Openings: Where Can Your Money Go Now?

marsbitHace 55 min(s)

Iran and the Fed -- Three Scenarios That Will Impact Global Markets Next

"Three Scenarios for Iran and the Fed Shaping Global Markets" Iranian geopolitics and the Fed's monetary policy path are two dominant themes for markets. Deutsche Bank Research outlines three scenarios linking Iran ceasefire outcomes to Fed policy, with oil prices as the key transmission channel. **Scenario 1: Peace Deal.** A breakthrough leading to the Strait of Hormuz reopening would ease near-term Fed tightening pressure. Recent inflation would be viewed as a temporary energy shock. However, medium-term risks remain; rate hikes could resurface in 2027 if inflation persists. **Scenario 2: Stalemate.** A breakdown in talks and a prolonged Strait closure, but no major escalation, is deemed the scenario with the *highest* Fed hike risk. Sustained high oil prices would feed into core inflation and threaten inflation expectations, while not severely damaging demand enough to give the Fed a reason to pause. This environment could necessitate multiple Fed rate hikes in 2026. **Scenario 3: Conflict Escalation.** Renewed conflict and sharply higher oil prices create a two-way risk for Fed policy. On one hand, it would risk severe inflation expectations de-anchoring, forcing a hawkish response. On the other, extreme oil prices could severely damage demand and the labor market, potentially shifting the Fed's focus toward easing. The ultimate policy decision would depend on which risk materializes first. Overall, Deutsche Bank's framework emphasizes that the path for oil prices, dictated by Iran, will define the nature of inflation pressures and ultimately determine the Fed's policy space. Key signals to watch include ceasefire progress, whether Brent crude stabilizes below $100, and any shift in Fed officials' rhetoric from discussing cuts to potential hikes.

marsbitHace 1 hora(s)

Iran and the Fed -- Three Scenarios That Will Impact Global Markets Next

marsbitHace 1 hora(s)

Trading

Spot
Futuros
活动图片