Author: Claude, Deep Tide TechFlow
Deep Tide Guide: CryptoQuant's Bull-Bear Market Cycle Indicator has turned positive for the first time since October 2025, while another core indicator, the Bull Score Index, rose to the neutral zone of 50 in late April. Bitcoin has closed higher for three consecutive months, rebounding from a February low of around $60,000 to above $81,000. However, the precedent from 2022 serves as a reminder: similar signals failed about a week later, followed by a continued deep price decline.
Bitcoin on-chain data is releasing a long-awaited positive signal.
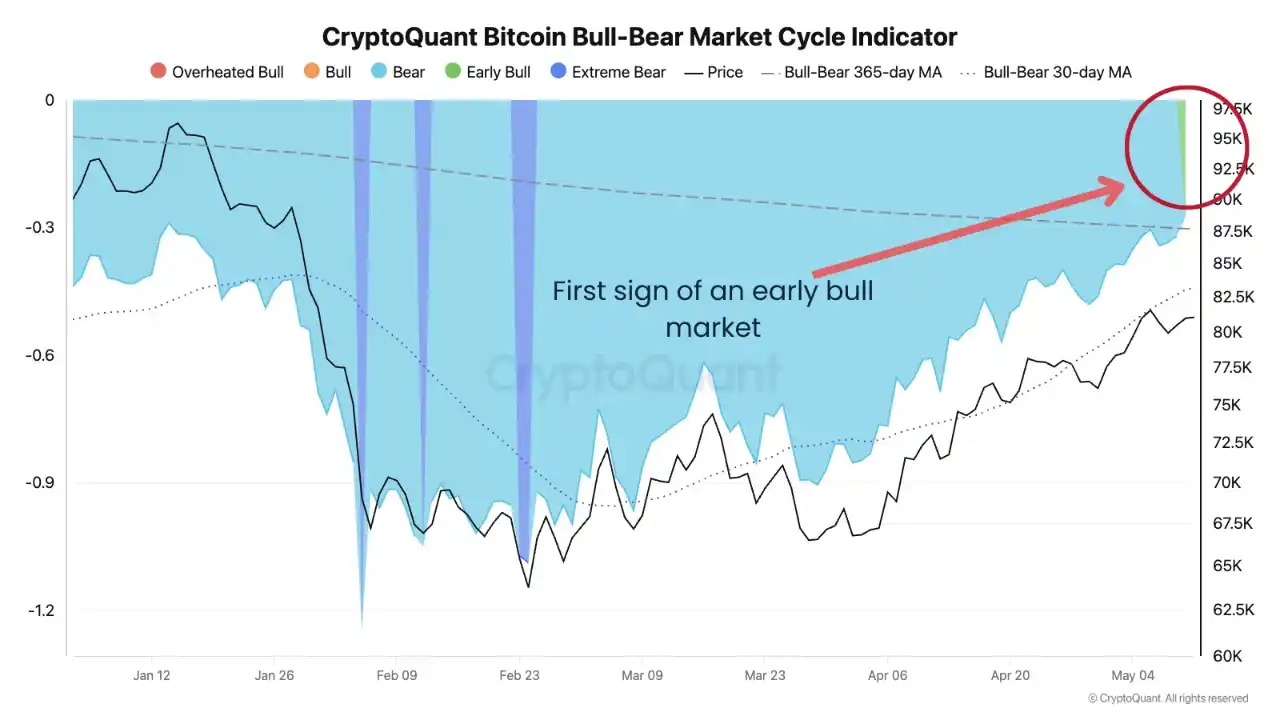
According to data from the CryptoQuant platform, its Bull-Bear Market Cycle Indicator has recently flipped back into positive territory, the first time since the P&L Index fell below its 365-day moving average in October 2025.
This indicator determines whether Bitcoin is in a bull or bear market cycle by measuring the distance between the P&L Index and its 365-day moving average. The P&L Index itself integrates three core on-chain metrics: the MVRV Ratio, NUPL, and the SOPR of long-term and short-term holders, serving as CryptoQuant's unified valuation tool to assess whether Bitcoin's price is overvalued or undervalued.
As of writing, Bitcoin is trading around $81,000, a rebound of over 35% from the cycle low of around $60,000 in early February.
Source: CryptoQuant, original analyst MorenoDV_
From Deep Bear to First Positive Flip: On-Chain Recovery Took 7 Months
Reviewing the on-chain trajectory of this bear market: after Bitcoin's crash from its all-time high of $126,000 in October 2025, the Bull-Bear Cycle Indicator quickly plunged into negative territory. According to a Cryptonomist report in February of this year, the indicator dropped to approximately -1.2 in early February, comparable to the lows seen during the COVID-19 crash in March 2020. A CryptBull report from the same period also confirmed that the indicator reading had reached its lowest level since the bottom during the FTX crash in 2022.
From the deep bear bottom in February to the recent positive flip, the recovery took about three months. This pace is faster than the 2022 cycle (where the indicator remained in negative territory for about 12 months), but given that this cycle's peak-to-trough decline was about 55% (from $126,000 to less than $60,000), the sustainability of the recovery remains debatable.
Bull Score Index Simultaneously Rises to Neutral, Multiple Indicators Resonate
The positive flip of the Bull-Bear Cycle Indicator is not an isolated event.
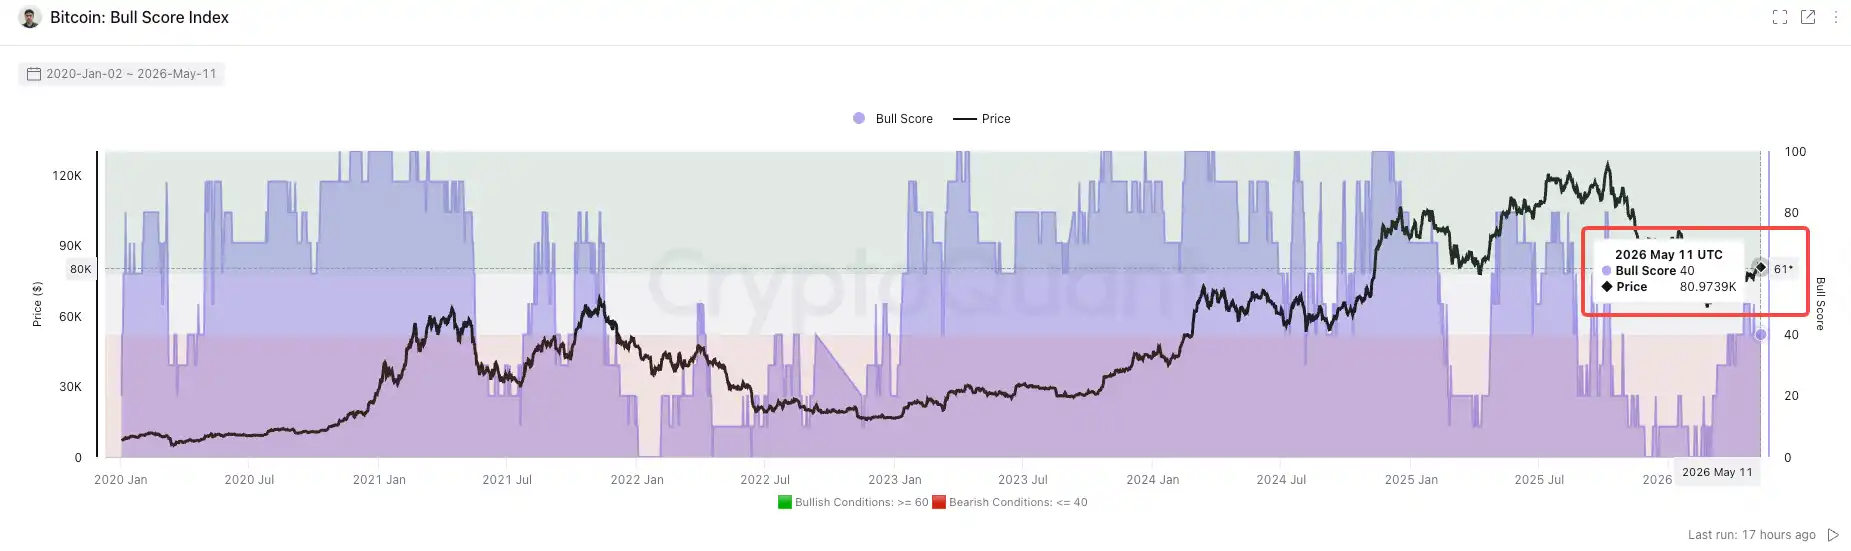
According to a CoinDesk report on April 23, CryptoQuant's other core indicator, the Bull Score Index, simultaneously rose to a neutral reading of 50, the first time for this index since Bitcoin began its decline from the $126,000 high.
The Bull Score Index synthesizes 10 on-chain indicators, covering dimensions such as blockchain activity, investor profitability, and liquidity. Readings below 40 typically indicate a structural bear market, while readings above 60 point to a strong, sustainable uptrend.
CryptoQuant Head of Research Julio Moreno commented on this, stating it's the first time during this bear market that the Bull Score Index has entered the neutral zone. However, he simultaneously referenced the precedent from March 2022: back then, the index also briefly rose to 50 but lasted only about a week, after which the price continued to decline significantly.
Improvement at the price level is also evident. Bitcoin closed up approximately 2% and 12% in March and April, respectively, with gains of about 6% so far in May, marking three consecutive months of positive returns.
Precedent of the 2022 "False Signal": History May Not Repeat, But the Market Remembers
The market's biggest skepticism about the current positive signals stems from the historical lesson of 2022.
In March of that year, the Bull Score Index briefly rose to the neutral zone of 50, after which Bitcoin fell from around $47,000 all the way to $16,000. The Bull-Bear Cycle Indicator also briefly turned positive in 2022 but ultimately continued its deep decline amidst the successive shocks of the Luna/UST and FTX implosions.
However, there are structural differences between this cycle and 2022. Spot Bitcoin ETFs, since their launch in January 2024, have become a significant anchor for institutional demand. According to a SpotedCrypto report, net inflows into Bitcoin spot ETFs reached $2.44 billion in April, the strongest month since October 2025. Glassnode data shows that the number of whale addresses holding 1,000 BTC or more has increased by 142 over the past 6 months. Furthermore, Glassnode's RHODL Ratio currently stands at 4.5, the third-highest reading in Bitcoin's history. The two previous similar highs occurred at the cycle bottoms in 2015 and 2022, respectively, both followed by sustained bull markets.
StoneX Global Head of Research Matt Weller provided a more cautious reference framework in the Q2 outlook.
Based on Bitcoin's four-year halving cycle timeline, the lasting bottom of this cycle might not appear until around Q4 2026. If the historical pattern holds, the decline from peak to trough would be approximately 60%, corresponding to a price of around $50,000.
For traders, the real implication of the current signals might be:
The most panicked phase may be over, but it is still premature to declare the start of a new bull market. Bitcoin needs to break through and hold above the resistance of the 200-day moving average around $82,000 to provide more convincing technical confirmation of a trend reversal.