Бывший руководитель Goldman Sachs Raoul Pal говорит, что существует один график Ethereum (ETH), который трейдеры должны держать в поле зрения.
В новом анализе Pal указывает на график "Ethereum сегодня против аналога 2017-2021 гг.", который, если следовать ему, указывает на то, что ETH в настоящее время находится вблизи дна медвежьего рынка.
"Очевидно, что ценовые аналоги никогда не работают идеально, но это все равно интересно иметь на своем радаре".
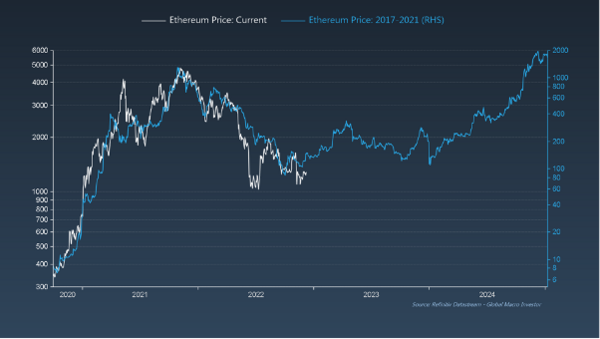
Источник: Global Macro Investor
На момент написания статьи Ethereum торгуется на уровне $1 270. За последние 24 часа криптоактив, занимающий второе место по рыночной капитализации, вырос почти на 1,99%.
Аналитик также рассматривает один график, который, по его словам, демонстрирует крайне медвежьи настроения инвесторов фондового рынка.
"Кроме того, буквально ВСЕ уже настроены по-медвежьи; этот график говорит сам за себя и датируется 1970 годом".
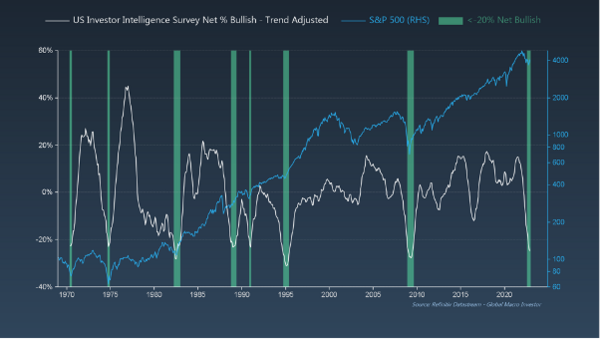
Источник: Global Macro Investor
Глядя на график, Pal предполагает, что S&P 500 также может быть близок к дну, основываясь на его исторической корреляции с рыночными настроениями на протяжении более 50 лет.
Хотя Pal считает, что рецессия не за горами, он говорит, что экономический спад может стать катализатором для политиков, чтобы ослабить денежно-кредитную политику.
"Мы расходимся во мнениях не столько по поводу масштабов рецессии (ISM может легко достичь отметки 40), сколько по поводу продолжительности самой рецессии. В то время как консенсус по-прежнему говорит об увеличении финансовых условий в следующем году и, следовательно, об укоренении глобальной рецессии, мы видим, что происходит обратное...
Наши опережающие индикаторы указывают на то, что финансовые условия вскоре начнут смягчаться, причем потенциально значительно.
Финансовые условия (здесь инвертированные) уже настолько жесткие, как во время мирового финансового кризиса (+4 стандартных отклонения), а инфляционное давление уже начинает ослабевать. Доходность облигаций и доллар снижаются, так как рынок продолжает оценивать пик "ястребиной" политики Fed, и, если не произойдет ничего системного и укоренившегося (не наш базовый вариант), кредитные спреды не вырвутся наружу, как это было в 2008 году".
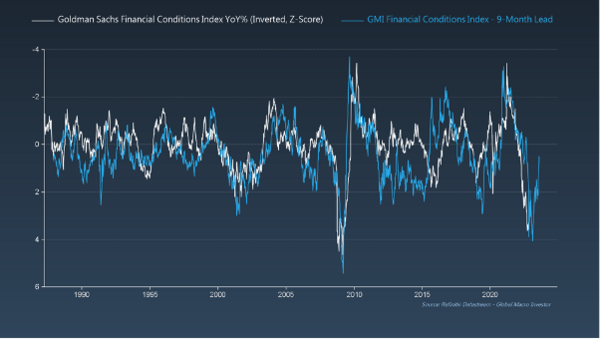
Источник: Global Macro Investor
Не пропустите ни одного удара - Подпишитесь, чтобы получать уведомления о криптовалютах по электронной почте прямо на ваш почтовый ящик