Crypto market bleeds out $100 billion in FTX drama aftermath

FinboldPublicado a 2022-11-09Actualizado a 2022-11-09

Resumen

After the developments surrounding one of the largest cryptocurrency exchanges sent shockwaves across the crypto sector, most of its participants continue to count their losses, with the market as a whole losing tens of billions of dollars.

After the developments surrounding one of the largest cryptocurrency exchanges sent shockwaves across the crypto sector, most of its participants continue to count their losses, with the market as a whole losing tens of billions of dollars.

“”

As it happens, the carnage following the FTX drama has inflicted a grievous wound to the crypto market capitalization, bleeding it by more than $100 billion in a day, as per data retrieved by Finbold from CoinMarketCap on November 9.

“”

Specifically, the global crypto market has dropped from $983 billion to $880 billion during the previous 24 hours, which means it has lost $103 billion or more than 10% during this period and $110 billion across the week.

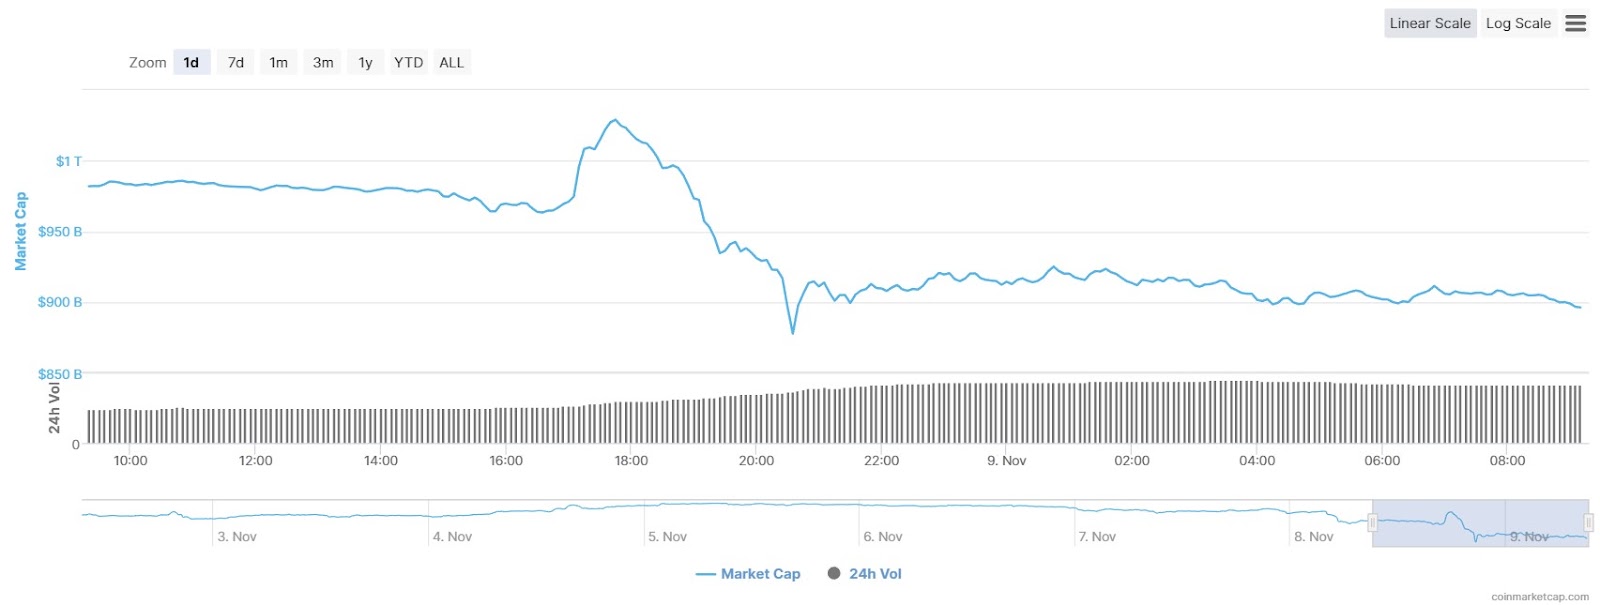
Total cryptocurrency market cap 24-hour chart. Source: CoinMarketCap

“”

Notably, the most significant decline happened hours after it became known that FTX was on the verge of collapse, with the market plummeting from its highest point of $1.027 trillion to as low as $827 billion.
“”

Crisis begins
“”
As a reminder, the crisis began after it was revealed that the balance sheet of Sam Bankman-Fried’s trading firm Alameda Research mainly consisted of the FTX Token (FTT), demonstrating a close connection between the two parts of his business empire.

“”

In response to this revelation, Binance liquidated $500 million worth of FTT on November 6, putting FTX in a bit of a liquidity crunch, and initiating some bickering on Twitter between the two, which OKX CEO warned could have devastating consequences.

“”

As a result, the FTX token sank as much as 80% in a single day, wiping almost $2.5 billion from its market cap, as Finbold earlier reported.
“”

Crisis averted?

“”

However, in a surprising turn of events, Binance reached out to its competitor on November 8 by making a non-abiding agreement to acquire FTX in a bid to help it recover and stop the crisis from spreading across the industry after the crypto exchange asked for assistance.

“”

That said, the damage already seems to be done, as the effects of the crisis have spilled over onto all other assets, including Bitcoin (BTC), which has dropped more than 9% on the day and is now trading at $17,917.

Bitcoin 24-hour price chart. Source: Finbold

“”

It remains to be seen how much Binance’s most recent actions will help alleviate these consequences as uncertainty continues to surround the market.

Lecturas Relacionadas

Bitcoin Trading Strategy Breakdown: Celebrity Predictions and Classic Models All Fail, Only These Four Indicators Remain

Analysis of Bitcoin Trading Strategies: Why Celebrity Forecasts and Classic Models Fail, Leaving Only These Four Reliable Indicators This analysis examines the failure of common Bitcoin prediction methods and identifies four reliable indicators for constructing a trading strategy. The author reviewed all major BTC prediction approaches from 2017-2025, categorizing them into three groups: celebrity price targets (consistently over-optimistic), analytical models like Stock-to-Flow (broken post-2022), and on-chain signals. The key finding is that more data often creates confusion, not clarity. The strategy discards unreliable elements: celebrity predictions (incentivized to be extreme), pure models (invalidated by post-ETF market changes), and the Fear & Greed Index used alone (too many false signals). Four reliable indicators were selected: 1. **MVRV Z-Score:** Accurately identifies cycle bottoms when entering its green zone (e.g., 2018, 2020, 2022). Note: Its ability to call tops is now ineffective post-2024. 2. **SOPR (28-day MA):** Consistently signals bottoms when below 1.0, indicating holders are selling at a loss. 3. **ETF Net Flow:** A crucial post-2024 metric showing institutional momentum (e.g., sustained inflows = buying). 4. **Macro Liquidity (Fed policy & M2):** Sets the overall directional bias (e.g., bullish during easing cycles). The core strategy involves waiting for a multi-signal共振 (resonance). For example, a bottom signal requires MVRV in the green zone + SOPR < 1.0. A top signal requires overheated on-chain data + sustained ETF outflows. Macro policy sets the overall direction. The Fear & Greed Index is only used as a weighted confirmatory signal, never alone. Action is only taken when three or more indicators align. The author automated this into a monitoring system that sends Telegram alerts only when signals trigger. As of the article's date (April 15, 2026), the system showed a strong bottom signal: extreme fear (F&G=12), MVRV in the buy zone, and SOPR < 1.0. The only contrary signal was weak ETF flows. Historically, such triple on-chain共振 has preceded 100%+ returns. The conclusion emphasizes building a personal framework over relying on external predictions, allowing for iterative improvement and customization based on individual risk tolerance.

marsbitHace 58 min(s)

Bitcoin Trading Strategy Breakdown: Celebrity Predictions and Classic Models All Fail, Only These Four Indicators Remain

marsbitHace 58 min(s)

Trading

Spot
Futuros
活动图片