[Key interpretation] Short positions were exploded, with 32000 BTCs

HuobiPublicado a 2022-10-28Actualizado a 2022-10-31

Resumen

btc

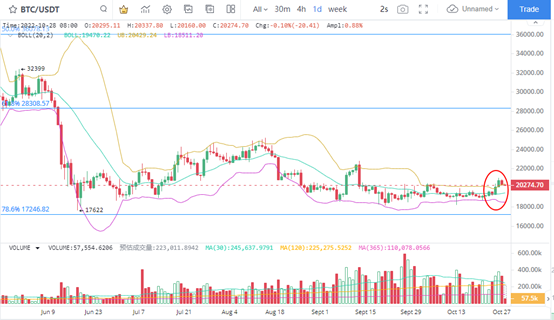
1. BTC rebounds to a short-term high

The daily K line chart of BTC shows that BTC prices have shown clear signs of recovery recently. On October 25 and 26, they rose by 3.8% and 3.4% respectively. The price market performance is relatively balanced and has reached the highest level since September 14. Therefore, it is of great benefit to the release of short-term pressure. During the period of price recovery, the daily trading volume of BTC effectively increased, further promoting the price to be better. ETH and other mainstream currencies rose with the rebound of BTC, and the market performance was relatively strong.

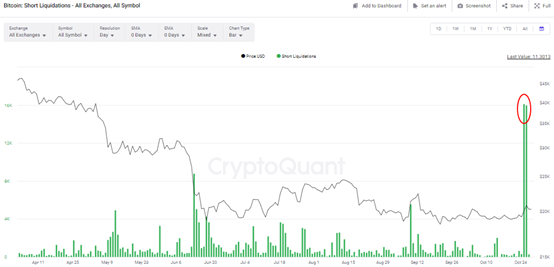
2. A large number of short positions of BTC

Due to the frequent horizontal adjustment of BTC in the early stage, the short contract positions were largely concentrated in the price range of $21000 to $19000. Therefore, even if BTC's short-term rise is not high, it still causes a large number of short positions to explode. In terms of the absolute value of short positions, 16143 and 15983 BTCs were blown out on October 25 and 26, respectively, with a value of 320 million dollars and 319 million dollars calculated at 20000 dollars. In terms of absolute position bursting, it has reached the highest value since December 2020. Therefore, the basis for BTC's strong short-term performance still exists.

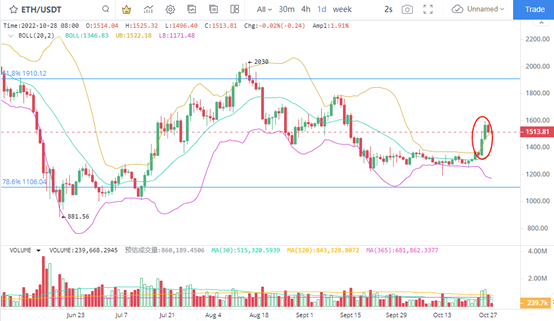
3. ETH performs best in a month

The bottom characteristics of ETH prices have been strengthening since two consecutive trading days. In terms of trading volume, the volume was increased on October 25 and 26 for two consecutive trading days, which is very effective for price coordination. Therefore, in judging the growth expectation, we can judge the low absorption opportunities according to the bottom pattern since September 16. In the vicinity of $1500, the ETH price will remain strong when the support is effective, and further increase can focus on the breakthrough performance after selling pressure and digestion.

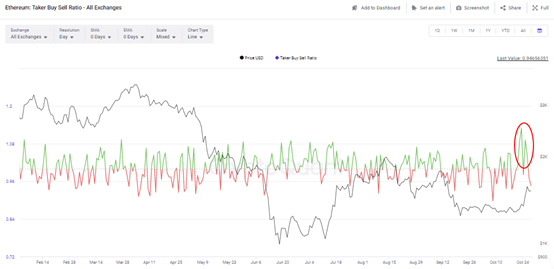
4. ETH long short ratio rebounds obviously

The recent price rebound of ETH has been synchronized with the counter attack of contract bulls, especially during the rally of contract long short ratio, which has verified the typical bullish signal. On October 23 and 25, the long short ratio rose to the high of 1.129 and 1.092. That is to say, the counter attack of the contract bulls was relatively ahead. As early as October 23, the long short ratio had reached the highest value since January 26, 2020. Therefore, ETH may maintain a strong momentum in the short term after the strength of its bulls has increased explosively recently.

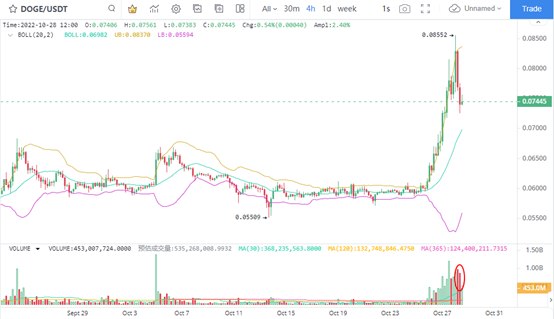
5. DOGE short-term counter attack

After the short-term surge of DOGE, the 4-hour K chart shows that the price has continued to show very obvious signs of callback. The short-term recovery of trading volume in the same period means that the selling pressure has been released relatively fully. More investors sell DOGE in the price range of 0.74 to 0.83.

On the news side, after Musk became the leader of Twitter recently, the discussion about the use of DOGE for payment also heated up again. Before that, Musk had proposed the idea of opening Twitter to accept payment with dog currency. In April this year, he tweeted, "Maybe you can choose to pay with dog currency?", Matt Wallace, a dog coin supporter who had more than 630000 Twitter followers at that time, immediately agreed and replied, "Dog coin is sprayed on the moon.".

In the short term, DOGE rebounded with the BTC price, and the transaction heat increased significantly. Next, we can focus on the support effect above US $0.7.

Lecturas Relacionadas

Report Interpretation: J.P. Morgan Details Micron's Pre-Earnings Sentiment, Current Hardware Sector Dynamics

Morgan Stanley analyst Joshua Meyers' report (June 21, 2026) highlights key trends in the hardware and semiconductor sector ahead of Micron's earnings. The core takeaways are: 1. **Micron & Memory:** Memory remains a high-conviction long theme, driven by strong AI demand and rising ASPs. However, investor focus is shifting to the sustainability of Micron's >80% gross margins and the specifics of potential new long-term supply agreements (SCAs). 2. **Hardware Supply Chain:** AI-related demand for servers, networking, and storage remains robust, but company performance is diverging. Celestica (CLS) shows improved margin confidence, Western Digital and Seagate benefit from pricing, Fabrinet (FN) sees predictable AI optics growth, and Teradyne (TER) anticipates a new Google customer. 3. **AI Capex & WFE Forecasts:** JPMorgan increased its Wafer Fab Equipment (WFE) market growth forecasts to 28% in 2026 and 29% in 2027. AI infrastructure financing is evolving, with higher project-level debt reducing constraints on capex expansion. The report signals that while the AI-driven hardware cycle is strong, the market is entering a phase focused on execution verification (e.g., Micron's SCA details, Fabrinet's ramp with Amazon) and valuation sustainability. Key near-term signals include Micron's guidance, Arista Networks' outlook, and the pace of demand normalization post potential tariff-related pull-ins.

marsbitHace 7 hora(s)

Report Interpretation: J.P. Morgan Details Micron's Pre-Earnings Sentiment, Current Hardware Sector Dynamics

marsbitHace 7 hora(s)

Research Report Analysis: The Fed's New Chair's Debut – New Leader, But Same Script?

Report Analysis: Federal Reserve's New Chair Debut – A New Captain, But the Same Script? Morgan Stanley's chief global economist Seth B. Carpenter analyzes the first FOMC meeting under new Fed Chair Kevin Warsh in a June 21 report. Warsh deliberately avoided providing forward guidance on interest rates, aligning with his philosophy. However, market expectations for a rate hike this year were reinforced. Key signals lie elsewhere: inflation may fall more than expected, and quantitative tightening (QT) could be more aggressive than anticipated. The FOMC's "dot plot" suggests only one rate hike in 2026. Carpenter argues that if inflation undershoots forecasts, the logic for even a single hike weakens, especially as projections indicate potential rate cuts in 2027. On QT, Warsh's stance is clear. Carpenter notes that measures like halving the Treasury's account balance could shrink the Fed's balance sheet by around $500 billion with minimal market impact. Combined with adjustments to reserve interest and liquidity rules, the ultimate QT scale may exceed expectations, though its market effect might be less disruptive unless the Fed actively sells Mortgage-Backed Securities (MBS). While Warsh initiated a review of the Fed's policy framework, the 2% inflation target remains intact for now. The report concludes that the market may be overestimating the significance of reduced forward guidance and the near-term rate hike risk, while potentially underestimating the scope and manageable nature of the coming balance sheet reduction. The key debates will hinge on upcoming core PCE data, the specifics of the QT path, and the framework review's findings.

marsbitHace 8 hora(s)

Research Report Analysis: The Fed's New Chair's Debut – New Leader, But Same Script?

marsbitHace 8 hora(s)

Critical Game Week: BTC Retracement Confirmation vs. HYPE Support Battle | Guest Analysis

This weekly analysis outlines a critical juncture for BTC and HYPE markets, focusing on key price level confirmations. **BTC Analysis:** BTC is at a pivotal point after a five-wave rally from the June 5th low of $59,100. The price has broken below a short-term rising channel's lower boundary, with the current move seen as a pullback to test this breakdown. Failure to reclaim this level could lead to a retest of the $59,000-$60,000 support zone. The core scenario hinges on this channel retest outcome. * **Key Levels:** Resistance at $64,500-$65,000 (channel boundary) and $69,500-$70,500. Support at $59,000-$60,000 and $55,000. * **Strategy:** A core bearish stance is maintained (20% short from last week), with short-term plans for tactical trades. Three detailed contingency plans (A/B/C) are provided for short positions on resistance tests or breakdowns, emphasizing strict stop-loss discipline. **HYPE Analysis:** HYPE shows strong momentum but is currently in a corrective phase after hitting a new high of $76.94. The price is retesting the crucial $64-$66 support area. * **Key Levels:** Resistance near $77 and $80-$82. Support at $64-$66 and $52-$54. * **Strategy:** The short-term approach is "buy on dips, avoid chasing rallies." A long position is considered only if clear stabilization signals appear at the $64-$66 or deeper $52-$54 support zones, with tight risk controls. **General Risk Management:** A standardized trailing stop-loss protocol is emphasized: set initial stop, breakeven at +1% profit, then trail stops upward to lock in gains. *Disclaimer: All analysis is presented as a personal trading framework, not investment advice. Market conditions are complex and require dynamic adjustment.*

marsbitHace 8 hora(s)

Critical Game Week: BTC Retracement Confirmation vs. HYPE Support Battle | Guest Analysis

marsbitHace 8 hora(s)

Trading

Spot
Futuros
活动图片