Helium (HNT) has been flushed in green, standing out from all the reds in the crypto space.
- HNT price bounces back from key support at $3.4
- Helium intraday trading volume registers 378% plunge
- HNT price to sprint past the $5 level
Helium price has bounced back from its support key spotted at $3.4, prompting a new rally which can spike past the $5 level.
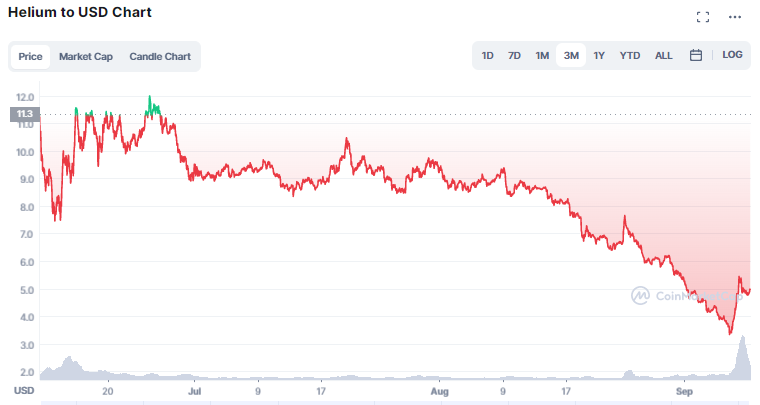
Based on the HNT technical chart, the token is showing a dip since it lost its grip on the key support found at $8.3 in August. HNT price has slumped by 59.6% as it nosedived to $3.32, its 52-week low so far.

Chart: TradingView.com
Regardless of how negatively the rest of the market is performing such as Bitcoin, which is dipped in red and fell under the $19,000 level, HNT price still reigns with the formation of an engulfing candle validating a bullish stance.
Apparently, the HNT price was able to recuperate from the $3.32 mark and skyrocketed by 30% hinting at a bullish reversal.
Helium Price Seen Rising 19%
According to CoinMarketCap, HNT price is up by 0.77% or $4.90 as of this writing,
The immense increase in terms of trading volume implies that buyers are going on an exciting shopping spree at discounted prices. With consistent buying pressure, Helium price may spike to as much as 19% before it taps on the psychological zone set at $5.
At this point, the HNT price can validate whether buyers are seriously committed despite the resistance and at the same time, this also tests whether the price is flexible and can still soar.
Regardless, a sudden spike in price is regarded to be uncommon, especially amid a tough bearish market.
With that in mind, the Helium price is projected to slide from the $5.9 resistance to retest the support found at $3.26.
RSI for Helium shows an aggressive growth spurt coming from the oversold region which shows the increase in demand at discounted prices. Now, a crossover that will hover above the midline can validate recovery.
HNT EMAs Indicate Downward Trajectory
The 20/50/100/20 EMAs show a rather vicious downside movement. Meanwhile, the vortex indicator shows a noticeable gap in between the VI+ and VI- indicating extreme sluggishness in bearish movement despite the pump in price.
HNT’s market capitalization has plummeted by as much as 50% from $1 billion to $492 million.
A couple of days ago, HNT is seen to have nosedived shedding off as much as 9% of its value as seen overnight. On a 30-day timeframe, HNT price is seen to have slumped by over 57% in over a month or down by 94% from its ATH.
Crypto total market cap at $983 billion on the daily chart