Giá Bitcoin bị kẹp trong cuộc họp FOMC 'chia rẽ nhất' khi chiến tranh Iran đẩy giá dầu tăng 8%

cointelegraphPublicado a 2026-07-29Actualizado a 2026-07-29

Resumen

Giá Bitcoin dao động mạnh quanh mức 64.000 USD vào thứ Tư, chịu áp lực từ căng thẳng địa chính trị và kinh tế vĩ mô ảnh hưởng đến thị trường chứng khoán Mỹ. Các điểm chính bao gồm: Bitcoin bị thu hẹp quanh 64.000 USD khi các nhà giao dịch đối mặt với nhiều yếu tố bất lợi vĩ mô; đà giảm từ cổ phiếu châu Á tiếp tục lan sang thị trường Mỹ; và Cục Dự trữ Liên bang Mỹ (Fed) chuẩn bị công bố quyết định lãi suất mới, một yếu tố có thể kích hoạt biến động cho tài sản rủi ro. Căng thẳng leo thang giữa Mỹ và Iran đã đẩy giá dầu tăng mạnh (WTI +7.6%, Brent +5.4%), làm dấy lên lo ngại về lạm phát và tác động đến kỳ vọng chính sách tiền tệ. Thị trường đang chờ đợi kết quả từ cuộc họp của Ủy ban Thị trường Mở Liên bang (FOMC), với dự báo chia rẽ cao về việc Fed sẽ giữ nguyên hoặc tăng lãi suất 0.25%. Về mặt kỹ thuật, giá Bitcoin hiện đang dao động trong một phạm vi giữa các đường trung bình động 50 ngày (SMA và EMA). Dữ liệu từ CoinGlass cho thấy các mức thanh khoản tiềm năng ở 63.500 USD và 64.900 USD. Tuy nhiên, khối lượng giao dịch spot vẫn ở mức thấp đáng chú ý, phản ánh sự quan tâm suy giảm của nhà đầu tư nhỏ lẻ kể từ mức cao kỷ lục của thị trường tiền mã hóa vào tháng 10/2025.

Bitcoin (BTC) biến động mạnh quanh mốc 64.000 USD vào thứ Tư khi căng thẳng địa chính trị và kinh tế vĩ mô gây áp lực lên thị trường chứng khoán Mỹ.

Điểm chính:

  • Bitcoin bị thu hẹp quanh 64.000 USD khi các nhà giao dịch phải đối mặt với nhiều trở ngại vĩ mô.
  • Sự sụt giảm ở thị trường chứng khoán châu Á tiếp tục lan sang thị trường Mỹ.
  • Cục Dự trữ Liên bang Mỹ chuẩn bị công bố quyết định tiếp theo về lãi suất, một yếu tố tiềm ẩn gây biến động cho tài sản rủi ro.

Rào cản với tài sản rủi ro chất đống trước cuộc họp FOMC

Dữ liệu từ TradingView cho thấy cặp BTC/USD dừng đà phục hồi cục bộ khi thị trường Wall Street mở cửa, sau khi chạm mức thấp nhất trong 11 ngày là 62.700 USD vào ngày hôm trước.
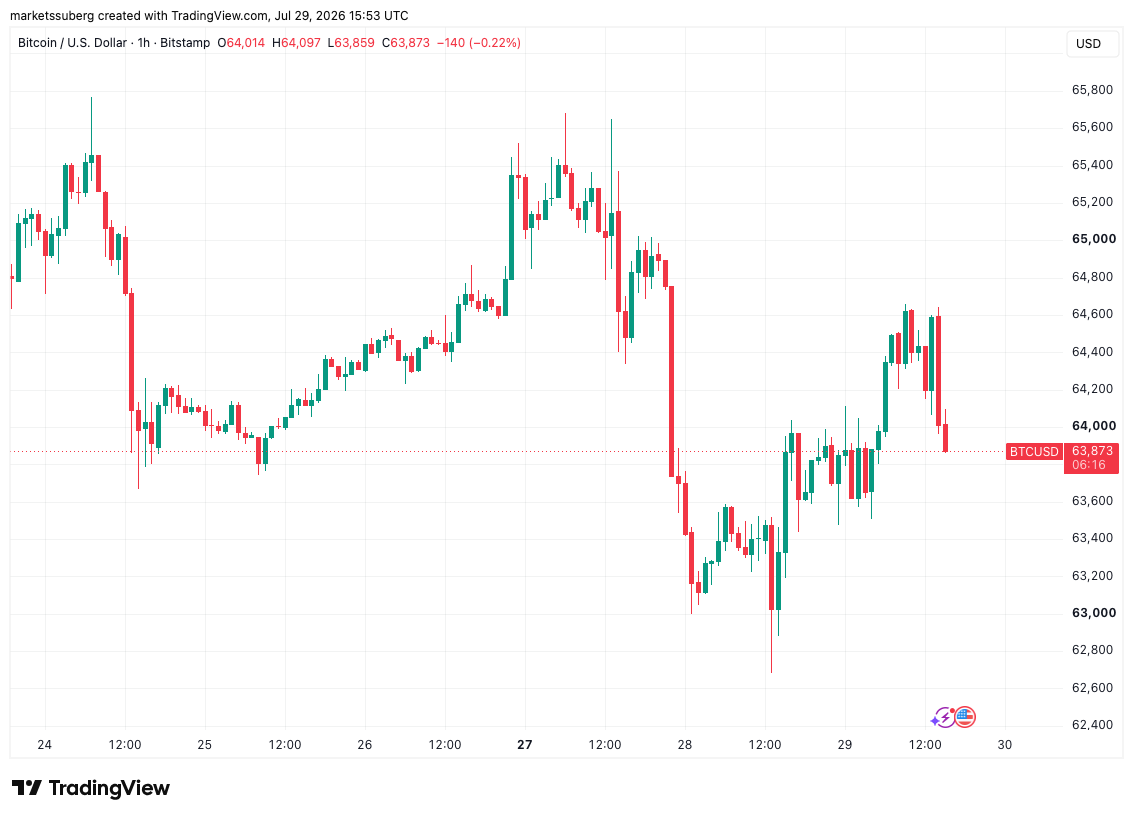
Biểu đồ một giờ của BTC/USD. Nguồn: Cointelegraph/TradingView


Những điều này diễn ra như một phần của cuộc bán tháo tài sản rủi ro do đợt bán tháo cổ phiếu chip tại châu Á. Xu hướng này tiếp tục vào thứ Tư khi thị trường ngày càng lo ngại về các nghĩa vụ nợ của các gã khổng lồ bán dẫn và AI.

Những lo ngại mới về leo thang trong cuộc chiến Mỹ-Iran đã bổ sung thêm áp lực, với Tổng thống Mỹ Donald Trump đe dọa sẽ 'đánh bại' khi các cuộc tấn công qua lại tiếp tục.

"Chúng ta sẽ đánh chúng mạnh. Chúng sẽ bị đánh bại," ông nói trong một cuộc phỏng vấn với Fox News.

Kết quả là giá dầu tăng vọt, với dầu thô WTI và Brent tăng lần lượt 7,6% và 5,4%. Việc giá dầu tăng có thể tác động đáng kể đến xu hướng của Chỉ số Giá tiêu dùng (CPI), với những lo ngại về lạm phát có tác động dây chuyền đến kỳ vọng lãi suất.
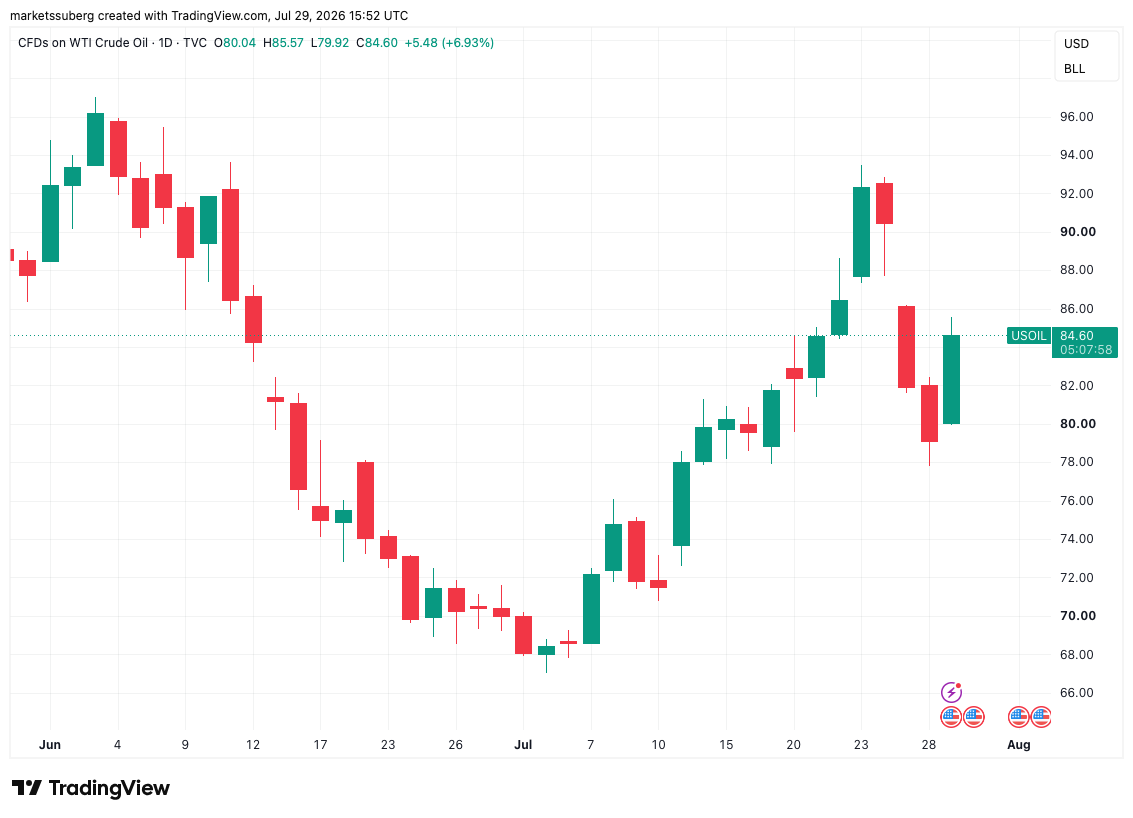
Biểu đồ một ngày của Hợp đồng CFDs trên dầu thô WTI của Mỹ. Nguồn: Cointelegraph/TradingView


Thị trường đang chờ đợi kết quả quyết định mới nhất của Cục Dự trữ Liên bang về lãi suất quỹ liên bang. Cuộc họp tháng Bảy của Ủy ban Thị trường Mở Liên bang (FOMC) sẽ bao gồm một tuyên bố và họp báo của Chủ tịch Fed, Kevin Warsh. Mặc dù Warsh đưa ra ít hướng dẫn hơn người tiền nhiệm, các nhà giao dịch sẽ theo dõi để tìm manh mối về các thay đổi chính sách trong tương lai.

Bình luận về sự kiện này, nguồn thông tin giao dịch The Kobeissi Letter lưu ý có sự chia rẽ ý kiến về động thái của Fed đối với lãi suất. Dữ liệu mới nhất từ Công cụ FedWatch của CME Group cho thấy xác suất 66,3% cho việc mức hiện tại là 3,5%-3,75% được giữ nguyên, với xác suất tăng 0,25% là 33,7%.

"Kỳ vọng của thị trường cho quyết định của Fed vào ngày mai là một trong những lần chia rẽ nhất trong lịch sử gần đây," họ viết.
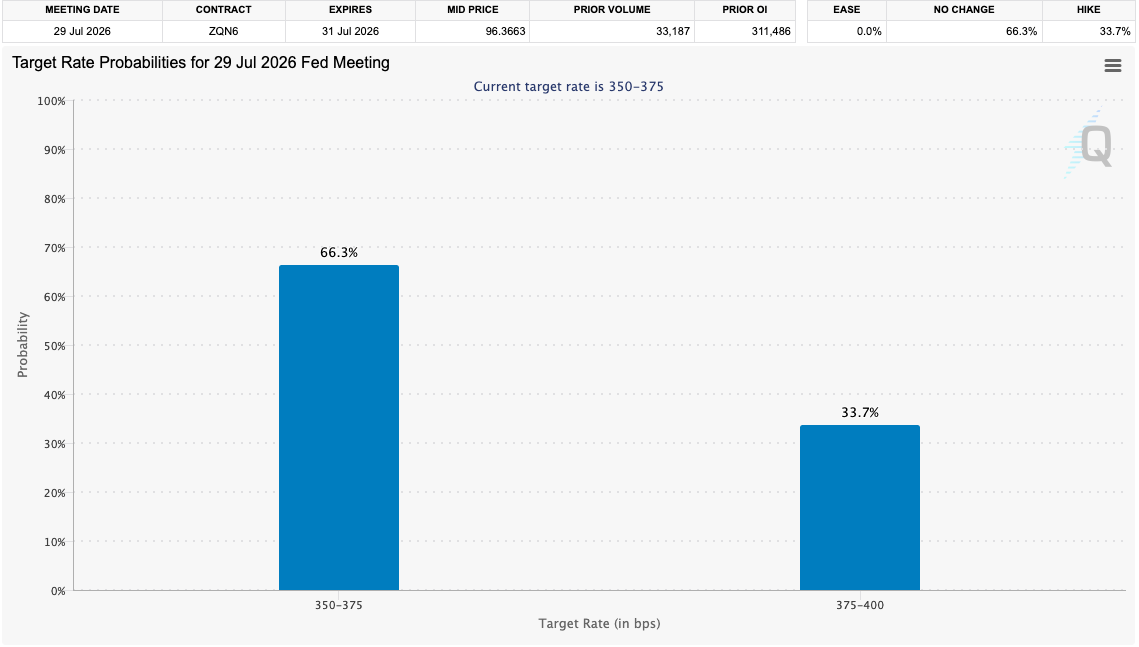
Kỳ vọng lãi suất mục tiêu của Fed cho cuộc họp FOMC ngày 29 tháng 7 (ảnh chụp màn hình). Nguồn: CME Group


Giá Bitcoin bị kẹp giữa các đường trung bình động hàng ngày

Trước các yếu tố xúc tác vĩ mô mới, hành động giá BTC diễn ra chủ yếu trong một phạm vi được giới hạn bởi đường trung bình động đơn giản (SMA) 50 ngày và trung bình động hàm mũ (EMA) 50 ngày của nó.

Có liên quan: Thị trường hướng mắt đến cuộc họp Ngân hàng Nhật Bản vào thứ Sáu khi đồng yên lặp lại mức thấp kỷ lục 40 năm so với đô la Mỹ
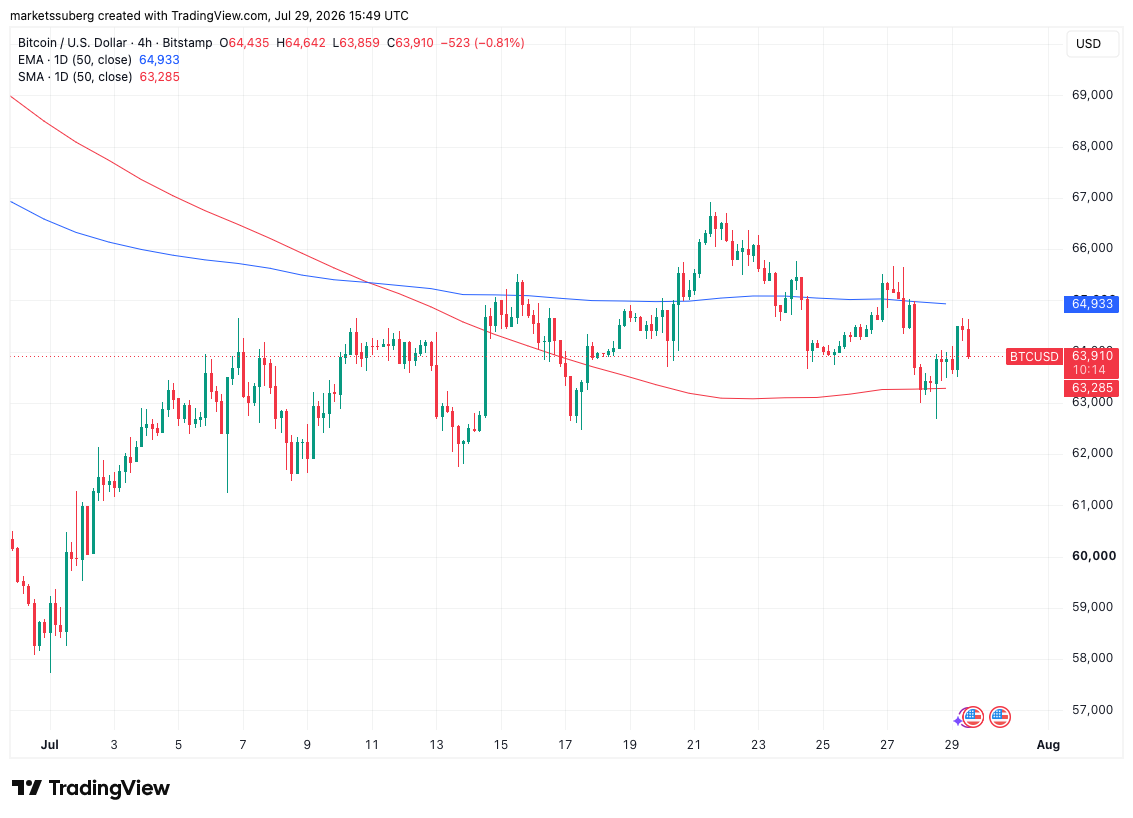
Biểu đồ bốn giờ của BTC/USD với EMA 21 ngày, 50 ngày. Nguồn: Cointelegraph/TradingView


Phạm vi này đã bắt đầu từ giữa tháng Bảy, với các đợt phá vỡ thất bại tận dụng các vùng thanh khoản ở cả hai phía.

Dữ liệu mới nhất từ CoinGlass cho thấy khả năng thanh lý đang hình thành ở cả hai phía của phạm vi hiện tại, với các cụm tại 63.500 USD và 64.900 USD.
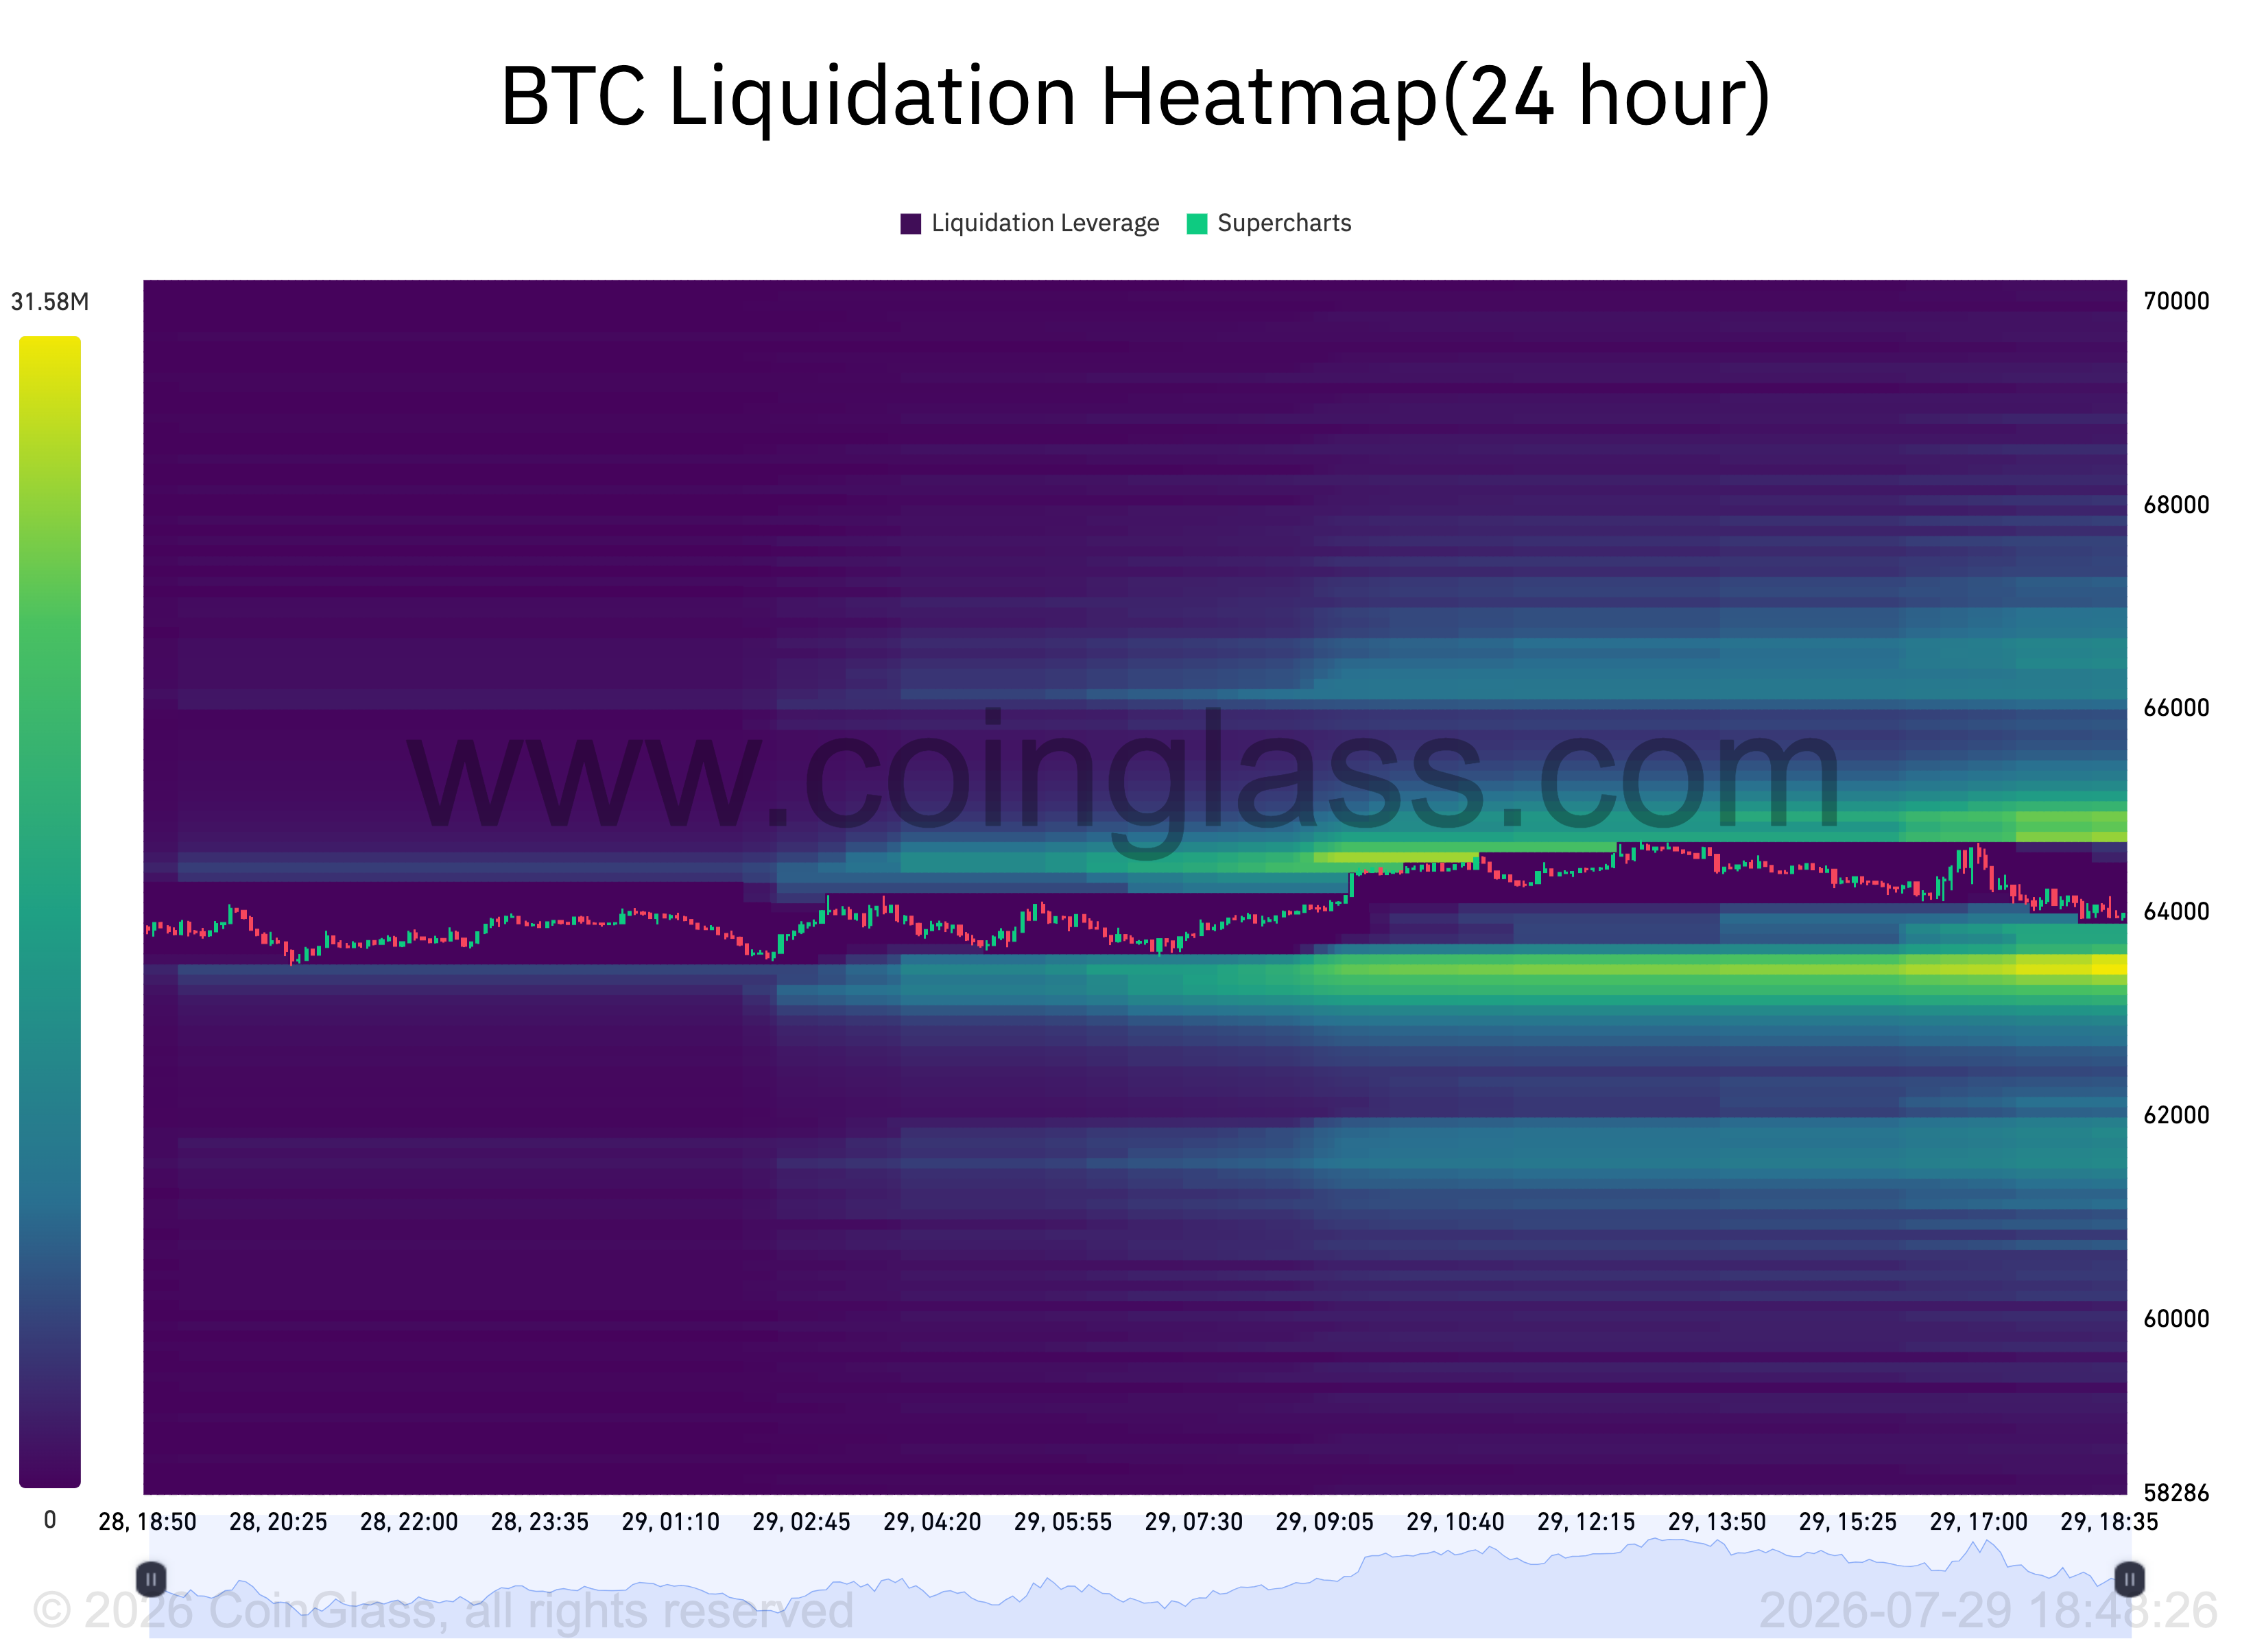
Bản đồ nhiệt thanh lý BTC. Nguồn: CoinGlass


Tuy nhiên, khối lượng giao dịch vẫn ở mức thấp đáng chú ý, với khối lượng thị trường giao ngay ở mức thấp nhất kể từ tháng 7/2023.

"Vị thế mở tại CME vẫn gần mức thấp nhất trong nhiều năm, vị thế mở hợp đồng tương lai vĩnh viễn đã chững lại quanh 300.000 BTC, và khối lượng giao ngay trung bình hàng ngày trong tháng chỉ đạt 2,2 tỷ USD," công ty phân tích tiền mã hóa K33 Research bổ sung trong một bản tin hôm thứ Ba.

Sự quan tâm của nhà đầu tư bán lẻ đối với cả Bitcoin và thị trường tiền mã hóa rộng lớn hơn đã suy giảm kể từ mức cao kỷ lục mọi thời đại của thị trường sau này vào tháng 10/2025. Cổ phiếu AI đã trở thành điểm đến chính cho sự chuyển hướng đầu tư này.



Criptos en tendencia

Preguntas relacionadas

QBài báo nêu những yếu tố chính nào đang tạo áp lực lên giá Bitcoin và thị trường chứng khoán Mỹ?

ABài báo nêu ba yếu tố chính: 1) Căng thẳng địa chính trị và leo thang trong chiến tranh Mỹ-Iran, đẩy giá dầu tăng cao, có thể ảnh hưởng đến lạm phát (CPI) và kỳ vọng lãi suất. 2) Thị trường cổ phiếu châu Á, đặc biệt là cổ phiếu chip bán dẫn, bán tháo mạnh, ảnh hưởng lan sang thị trường Mỹ. 3) Cuộc họp sắp tới của Ủy ban Thị trường Mở Liên bang Mỹ (FOMC) về quyết định lãi suất, với dự báo thị trường chia rẽ cao, là một chất xúc tác tiềm năng cho biến động.

QTại sao cuộc họp FOMC sắp tới lại được mô tả là 'gây chia rẽ nhất'?

ACuộc họp được mô tả là 'gây chia rẽ nhất' vì kỳ vọng của thị trường rất phân hóa. Theo dữ liệu từ CME FedWatch Tool, có 66.3% khả năng Fed giữ nguyên lãi suất ở mức 3.5%-3.75%, trong khi 33.7% kỳ vọng một đợt tăng 0.25%. Sự phân chia ý kiến mạnh mẽ này cho thấy sự bất ổn và khó dự đoán về quyết định chính sách tiền tệ sắp tới.

QXung đột Mỹ-Iran đã ảnh hưởng đến thị trường hàng hóa như thế nào theo bài báo?

AXung đột Mỹ-Iran leo thang, với những lời đe dọa từ Tổng thống Mỹ Donald Trump, đã khiến giá dầu tăng vọt. Cụ thể, giá dầu thô WTI của Mỹ tăng 7.6% và dầu Brent tăng 5.4%. Việc giá dầu tăng cao có tác động trực tiếp và đáng kể đến chỉ số giá tiêu dùng (CPI), từ đó làm dấy lên lo ngại về lạm phát và có thể thay đổi kỳ vọng về lộ trình lãi suất của Cục Dự trữ Liên bang Mỹ (Fed).

QGiá Bitcoin hiện đang di chuyển trong phạm vi kỹ thuật nào và chỉ báo nào được đề cập để xác định phạm vi đó?

AGiá Bitcoin hiện đang dao động trong một phạm vi (range) bị giới hạn bởi đường trung bình động đơn giản 50 ngày (50-day SMA) và đường trung bình động hàm mũ 50 ngày (50-day EMA) trên biểu đồ ngày. Phạm vi này đã hình thành từ giữa tháng 7, với các đợt phá vỡ thất bại tận dụng các vùng thanh khoản ở hai bên.

QBài báo cung cấp những dấu hiệu nào cho thấy sự quan tâm của nhà đầu tư vào thị trường tiền điện tử đang suy giảm?

ABài báo cung cấp một số dấu hiệu: 1) Khối lượng giao dịch trên thị trường giao ngay (spot) ở mức thấp nhất kể từ tháng 7/2023. 2) Mức mở hợp đồng (open interest) trên sàn CME gần mức thấp nhiều năm. 3) Mức mở hợp đồng futures vĩnh viễn (perpetual futures) đình trệ quanh mốc 300,000 BTC. 4) Khối lượng giao dịch giao ngay trung bình hàng ngày trong tháng chỉ đạt 2.2 tỷ USD. Ngoài ra, bài báo cũng chỉ ra rằng sự quan tâm của nhà đầu tư bán lẻ đã giảm kể từ khi thị trường đạt đỉnh lịch sử vào tháng 10/2025, và dòng tiền đang chuyển hướng sang cổ phiếu AI.

Lecturas Relacionadas

PA Graphics Explanation | One Chart to Understand the Major Web3 Events in August 2026

**PANews Crypto Calendar: Key Web3 Events in August 2026** PANews introduces its revamped crypto calendar, featuring comprehensive coverage, flexible filtering, and easy export options. The market in August will be shaped by multiple key events across macroeconomics, regulation, tokenomics, and project developments: * **Macro & Policy:** Key US economic data releases (July Non-Farm Payrolls, CPI), the Federal Reserve meeting minutes, and the Jackson Hole Economic Symposium will be in focus. On the regulatory front, the US Senate plans to release a new draft of the *CLARITY Act*, while the EU's expanded crypto ban against Belarus comes into effect. * **Token Unlocks:** Significant token unlocks are scheduled for assets including ENA, AVAX, CONX, ZRO, and KAITO, which may influence market volatility. * **Project Updates & Shutdowns:** Several services, including Exchange Art, Ctrl Wallet, Zapper, NFTfi, and Summer.fi, are set to cease operations or undergo major adjustments. Users are advised to manage their assets accordingly. * **Corporate Activity:** Q2 earnings reports from companies like SpaceX, Circle, and Nvidia are due. Unitree Robotics will initiate its IPO subscription on the STAR Market, and Moonshot AI plans to begin a Pre-IPO financing round. * **Industry Events:** Major conferences such as Bitcoin Asia 2026 and the 2026 Digital Expo will take place. The overarching market narrative for August will revolve around macroeconomic expectations, regulatory developments, token unlock schedules, and ongoing industry consolidation.

marsbitHace 7 min(s)

PA Graphics Explanation | One Chart to Understand the Major Web3 Events in August 2026

marsbitHace 7 min(s)

Wall Street's Most Famous 'Cassandra' Now Has His Sights Set on Nvidia

Michael Burry, the famed "Big Short" investor, has once again captured Wall Street's attention with a series of short positions against major tech and semiconductor stocks, most notably Nvidia. In late June and July, through his "Cassandra Unchained" newsletter, Burry disclosed short bets against Nvidia, Tesla, Applied Materials, Caterpillar, the SOXX semiconductor ETF, and later, Micron Technology. His core thesis revolves around potential distortions in the AI infrastructure boom, specifically questioning whether extended depreciation schedules (e.g., 6 years vs. a realistic 2-3 years for AI chips) by cloud giants like Microsoft and Google artificially inflate profits. He also raises concerns about possible "off-balance-sheet circular financing," where chip demand might be propped up by vendor-backed funding to clients. Nvidia's stock experienced volatility following these disclosures, briefly dipping but largely holding near Burry's reported entry points, leaving his positions roughly flat or slightly underwater as of late July. This move is part of a pattern for Burry, whose track record since his legendary 2008 bet is mixed. He has faced notable losses, such as on Tesla in 2021, while scoring on broader market turns like the 2020 pandemic crash. His methodology focuses intensely on free cash flow and scrutinizing original financial documents to spot overvaluation and structural risks, but it often struggles with timing the market. The article contrasts Burry's stance with other prominent investors. Steve Eisman, another "Big Short" figure, is not shorting Nvidia, citing strong fundamentals but expressing nervousness about sustainability. Jim Chanos agrees with the broad "accounting mismatch" concern—comparing it to the dot-com bubble—but targets financial leverage in private equity firms rather than the chip stocks themselves. While Nvidia's short interest remains relatively low at 1.3-1.4% of float, the massive stock size means absolute short losses have been significant, exceeding $5 billion earlier this year. The piece concludes that for ordinary investors, the key takeaway is not replicating specific short bets but learning from the critical frameworks these investors use: questioning rosy accounting, identifying structural vulnerabilities, and maintaining skepticism during market euphoria, even if pinpointing the exact catalyst for a downturn remains elusive.

marsbitHace 31 min(s)

Wall Street's Most Famous 'Cassandra' Now Has His Sights Set on Nvidia

marsbitHace 31 min(s)

Weekly Selection丨Epic Stock Market Volatility, Changxin Tech's IPO Reshapes Storage Landscape, Saylor Aims to Re-Anchor STRC Around September 8th

PANews Weekly Digest: Market Turmoil, Tech Breakthroughs, and Crypto Developments. The week saw significant volatility across global markets. South Korea's KOSPI index experienced extreme turbulence, including multiple trading halts, largely driven by sharp declines in AI hardware stocks like SK Hynix. In contrast, China's Changxin Xinqiao (CXC) achieved a landmark IPO with a market cap surpassing 4 trillion yuan, marking a major success for the domestic DRAM industry after a decade of losses. In the crypto and Web3 space, several key narratives emerged. AI is driving demand for new infrastructure, with projects like AI agent wallets and programmable payments gaining traction, attracting interest from firms like Coinbase. The Bitcoin mining sector is pivoting, with companies like MARA focusing on energy management as electricity becomes a core AI-era asset. Meanwhile, the RWA (Real World Assets) sector faces a "utilization puzzle," with hundreds of billions in on-chain assets remaining dormant. Notable market movements included a historic single-day surge of over 17% for the KOSPI index and a significant migration of $16.5 billion in staked ETH within the Lido ecosystem. Michael Saylor announced a target to re-peg the STRC stablecoin around September 8th. Other highlights include discussions on Ethereum's ambitious 2030 roadmap for scaling and privacy, analysis showing high protocol revenues not always translating to token price gains, and warnings from Citi about potential extreme commodity price shocks by late 2026.

marsbitHace 37 min(s)

Weekly Selection丨Epic Stock Market Volatility, Changxin Tech's IPO Reshapes Storage Landscape, Saylor Aims to Re-Anchor STRC Around September 8th

marsbitHace 37 min(s)

When the Market Begins to Question AI Capex: A Full Analysis of Q2 Earnings Reports from Five Tech Giants

In late July 2026, five major US tech giants—Alphabet, Intel, Microsoft, Meta, and Apple—released their Q2 earnings reports. While all companies exceeded revenue and profit expectations, driven by strong AI-related business growth, investor reactions diverged sharply due to concerns over escalating AI capital expenditures (capex) and their impact on free cash flow. Alphabet reported strong revenue growth and a surging cloud business, but its stock fell after announcing a doubled year-on-year capex and negative quarterly free cash flow for the first time. Intel posted its strongest revenue growth in over 15 years, but its stock experienced volatile trading after significantly raising its full-year capex guidance. Microsoft saw its stock surge after beating estimates and, crucially, lowering its capex forecast while projecting positive free cash flow. Meta faced the most severe sell-off as its profits declined despite revenue beats, with free cash flow plunging over 90% and its capex guidance raised. Apple reported record June-quarter results, but its stock plummeted after providing Q4 revenue guidance that fell short of expectations, citing supply chain constraints and forex headwinds. The overall takeaway is that the market's focus has shifted from validating AI demand to scrutinizing the timeline for returns on massive AI investments. Companies demonstrating a clearer path to managing capex and preserving free cash flow, like Microsoft, were rewarded, while those signaling continued aggressive spending faced investor skepticism.

Odaily星球日报Hace 46 min(s)

When the Market Begins to Question AI Capex: A Full Analysis of Q2 Earnings Reports from Five Tech Giants

Odaily星球日报Hace 46 min(s)

a16z: From Companies to DAOs, DUNA May Become the Next Generation Organizational Form

This article, "From Companies to DAOs: How DUNA Could Become the Next Organizational Form," traces the 500-year evolution of business collaboration. It begins with medieval structures like the *commenda* and Florentine *compagnia*, which exposed partners to personal risk. The modern corporation, exemplified by the Dutch East India Company (VOC), was a revolutionary leap, enabling large-scale, capital-intensive ventures by offering limited liability and reducing coordination costs. However, corporations introduced new challenges like principal-agent problems and bureaucratic overhead. The piece argues that software and internet-native protocols are now reducing these traditional overheads. Decentralized Autonomous Organizations (DAOs) emerged as a new model for coordination without centralized management. Yet, DAOs face a significant legal vacuum: they lack legal recognition, leaving members exposed to unlimited personal liability, and their tokens are vulnerable to being classified as securities under unclear regulations (e.g., the Howey Test). This has forced projects into suboptimal workarounds like offshore foundations. The article identifies the Decentralized Unincorporated Nonprofit Association (DUNA) as a potential solution. Recently legalized in states like Wyoming, the DUNA provides a legal wrapper for decentralized networks. It grants key protections—legal personality, limited liability, and perpetual existence—to a group without imposing a traditional hierarchical management structure. This allows token-holder communities to govern, hold assets, and contract as a single legal entity, aligning with their decentralized nature. While DUNA doesn't solve all governance challenges or magically resolve securities law questions, it represents a crucial step. It fills the legal recognition gap, offering a native legal form for internet-scale, decentralized collaboration and extending the separation of personal risk from organizational venture into a new domain.

marsbitHace 1 hora(s)

a16z: From Companies to DAOs, DUNA May Become the Next Generation Organizational Form

marsbitHace 1 hora(s)

Trading

Spot

Artículos destacados

Cómo comprar WAR

¡Bienvenido a HTX.com! Hemos hecho que comprar WAR (WAR) sea simple y conveniente. Sigue nuestra guía paso a paso para iniciar tu viaje de criptos.Paso 1: crea tu cuenta HTXUtiliza tu correo electrónico o número de teléfono para registrarte y obtener una cuenta gratuita en HTX. Experimenta un proceso de registro sin complicaciones y desbloquea todas las funciones.Obtener mi cuentaPaso 2: ve a Comprar cripto y elige tu método de pagoTarjeta de crédito/débito: usa tu Visa o Mastercard para comprar WAR (WAR) al instante.Saldo: utiliza fondos del saldo de tu cuenta HTX para tradear sin problemas.Terceros: hemos agregado métodos de pago populares como Google Pay y Apple Pay para mejorar la comodidad.P2P: tradear directamente con otros usuarios en HTX.Over-the-Counter (OTC): ofrecemos servicios personalizados y tipos de cambio competitivos para los traders.Paso 3: guarda tu WAR (WAR)Después de comprar tu WAR (WAR), guárdalo en tu cuenta HTX. Alternativamente, puedes enviarlo a otro lugar mediante transferencia blockchain o utilizarlo para tradear otras criptomonedas.Paso 4: tradear WAR (WAR)Tradear fácilmente con WAR (WAR) en HTX's mercado spot. Simplemente accede a tu cuenta, selecciona tu par de trading, ejecuta tus trades y monitorea en tiempo real. Ofrecemos una experiencia fácil de usar tanto para principiantes como para traders experimentados.

229 Vistas totalesPublicado en 2024.12.11Actualizado en 2026.06.02

Cómo comprar WAR

Discusiones

Bienvenido a la comunidad de HTX. Aquí puedes mantenerte informado sobre los últimos desarrollos de la plataforma y acceder a análisis profesionales del mercado. A continuación se presentan las opiniones de los usuarios sobre el precio de WAR (WAR).

活动图片