Misjudged A-Shares: Resilience, Expectations, and Confidence

marsbitPublicado a 2026-07-22Actualizado a 2026-07-22

Resumen

China's A-share market recently faced selling pressure, especially in tech sectors, initially triggered by a global tech sell-off that began in South Korea. However, the article argues this is a case of "mistaken injury" and highlights the market's underlying resilience. This resilience stems from three main pillars: **1) Tech Sector Fundamentals:** Unlike Korea's market dominated by a few memory chip stocks, China's tech sector is diversified across computing, communications, electronics, and semiconductors, supported by dual narratives of global AI supply chains and domestic substitution. Core areas like optical modules and fiber optics continue to show strong earnings growth. **2) "National Team" Support:** State-backed institutions and large corporations have made significant market purchases and announced buybacks, providing liquidity and signaling confidence. This is seen as a stabilizing policy signal, often associated with market bottoms. **3) Broader Market Pillars:** Other major sectors are showing endogenous recovery momentum. Consumer stocks benefit from stabilizing CPI and signs of sector recovery (e.g., liquor price hikes). Cyclical sectors like aluminum have high earnings, potential price increases due to tight supply, and low valuations. The financial sector offers stable dividends and low valuations. The conclusion is that the sell-off was driven by external contagion, not a collapse in fundamentals. With strong policy support and recovering momentum across k...

By Market Cap Observation

Entering July, global tech stocks suddenly weakened. Korea's leading memory chip manufacturers faced concentrated selling first, which quickly spread to markets like the US and Japan. Subsequently, A-share tech sectors came under pressure, with the STAR 50 and ChiNext indices declining successively.

However, under external shocks, A-shares have not lost their support. The underlying logic of prosperity for the tech industry has not reversed, and long-term funds and market stabilizing forces have begun to step in. Meanwhile, consumption, cyclical, and financial sectors are also accumulating momentum for repair.

This round of adjustment is both a release of risk and a test of the true resilience of A-shares.

01 Tech Adjustment and Resilience

From April to the end of June this year, A-share tech sectors experienced a remarkable rally. This rise was anchored by two major logics. The first was reflecting high earnings growth. In the first half of the year, net profit growth for core tech tracks like optical modules, chip manufacturing, packaging & testing, and optical fiber & cable mostly exceeded 50%.

National Bureau of Statistics data corroborates this in the first five months, profits in the computer, communication, and other electronic equipment manufacturing industry increased by 103.9% year-on-year, contributing 43% to the growth of industrial profits.

The second was the spillover effect from the surge in overseas tech stocks. Particularly, the rise and fall rhythms of A-share tech and Korean tech stocks were highly synchronized.

But the tone changed abruptly since July, with A-share tech stocks adjusting continuously. The core reason was not a deterioration in their own fundamentals, but rather the transmission of external risks such as deleveraging in the Korean stock market.

However, the market resilience of A-share tech and Korean tech is not on the same level. A-shares do not have the foundation for a systemic decline. The most core difference lies in their vastly different tech sector structures.

Samsung Electronics and SK Hynix account for about 50% of the total market capitalization of the KOSPI index. Moreover, about 60% of the total market's leveraged funds are betting on these two stocks. Thus, the entire Korean stock market is deeply tied to the memory chip super cycle narrative. Any withdrawal of leveraged funds or any flaw in earnings growth expectations could trigger violent selling.

In contrast, A-share tech encompasses numerous sectors like computers, communications, electronics, etc. Even narrowed down to the semiconductor sector, the industrial chain covers multiple segments like materials, equipment, design, manufacturing, and packaging & testing.

More importantly, A-share tech follows a dual narrative logic. One anchors to the global tech giants' supply chain — "Yizhongtian" is bound to chain leaders like NVIDIA, trading on the massive global AI capital expenditure. The other anchors to domestic substitution, where leading companies like Hygon Information, SMIC, and Cambricon target domestic computing infrastructure.

One internal, one external — this provides greater risk resistance than Korea's single narrative centered on the memory super cycle.

At the same time, the fundamental earnings logic for core areas of the tech sector has not been disproven.

For example, in the optical module sector, Suzhou Everbright's H1 net profit attributable to shareholders reached 7-8 billion yuan, nearly doubling again on a high base of 235% growth in the same period last year. In the optical fiber & cable sector, Yangtze Optical Fibre and Cable's net profit attributable to shareholders reached 2.4-3 billion yuan, up 711% to 914% year-on-year.

Thus, this round of A-share tech decline is directly related to the transmission of external risks, and the risk has been released to a considerable extent. Notably, Citi issued a report on July 20 downgrading Korean equities and upgrading Chinese equities, also indicating significant differences in the resilience of the two markets.

In fact, after continuous adjustments, A-share tech stocks staged a recovery on July 21 — the STAR 50 surged 10.7%, and the ChiNext Index jumped 7%.

02 The "National Team" Sets the Tone

Facing market volatility, the "National Team" (state-backed institutions) decisively stepped in again to support the market.

Specifically, China Reform Holdings announced that its subsidiary, Guoxin Investment, has invested over 50 billion yuan into the market. China Chengtong and its platforms have cumulatively purchased nearly 10 billion yuan and stated they will continue to use their own funds, stock buybacks, and special relending facilities to increase holdings of state-owned central enterprise and tech company stocks and ETFs.

At the listed company level, central SOEs like Aluminum Corporation of China and CRRC announced buybacks. A new wave of buyback tides also started among securities firms like Huaan Securities and Guolian Minsheng.

On the institutional level, quantitative private equity firms with tens of billions under management like Lingjun Investment and Square Sum announced self-purchases. Insurers like Ping An, China Pacific Insurance, PICC, New China Life Insurance, and China Life successively voiced support for the capital market, stating they will continue to increase their equity allocation ratio.

Among them, China Life Asset Management recently made active allocations, with net purchases of A-share and on/off-exchange fund market equity assets exceeding 10 billion yuan in a single day.

The "National Team" taking the lead, followed by other market participants, can easily form a powerful upward force. Especially, the heavyweight move by the "National Team" holds very positive significance for the market, mainly reflected in three aspects.

First, genuine capital injections through share purchases help alleviate part of the market's liquidity pressure through concrete actions.

Second, guiding market expectations is more crucial. The "National Team" holds strong influence in A-shares. Acting counter-cyclically at this time sends a signal of a potential bottoming phase, providing a strong example for a market dominated by institutions.

Currently, major funds like active equity public funds, passive ETFs, insurance capital, northbound, and QFII hold over 3 trillion yuan each, with a combined scale exceeding 15 trillion yuan, accounting for about 40% of free-float market capitalization. Compared to the 2015 market and earlier periods dominated by retail investors, these institutional investors pay more attention to market pricing factors like macro policies, fundamentals, and monetary liquidity.

Generally speaking, "National Team" intervention is seen as counter-cyclical adjustment for the stock market, often having a quasi-stabilization fund effect. The movements of these large funds tend to have a stronger exemplary effect on institutional investors (with less emotionalism), making it easier to drive long-term funds like social security, insurance capital, and SOE buybacks to resonate.

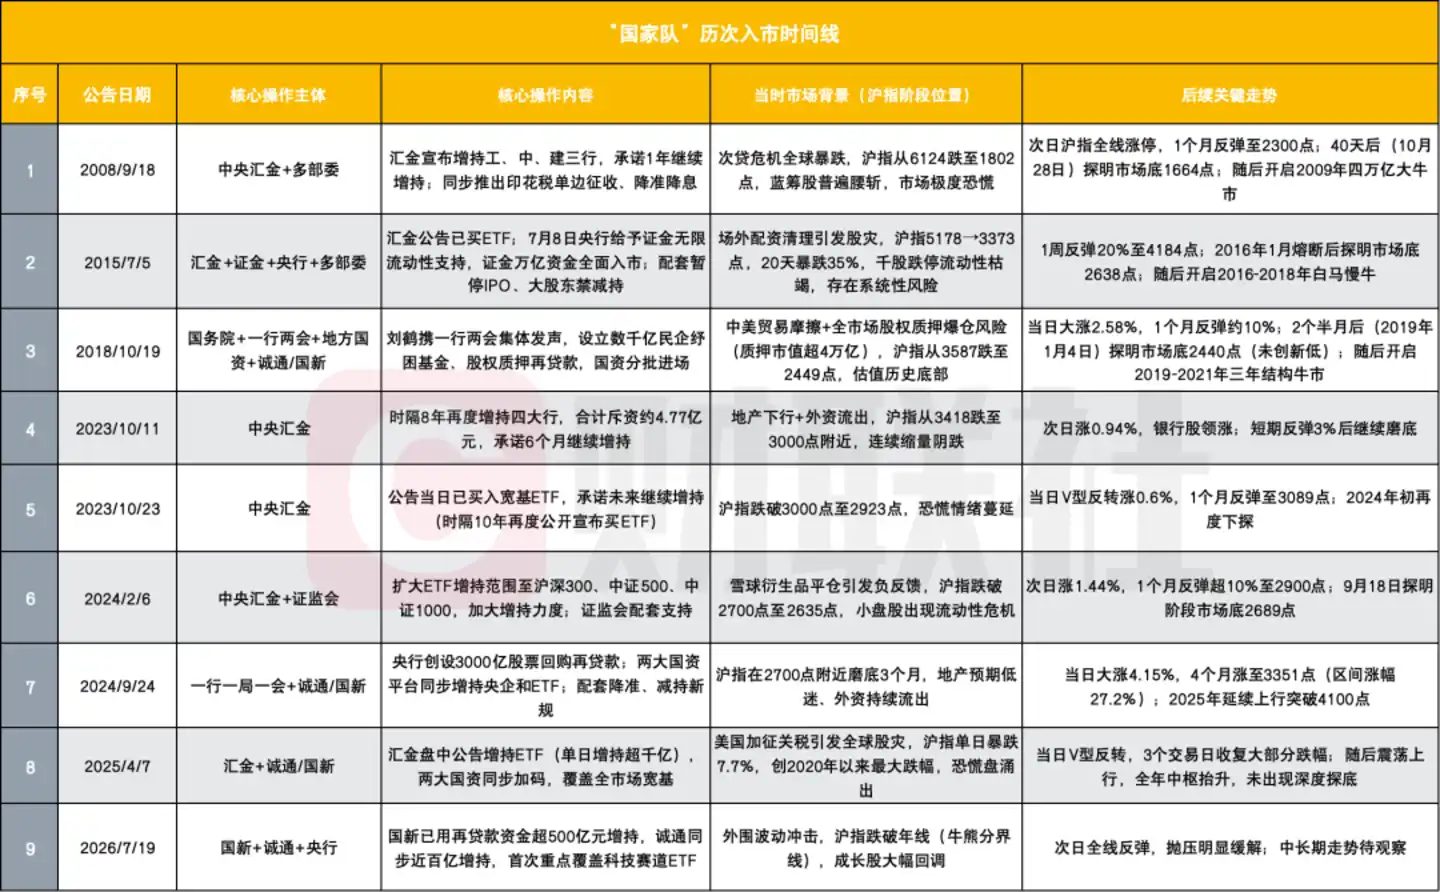
Third, historical experience shows that the market is often at a stage bottom after the "National Team" enters.

Since 2008, in multiple counter-cyclical interventions by the "National Team", although short-term trends varied, looking at longer cycles, the win rate of following the National Team's rhythm hasn't been poor. Particularly after the interventions on September 24, 2024, and April 7, 2025, the market stabilized quickly and embarked on sustained trending rallies.
Source: Cailian Press

Notably, another innovative tool has been added to the policy toolkit for stabilizing the capital market — the Special Relending Facility for Stock Buybacks and Shareholding Increases (established in September 2024, first phase 300 billion yuan), integrating capital market stability into the macro-policy regulatory framework.

This facility, combined with the 500 billion yuan swap line quota, brings the total available pool to 800 billion yuan. Currently, the actual utilization rate is not high; collectively, hundreds of billions of yuan in backup funds remain available.

Therefore, this intervention is not simple market-propping, but a clear signal of policy intent.

03 Three Lines Supporting the Market: Where Does the Confidence Come From?

Beyond the capital logic, A-shares have sufficient resilience, and intrinsic upward momentum is not lacking.

Strategically categorized, A-shares can be divided into four core types: finance, consumption, cyclical, and tech. Their combined force determines the market's direction. Not just tech, but consumption, cyclical, and financial lines all possess strong intrinsic recovery momentum.

First, consumption. From a macro perspective, the CPI has stabilized above 1% for five consecutive months, whereas it fluctuated between -0.8% and 0.8% for nearly three years prior. Continuous price increases for consumer goods indicate marginal improvement in the profit predicament of consumer stocks. For consumer stocks that have fallen for five years, with valuations at absolute lows over the past decade, this could be a beam of light illuminating the darkness.
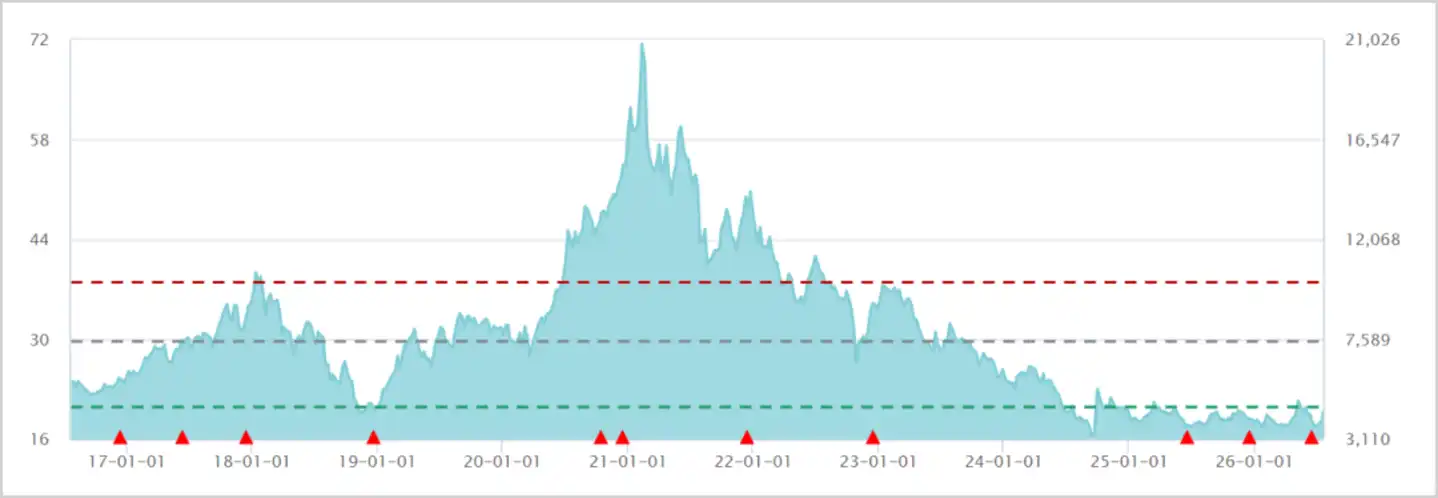
CSI Liquor Index PE Chart, Source: Wind

From a corporate perspective, Kweichow Moutai, as a bellwether for the baijiu and even the entire food & beverage sector, has raised prices twice consecutively this year, with a cumulative increase exceeding 10%. This action indicates that after years of continuous inventory destocking, channel inventories have largely normalized. The deep adjustment in baijiu may be nearing its end, with signs of recovery emerging.

In the first half of this year, retail sales of tobacco and alcohol performed strongly, reaching a cumulative 354.7 billion yuan, up 13.2% year-on-year. This also supports the view that the most difficult period for baijiu consumption may be over.

Next, look at cyclical sectors led by aluminum, which may be facing a triple resonance.

First, high earnings momentum. In the first five months, non-ferrous metal profits grew 117% year-on-year, even faster than tech sectors like computing. Looking at specific companies, Yunnan Aluminium and Tianshan Aluminium saw net profit attributable to shareholders grow 171%–182% and 101.5% year-on-year, respectively.

Second, there may still be price increase expectations in the second half of the year. On one hand, the global aluminum market remains in tight balance — demand continues to grow at 3%-5% overall driven by new energy vehicles, power, and "aluminum for copper" substitution in home appliances. On the supply side, China firmly maintains the 45-million-ton capacity ceiling. Against this backdrop, global aluminum inventories continue to decline, with LME aluminum stocks hitting multi-year lows.
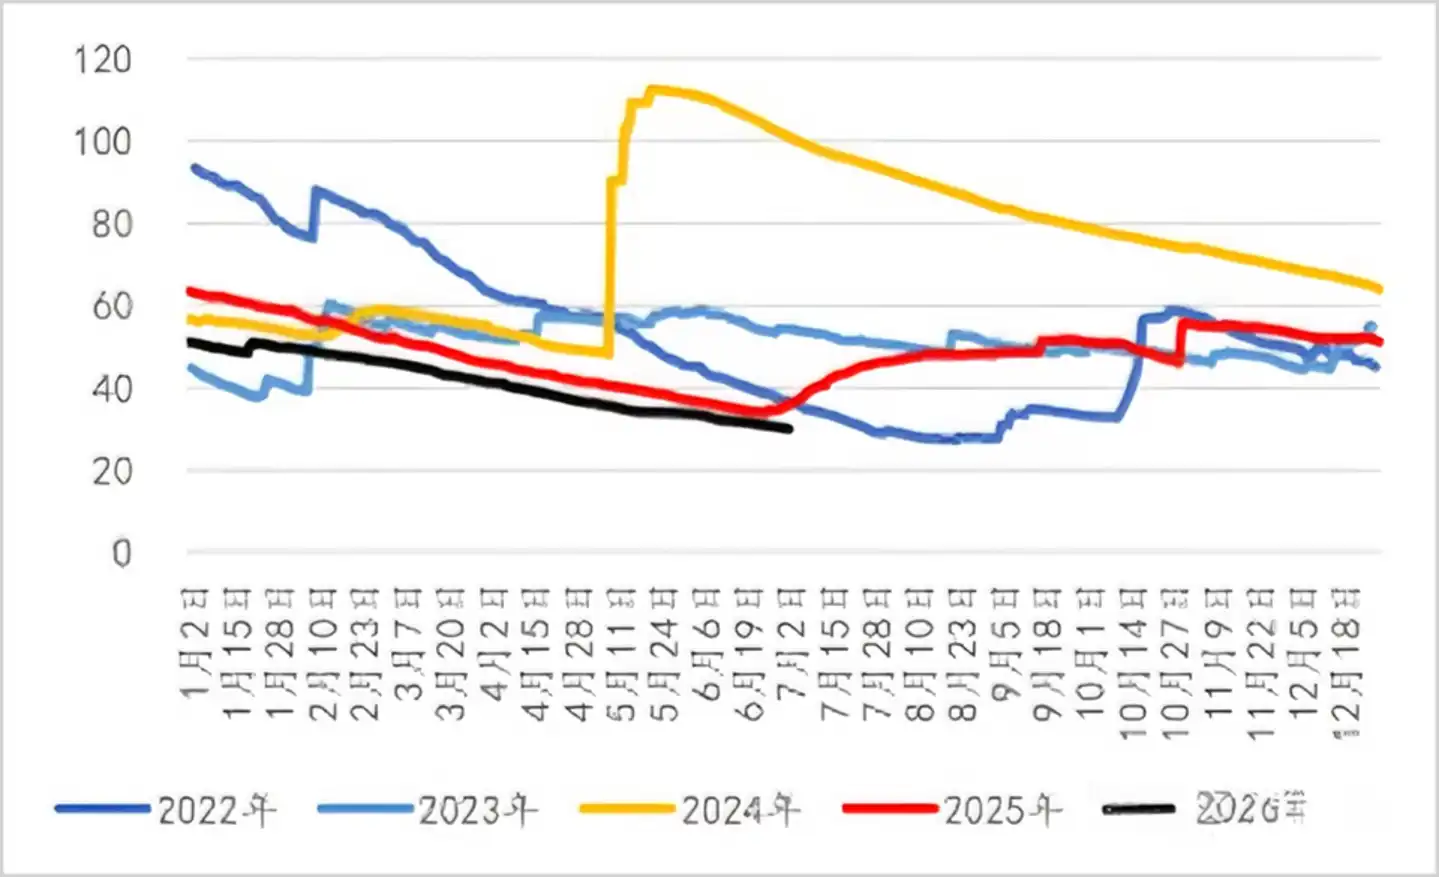
LME Total Aluminum Inventory Chart, Source: Wind

On the other hand, there is significant uncertainty regarding the previously aggressive expectations for Fed rate hikes. For example, June's non-farm payroll and CPI data both came in below expectations, suggesting the pace of hikes may be delayed.

Third, since the end of January, aluminum companies have generally experienced maximum drawdowns of around 40% or more. Currently, the forward PE (2026E) for leading companies like Aluminum Corporation of China, Yunnan Aluminium, and Tianshan Aluminium is only 6-7 times. High earnings momentum, coupled with price increase expectations and low valuations, naturally provides recovery momentum for the future.

In fact, besides aluminum, metals like gold, silver, copper, and lithium share similar underlying logics.

Finally, look at the financial sector. Banks, as typical dividend assets, have stable fundamentals and relatively high dividend yields. Meanwhile, securities firms and insurers, benefiting from capital market activity, generally see high earnings growth, yet their valuations remain at multi-year lows.

Certainly, the rapid development of China's tech industry, especially continuous technological breakthroughs in the semiconductor, AI, and other industrial chains, achieving domestic substitution across multiple fields and expanding exports to capture overseas market share, leads to continuously improving earnings fundamentals and solid long-term value. Coupled with the intrinsic recovery momentum of the three major lines — consumption, cyclical, and financial assets, A-shares possess a fairly strong foundation for resilience.

Overall, this round of tech adjustment stems from external risk transmission, not a collapse in the growth cycle. The "National Team" decisively intervened to stabilize the bottom line of expectations. As the intrinsic momentum of consumption, cyclical, and financial sectors gradually takes over, the market may not be far from regaining stability.


Criptos en tendencia

Preguntas relacionadas

QWhat are the two main reasons that support the resilience of A-shares in the face of external shocks, as discussed in the article?

AThe article highlights two key reasons for A-share resilience: 1) Strong fundamentals in key sectors like technology, where industries such as optical modules and chips maintain high profitability and growth (e.g., profit in the computer and electronic equipment manufacturing sector grew over 100% year-on-year in the first five months). 2) The 'national team' (state-backed institutions) actively intervened to stabilize the market by making substantial purchases (e.g., over 500 billion RMB by Guoxin Investment) and providing policy support, which boosted market confidence and liquidity.

QHow does the structure of China's technology sector differ from South Korea's, making it potentially more resilient according to the article?

AThe article explains that South Korea's stock market is heavily concentrated in a few memory chip giants (Samsung and SK Hynix account for about 50% of the market cap), making it vulnerable to sector-specific risks and leverage unwinding. In contrast, China's A-share technology sector is more diversified, spanning computers, communications, electronics, and within semiconductors, covering the entire supply chain from materials to design and manufacturing. It also has dual growth narratives—participating in the global AI supply chain and driving domestic substitution—making it less dependent on a single segment and more resilient to external shocks.

QWhat specific actions did the 'national team' take to support the A-share market during the recent volatility?

AThe 'national team' took several concrete actions: 1) State-owned institutions like Guoxin Investment announced market purchases exceeding 500 billion RMB, and China Chengtong bought nearly 100 billion RMB. 2) Central state-owned enterprises (e.g., China Aluminum, CRRC) announced share buybacks. 3) Major insurers (Ping An, CPIC, etc.) pledged to increase equity allocations, with China Life Asset Management alone making net purchases of over 100 billion RMB in a single day. 4) The policy tool of 'stock repurchase and增持 special relending' (with a total potential scale of 800 billion RMB) was also mentioned as a stabilizing measure.

QBeyond technology, what other major sectors in the A-share market does the article identify as having endogenous recovery momentum?

AThe article identifies three other major sectors with strong endogenous recovery momentum: 1) Consumer: Indicated by a stabilizing CPI (above 1% for five months) and leading companies like Kweichow Moutai raising prices, signaling easing inventory pressure and a potential end to the downturn. 2) Cyclicals (e.g., aluminum): Supported by high profit growth, potential price increases due to tight supply-demand balance, and low valuations after significant corrections. 3) Finance: Banks offer stable fundamentals and high dividends, while brokers and insurers benefit from capital market activity but trade at low valuations.

QWhat is the article's overall conclusion regarding the recent adjustment in A-shares, particularly the technology sector?

AThe article concludes that the recent adjustment in A-shares, especially in technology, was primarily caused by the spillover of external risks (like deleveraging in South Korean stocks) and not by a collapse in fundamental industry prosperity. It argues that with the 'national team' stepping in to stabilize expectations and provide a floor, and with the inherent recovery momentum in consumer, cyclical, and financial sectors, the market possesses strong resilience and is likely to return to a steady state in the near future.

Lecturas Relacionadas

After Three Consecutive Quarters of Decline, Can the Crypto Market Find a Window for Stabilization in Q3?

The cryptocurrency market has just concluded its worst-performing quarter since 2022, with total capitalization dropping 12.6% to $2.1 trillion. All core metrics indicate capital is leaving the sector, not just rotating within it. Bitcoin fell 14.2% and Ethereum dropped 25.4% in Q2, breaking their previous correlation with US tech stocks. A key driver is the reversal in US spot Bitcoin ETF flows, which saw a net outflow of approximately $4.67 billion in Q2, including a record monthly outflow near $4.5 billion in June. While recent data suggests long-term holders are accumulating again, sustained ETF outflows mean continued selling pressure. Market focus is now singularly on the Federal Reserve. The upcoming July FOMC meeting is seen as the most critical event for Q3. A dovish signal could support Bitcoin reclaiming a $68,000-$84,000 range, while a hawkish stance might establish a new trading band around $50,000-$56,000. Additionally, regulatory uncertainty persists, with the progress of the crucial *CLARITY Act* stalling in the Senate, reducing its perceived 2026 passage probability to 40-45%. Despite the broad downturn, a few sectors showed growth. Prediction markets saw nominal volume surge 48.7% year-over-year to $113.8 billion, and tokenized collectibles transaction volume rose 143% quarterly to $1.4 billion. The Real-World Asset (RWA) tokenization sector also continued steady growth, now representing ~$28.1 billion in on-chain value. The market's foundation for an extreme crash appears limited, with Bitcoin price hovering near its 200-week moving average. However, the trading paradigm has shifted from narrative-driven speculation to decisions based on price action, policy developments, and interest rate expectations, making a broad sentiment-driven rally unlikely in the near term.

marsbitHace 13 hora(s)

After Three Consecutive Quarters of Decline, Can the Crypto Market Find a Window for Stabilization in Q3?

marsbitHace 13 hora(s)

BIT Trading Moment: BTC Still Suppressed by Weekly 200 EMA, Rejection May Restart Decline; Storage and Semiconductors that Surged Last Night Begin Falling in Evening Trading

**Crypto & Stock Market Wrap: Bitcoin Tests Resistance, Stocks Retreat After AI Surge** Bitcoin consolidates around $66,000, facing key resistance near $68,000—an area seen as a major psychological and technical hurdle where previous rallies have failed. Analysts note the cryptocurrency is caught between its 200-week moving average (~$63,333) and 200-week EMA (~$68,328). A clear break above $68k is needed to signal a stronger bullish trend, while a rejection could lead to a retest of $63k support. Market sentiment remains cautious, with low futures open interest pointing to a low-liquidity rebound rather than a full bull market. Bitcoin spot ETFs saw another $203 million inflow. US stock futures pointed lower after a strong Tuesday session led by a massive rebound in semiconductors and memory stocks. The rally was fueled by renewed optimism about AI-driven hardware demand, with Micron, SanDisk, and SK Hynix surging. However, those gains reversed in pre-market trading. Super Micro Computer (SMCI) soared over 20% after hours on strong guidance and a record backlog. Other standouts included Rocket Lab and nuclear energy plays Oklo and X-Energy. Rising oil prices (Brent above $91) and climbing Treasury yields (10-year near 4.64%), however, are reigniting inflation concerns and acting as a headwind for equities. In Asia, markets were mixed. South Korea's KOSPI pared early gains to close slightly higher as semiconductor stocks like SK Hynix gave back initial surges. Japan's Nikkei edged lower as the yen hit a fresh 38-year low against the dollar, raising fears of potential market intervention. Key events to watch include the Samsung Galaxy launch, AMD's AI event, and a slew of major tech earnings from Alphabet, Tesla, and IBM after the close on Wednesday, followed by the ECB meeting and Intel's earnings on Thursday.

marsbitHace 13 hora(s)

BIT Trading Moment: BTC Still Suppressed by Weekly 200 EMA, Rejection May Restart Decline; Storage and Semiconductors that Surged Last Night Begin Falling in Evening Trading

marsbitHace 13 hora(s)

Former CFTC Chairman, Circle President Tarbert: Preaching Long-Termism While Cashing Out $30 Million Himself

Former CFTC Chairman and Circle President Heath Tarbert has consistently advocated for a long-term vision in public, urging patience from investors as Circle’s stock price has fallen significantly from its peak. However, it has been revealed that since Circle’s IPO, Tarbert has continuously sold his CRCL shares through pre-arranged trading plans, cashing out approximately $30 million, without making any public market purchases. This contrast between his public messaging and personal actions has drawn criticism. Tarbert joined Circle in July 2023 as Chief Legal Officer, leveraging his regulatory experience to help guide the company through its IPO and expansion. Despite promoting stablecoins as long-term infrastructure, he established a 10b5-1 trading plan just before Circle went public, leading to substantial stock sales over the following year. In March 2026, he initiated another plan to sell more shares. His career trajectory highlights a pattern of moving between high-level regulatory roles and influential positions in the financial sector. After resigning as CFTC Chairman in early 2021, he joined Citadel Securities as Chief Legal Officer just 27 days later, during a period of intense regulatory scrutiny for the firm. He later joined Circle, aiding its efforts to navigate regulatory challenges for its public listing. While Tarbert's expertise in policy and compliance is valuable to companies like Circle, his actions—advocating long-term confidence while personally divesting—raise questions about the alignment between his public statements and his private financial decisions, leaving investors who followed his advice to bear the market risks.

marsbitHace 14 hora(s)

Former CFTC Chairman, Circle President Tarbert: Preaching Long-Termism While Cashing Out $30 Million Himself

marsbitHace 14 hora(s)

Gate Research Institute: The 'Wall Street-ization' Wave of Crypto Financial Products – Competition or Integration?

The article titled "Gate Research Institute: Are Crypto Financial Products Sparking a 'Wall Street' Wave—Competition or Convergence?" explores the evolving relationship between the crypto ecosystem and traditional finance (TradFi). The piece begins by reflecting on Bitcoin's original 2009 vision of decentralization, disintermediation, and moving away from banks. It then contrasts this with the 2024 landscape, where key crypto assets like Bitcoin are increasingly held through Wall Street products like ETFs issued by giants like BlackRock. The article questions whether this signifies that TradFi is systematically taking over the rights to issue, price, custody, and distribute crypto financial assets. The core argument is that this is not a zero-sum takeover but rather a bidirectional convergence where each side addresses the other's weaknesses. Crypto offers 24/7 global markets, programmable settlement, and open access but lacks compliant channels, institutional-grade custody, deep fiat liquidity, and mainstream distribution. TradFi possesses these but is constrained by legacy systems, limited operating hours, and slow settlement. Two primary convergence paths are highlighted: * **Path A (CEX to TradFi):** Exemplified by Gate, which has progressed from offering tokenized stocks and CFDs to providing direct, real stock trading (US, Hong Kong, South Korea) within its platform, using USDT. * **Path B (TradFi to Crypto):** Exemplified by Robinhood, which has integrated crypto trading, acquired exchanges like Bitstamp, and is moving traditional assets like stocks onto the blockchain via tokenization and its own Layer 2. Both paths are ultimately competing to become the next-generation, unified financial account—a "super account" where users can seamlessly trade cryptocurrencies, stocks, ETFs, RWA (Real World Assets), and tokenized treasury products in one interface. The growth of RWA and tokenized treasuries (e.g., BlackRock's BUIDL) is presented as the asset-layer fusion, providing stable, yield-bearing assets on-chain and acting as a bridge between the two worlds. In conclusion, the "Wall Street-ization" of crypto is framed as a mutual transformation. Decentralized ideals persist in the protocol layer, while at the application layer, a more efficient, global, and accessible unified capital market is emerging from this convergence. The future competition lies not between crypto exchanges and stockbrokers, but between platforms vying to offer the most comprehensive asset coverage, liquidity, and user experience within a single account.

marsbitHace 14 hora(s)

Gate Research Institute: The 'Wall Street-ization' Wave of Crypto Financial Products – Competition or Integration?

marsbitHace 14 hora(s)

Trading

Spot

Artículos destacados

Cómo comprar CAP

¡Bienvenido a HTX.com! Hemos hecho que comprar Cap (CAP) sea simple y conveniente. Sigue nuestra guía paso a paso para iniciar tu viaje de criptos.Paso 1: crea tu cuenta HTXUtiliza tu correo electrónico o número de teléfono para registrarte y obtener una cuenta gratuita en HTX. Experimenta un proceso de registro sin complicaciones y desbloquea todas las funciones.Obtener mi cuentaPaso 2: ve a Comprar cripto y elige tu método de pagoTarjeta de crédito/débito: usa tu Visa o Mastercard para comprar Cap (CAP) al instante.Saldo: utiliza fondos del saldo de tu cuenta HTX para tradear sin problemas.Terceros: hemos agregado métodos de pago populares como Google Pay y Apple Pay para mejorar la comodidad.P2P: tradear directamente con otros usuarios en HTX.Over-the-Counter (OTC): ofrecemos servicios personalizados y tipos de cambio competitivos para los traders.Paso 3: guarda tu Cap (CAP)Después de comprar tu Cap (CAP), guárdalo en tu cuenta HTX. Alternativamente, puedes enviarlo a otro lugar mediante transferencia blockchain o utilizarlo para tradear otras criptomonedas.Paso 4: tradear Cap (CAP)Tradear fácilmente con Cap (CAP) en HTX's mercado spot. Simplemente accede a tu cuenta, selecciona tu par de trading, ejecuta tus trades y monitorea en tiempo real. Ofrecemos una experiencia fácil de usar tanto para principiantes como para traders experimentados.

83 Vistas totalesPublicado en 2026.06.26Actualizado en 2026.06.26

Cómo comprar CAP

Discusiones

Bienvenido a la comunidad de HTX. Aquí puedes mantenerte informado sobre los últimos desarrollos de la plataforma y acceder a análisis profesionales del mercado. A continuación se presentan las opiniones de los usuarios sobre el precio de CAP (CAP).

活动图片












