Tes $0,142 Stellar – Mengapa Ini Mungkin Kesempatan Beli yang Ditunggu Trader

ambcryptoPublicado a 2026-06-26Actualizado a 2026-06-26

Resumen

Stellar (XLM) terus mengalami penurunan, diperdagangkan sekitar $0,1514 dengan kerugian harian 7,85%, meski volume perdagangan naik 10,55%. Hal ini menunjukkan aktivitas jual yang dominan. XLM telah menembus di bawah level support kunci dan bergerak menuju zona permintaan berikutnya di $0,142, dengan tren bearish masih menguasai grafik. Indikator teknis memperkuat sinyal bearish. MACD tetap dalam crossover bearish, Parabolic SAR berada di atas candle, dan RSI turun ke 34,42 mendekati area jenuh jual. DMI juga menunjukkan -DI lebih tinggi dari +DI dengan ADX yang menguat, menandakan tren turun masih kuat. Kesimpulannya, kondisi pasar saat ini mendukung kemungkinan penurunan lebih lanjut menuju zona $0,142. Pemulihan berkelanjutan baru dapat diupayakan jika pembeli berhasil mempertahankan zona tersebut dan indikator momentum menunjukkan tanda stabilisasi. Skenario penurunan tetap menjadi outcome yang lebih probable hingga sinyal reversal yang jelas muncul.

Stellar [XLM] melanjutkan penurunannya setelah penjual mempertahankan kendali yang kuat meskipun terjadi peningkatan aktivitas pasar.

Token tersebut diperdagangkan di sekitar $0,1514 pada saat pers rilis, mencerminkan kerugian harian 7,85%, sementara volume perdagangan naik 10,55% menjadi $236,47 juta. Kombinasi ini menunjukkan peserta pasar aktif memperdagangkan penurunan tersebut alih-alih mendukung pemulihan.

XLM bergerak menuju zona permintaan berikutnya

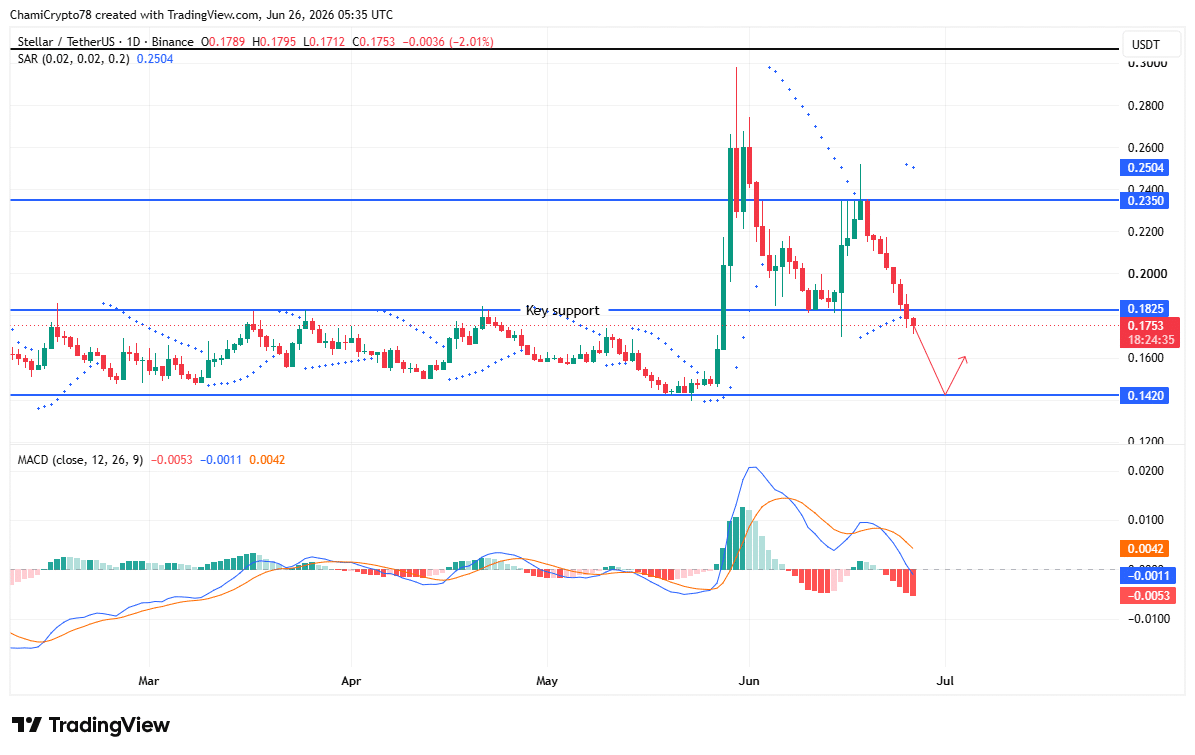
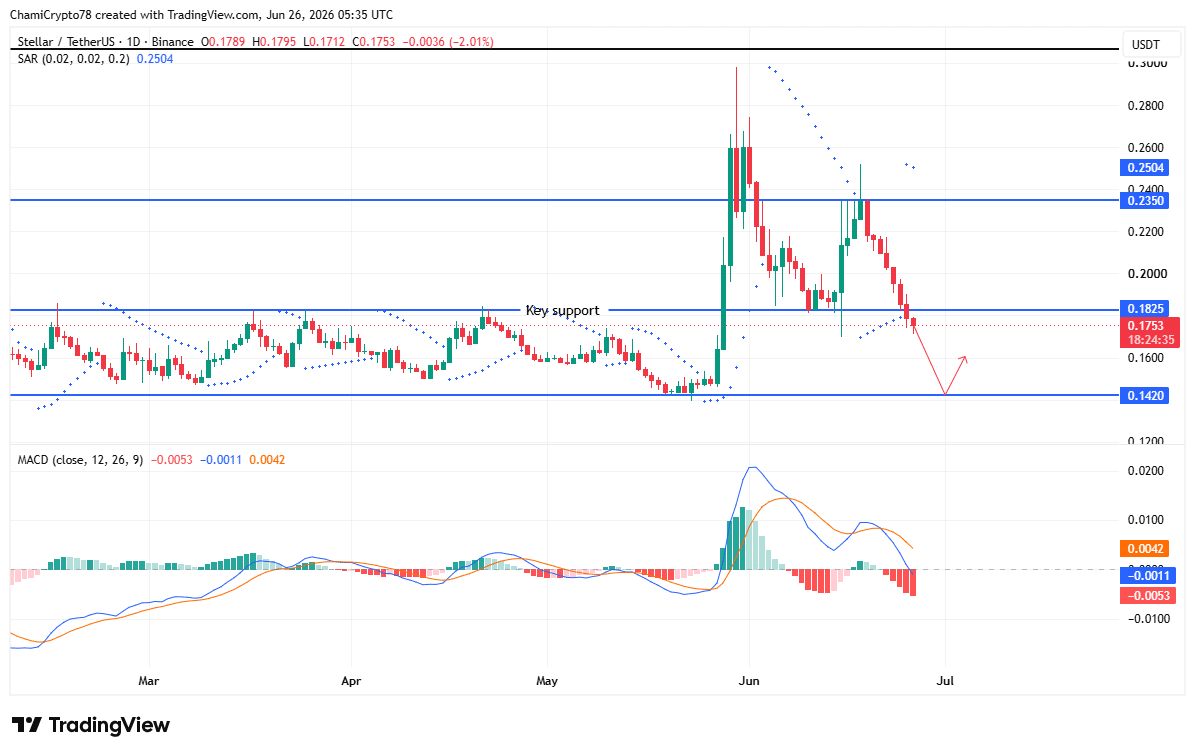
XLM jatuh di bawah dukungan horizontal kunci setelah gagal mempertahankan struktur perdagangan sebelumnya, menjadikan zona permintaan $0,142 sebagai tujuan penurunan utama berikutnya.

Harga tetap berada di bawah garis tren menurun, mencerminkan kendali bearish yang berlanjut di seluruh bagan.

MACD mempertahankan persilangan bearish karena histogram tetap di bawah garis nol, menunjukkan tekanan penurunan belum mereda meskipun ada upaya konsolidasi baru-baru ini.

Selain itu, titik-titik Parabolic SAR terus terbentuk di atas lilin, memperkuat tren turun yang ada alih-alih menandakan pembalikan.

Pembeli berulang kali mencoba merebut kembali tanah yang hilang, namun setiap pemulihan terhenti di bawah dukungan sebelumnya, memperkuat struktur bearish.

Jika penjual mempertahankan kendali, XLM dapat terus bergerak menuju $0,142 sebelum upaya pemulihan yang berarti muncul.
Sumber: TradingView

Pembeli melemah saat beruang mempertahankan kendali

Indikator momentum terus mendukung penjual saat XLM mendekati uji teknis penting lainnya.

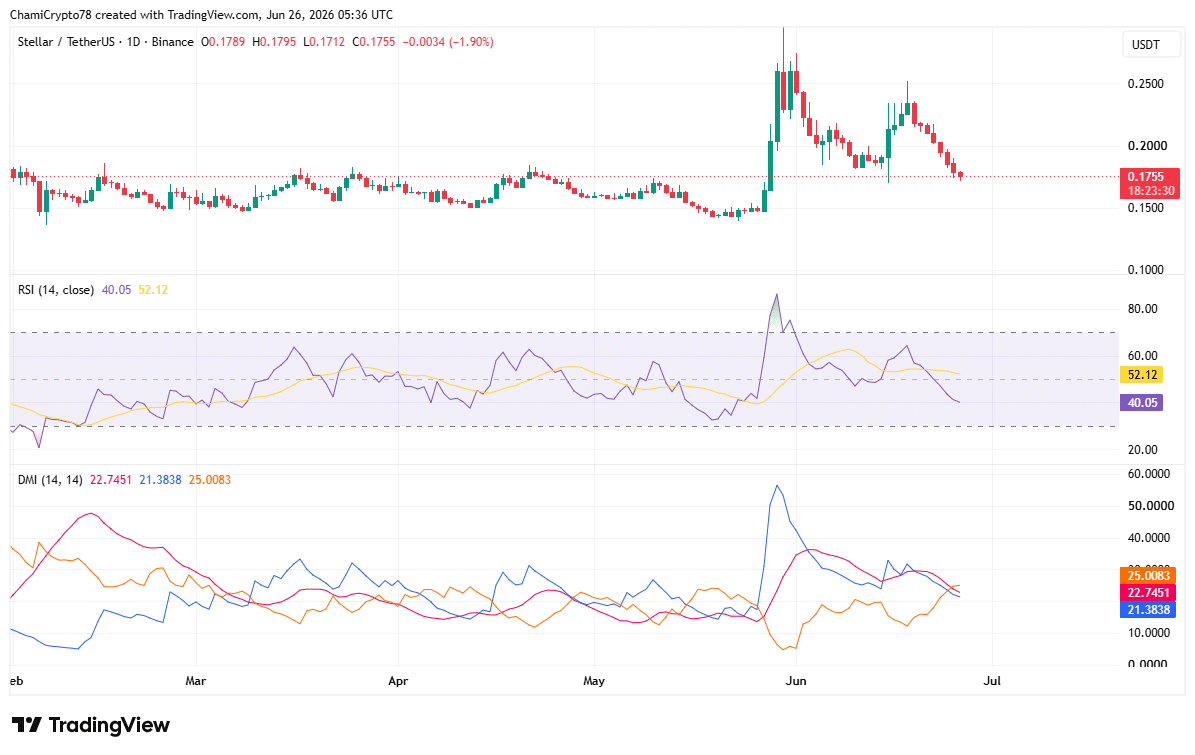
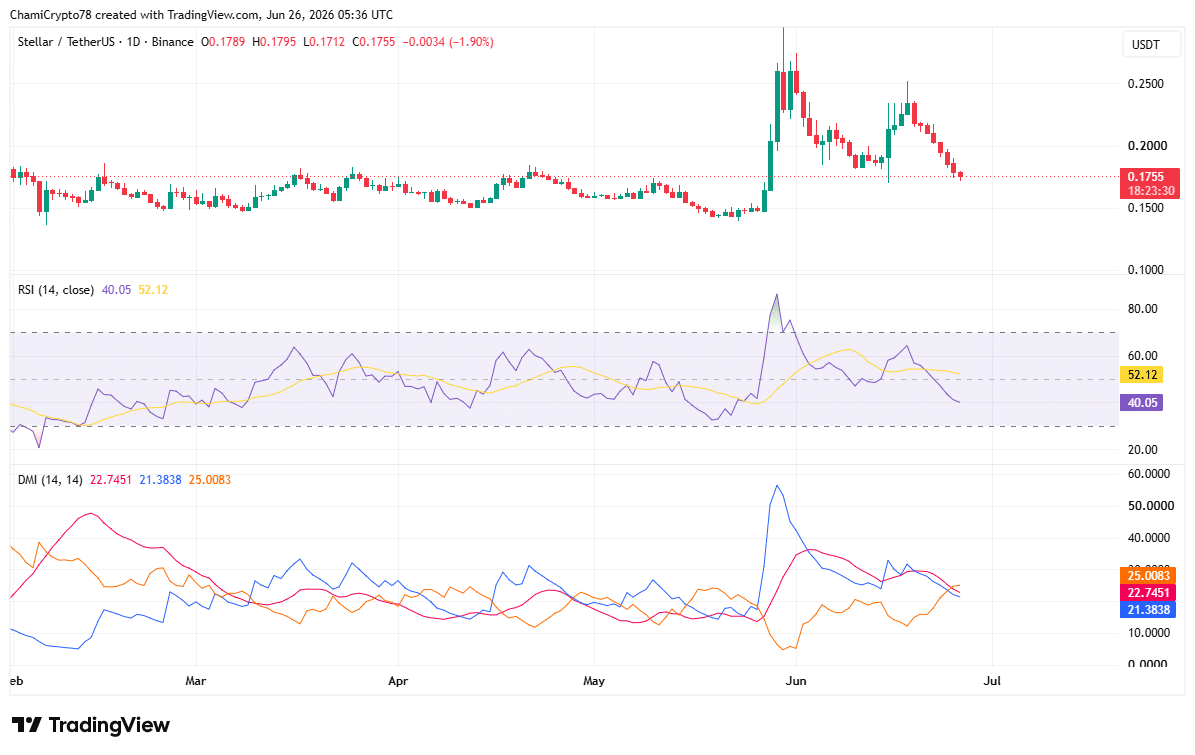
Relative Strength Index (RSI) turun ke 34,42, menempatkannya di dekat wilayah oversold setelah tekanan jual yang berkepanjangan mengurangi partisipasi pembelian.

Meskipun pembacaan tersebut menunjukkan penurunan telah semakin melebar, itu belum mengkonfirmasi sinyal pembalikan.

Sementara itu, Directional Movement Index (DMI) menunjukkan -DI di 25 tetap jauh di atas +DI di 21,38, sementara ADX naik ke 22,75.

Kombinasi ini menunjukkan tren bearish yang berlaku mempertahankan kekuatan yang cukup untuk tetap utuh.

Pembeli kemungkinan perlu merebut kembali kendali atas pergerakan arah sebelum sentimen membaik. Jika tidak, partisipasi yang melemah dapat terus mendukung penurunan lainnya menuju area permintaan berikutnya.
Sumber: TradingView

Apakah XLM Menuju Zona Permintaan $0,142?

Kondisi pasar saat ini mendukung penurunan lainnya menuju zona permintaan $0,142 sebelum pembeli dapat mencoba pemulihan yang berkelanjutan.

Tekanan penjualan mendominasi baik aliran pesanan Spot maupun struktur harga, sementara indikator tren terus mendukung outlook bearish.

Namun, jika pembeli berhasil mempertahankan zona permintaan dan indikator momentum stabil, XLM dapat mulai membangun pemulihan dari area tersebut. Sampai sinyal-sinyal itu muncul, skenario penurunan tetap menjadi hasil yang lebih mungkin.


Ringkasan Akhir

  • Peningkatan aktivitas perdagangan gagal memperlambat penurunan XLM karena penjual terus mengontrol pasar.
  • XLM dapat menguji zona permintaan $0,142 sebelum pembeli mencoba pemulihan yang berarti.

Criptos en tendencia

Preguntas relacionadas

QApa yang menyebabkan harga XLM terus menurun meskipun volume perdagangan meningkat?

AKombinasi peningkatan volume perdagangan dengan penurunan harga menunjukkan bahwa peserta pasar aktif menjual (trading ke dalam penurunan), bukan membeli untuk mendukung pemulihan, sehingga tekanan jual tetap mengontrol pasar.

QZona permintaan (demand zone) penting berikutnya yang menjadi target XLM di level berapa menurut artikel?

AZona permintaan penting berikutnya yang menjadi target penurunan XLM adalah di level $0.142.

QApa yang ditunjukkan oleh indikator MACD dan Parabolic SAR terhadap tren XLM?

AIndikator MACD mempertahankan persilangan bearish (MACD line di bawah signal line) dan histogram berada di bawah garis nol, menunjukkan tekanan penurunan belum mereda. Sementara itu, titik-titik Parabolic SAR terus terbentuk di atas lilin harga, yang menguatkan tren penurunan yang ada, bukan memberi sinyal pembalikan.

QBagaimana kondisi pembeli dan penjual berdasarkan indikator RSI dan DMI?

ARSI berada di 34.42, mendekati wilayah oversold, yang menunjukkan penjualan berkelanjutan telah mengurangi partisipasi pembeli. Pada DMI, nilai -DI (25) masih jauh di atas +DI (21.38), dengan ADX naik ke 22.75. Kombinasi ini menunjukkan tren bearish yang berlaku masih memiliki kekuatan yang cukup untuk tetap utuh, dan penjual masih mengontrol.

QSkenario apa yang lebih mungkin terjadi pada harga XLM berdasarkan kesimpulan artikel?

ASkenario yang lebih mungkin adalah XLM akan melanjutkan penurunannya untuk menguji zona permintaan di $0.142 sebelum pembeli dapat mencoba pemulihan yang berkelanjutan. Hal ini didukung oleh tekanan jual yang mendominasi, struktur harga, dan indikator tren yang masih bearish.

Lecturas Relacionadas

Want to Get Freebies from Robinhood Chain? Which Ecosystem Projects Are Worth Watching?

**Title: Want to Get the Robinhood Chain Airdrop? Which Ecosystem Projects Are Worth Watching?** **Summary:** Robinhood Chain, a key part of Robinhood's push into Layer 2, aims to build a comprehensive ecosystem covering stock tokens, RWAs, perpetual contracts, and spot trading. With its mainnet launch on July 2, 2026, came a 90-day gas fee waiver for swaps, cross-chain transactions, and Perp trading. While the ecosystem's TVL was still modest at around $76.73 million as of July 6, 2026, several early projects present potential opportunities. Key projects highlighted include: * **Arcus:** A stock token and crypto DEX built by dYdX Labs and Robinhood Crypto, focusing on spot and perpetual contracts. Future ARCUS tokens are expected to prioritize the existing dYdX community. * **Lighter:** A ZK-powered decentralized perpetual and spot exchange deployed on Robinhood Chain. It has committed $11 million worth of LIT tokens to the Robinhood community, with users earning points (and double points via Robinhood Wallet) for trading, convertible to LIT. * **Morpho:** Integral to the newly launched "Robinhood Earn" program in the US, where user-supplied USDG stablecoins are lent out via Morpho vaults, targeting a 7% APY. * **Rialto:** An on-chain spot exchange supporting crypto, stocks, ETFs, and commodities. It will initially list over 90 Robinhood stock tokens and uses a "propAMM" system where market makers provide quotes from their own inventory. * **Arrakis:** A non-custodial, on-chain market maker protocol for token issuers to manage concentrated liquidity on DEXs. * **Meridian:** A platform on Robinhood Chain focusing on RWA perpetual contracts and prediction markets, settled in USDe. It rebranded from Ethereal and had previously planned to allocate 15% of its future governance tokens to ENA stakers. * **Native:** An on-chain price discovery and execution system recently deployed on Robinhood Chain, though the team has stated there are no current plans for a token launch. The article emphasizes that this is not investment advice and urges participants to conduct their own research (DYOR).

Foresight NewsHace 29 min(s)

Want to Get Freebies from Robinhood Chain? Which Ecosystem Projects Are Worth Watching?

Foresight NewsHace 29 min(s)

End of Correction or Continuation of Trend: Technical Structure Review of BTC and HYPE | Guest Analysis

**Weekly Technical Analysis: BTC & HYPE Structure Review** This analysis covers the multi-timeframe technical structure for Bitcoin (BTC) and HYPE. **Bitcoin (BTC) Analysis:** BTC's correction from its May 6 high has formed a clear four-segment pattern on the daily chart. The market is currently in a (3-4) rebound phase. The key determinant for the short-term trend is the endpoint of this rebound ("Endpoint 4"): * **Path 1 (Preferred Scenario):** If the rebound surpasses the $65,700 resistance, subsequent pullbacks are less likely to break the key support at $57,820 (July 1 low). This would suggest a transition into a consolidating range, building energy for a potential bullish reversal. * **Path 2:** Failure to reach $65,700, or even $64,500, increases the probability of a breakdown below $57,820, continuing the downtrend. The 4-hour chart shows a completed five-wave decline from June 15, culminating in a momentum divergence at the low, which supported the recent bounce. **BTC Weekly Outlook & Strategy (Jul 6-12):** * **Core View:** Focus on the high point of the daily rebound from $57,820. * **Key Levels:** * Resistance: $64,500-$65,700; $67,300; $69,500-$71,000. * Support: $60,950-$62,300; $57,820; $55,000. * **Strategy:** * **Mid-term:** Maintain ~20% short position. Consider increasing shorts to <50% if price stalls in the $65,700-$67,300 zone with confirming model signals. * **Short-term:** Use 30% capital for swing trades between support/resistance. * **Plans:** * **Plan A (Short):** Enter shorts (~30%) if price is rejected at $65,700-$67,300. * **Plan B (Long):** Enter longs (~15%) only if price breaks above $65,700 first, then pulls back and finds support near $57,820. **HYPE Analysis:** The rebound from the June 25 low has developed a seven-segment structure on the 4-hour chart. Price is approaching the historical high zone near $76.94. Internal models have triggered top warnings, suggesting caution against chasing the rally and highlighting near-term pullback risks. **HYPE Weekly Outlook & Strategy:** * **Core View:** Observe price action in the $75-$76.94 resistance area. * **Key Levels:** * Resistance: $75-$76.94; $80. * Support: $68; $65.5; $60.5-$61.5. * **Strategy:** Prioritize profit-taking and risk management. If holding longs, consider moving stop-loss to ~$68 to protect gains. Close positions promptly on signs of a downturn. **Trade Recap:** A recent short-term long trade in HYPE, entered at $64 based on model buy signals and exited at ~$70.55 on sell signals, yielded a profit of approximately 10.23%. **General Risk Management:** Always set an initial stop-loss. Move stop-loss to breakeven at +1% profit, and trail it upwards by 1% for every subsequent 1% gain to lock in profits. *Disclaimer: Market conditions change rapidly. All analysis, models, and strategies presented are for educational/log purposes only and do not constitute investment advice. Trade at your own risk.*

Odaily星球日报Hace 38 min(s)

End of Correction or Continuation of Trend: Technical Structure Review of BTC and HYPE | Guest Analysis

Odaily星球日报Hace 38 min(s)

Trading

Spot

Artículos destacados

Cómo comprar XLM

¡Bienvenido a HTX.com! Hemos hecho que comprar Stellar (XLM) sea simple y conveniente. Sigue nuestra guía paso a paso para iniciar tu viaje de criptos.Paso 1: crea tu cuenta HTXUtiliza tu correo electrónico o número de teléfono para registrarte y obtener una cuenta gratuita en HTX. Experimenta un proceso de registro sin complicaciones y desbloquea todas las funciones.Obtener mi cuentaPaso 2: ve a Comprar cripto y elige tu método de pagoTarjeta de crédito/débito: usa tu Visa o Mastercard para comprar Stellar (XLM) al instante.Saldo: utiliza fondos del saldo de tu cuenta HTX para tradear sin problemas.Terceros: hemos agregado métodos de pago populares como Google Pay y Apple Pay para mejorar la comodidad.P2P: tradear directamente con otros usuarios en HTX.Over-the-Counter (OTC): ofrecemos servicios personalizados y tipos de cambio competitivos para los traders.Paso 3: guarda tu Stellar (XLM)Después de comprar tu Stellar (XLM), guárdalo en tu cuenta HTX. Alternativamente, puedes enviarlo a otro lugar mediante transferencia blockchain o utilizarlo para tradear otras criptomonedas.Paso 4: tradear Stellar (XLM)Tradear fácilmente con Stellar (XLM) en HTX's mercado spot. Simplemente accede a tu cuenta, selecciona tu par de trading, ejecuta tus trades y monitorea en tiempo real. Ofrecemos una experiencia fácil de usar tanto para principiantes como para traders experimentados.

317 Vistas totalesPublicado en 2024.12.13Actualizado en 2026.06.02

Cómo comprar XLM

Discusiones

Bienvenido a la comunidad de HTX. Aquí puedes mantenerte informado sobre los últimos desarrollos de la plataforma y acceder a análisis profesionales del mercado. A continuación se presentan las opiniones de los usuarios sobre el precio de XLM (XLM).

活动图片