Jito melonjak dengan lonjakan volume 1000% – Akankah volatilitas menghentikan rally JTO?

ambcryptoPublicado a 2026-03-24Actualizado a 2026-03-24

Resumen

Jito (JTO) mengalami lonjakan harga 15,96% menjadi $0,3314 dengan volume perdagangan meledak lebih dari 1000%, menandakan permintaan spot yang kuat dan partisipasi pasar yang meningkat. Breakout dari channel turun dan RSI di 63 mengonfirmasi kekuatan bullish, namun tekanan jual masih dominan dan profit-taking oleh trader ritel berpotensi membatasi kenaikan. Open Interest yang naik 89,51% menunjukkan peningkatan leverage, yang dapat memperpanjang rally atau justru memicu volatilitas tajam jika harga gagal di level resisten. Kelanjutan rally bergantung pada kemampuan buyer menyerap tekanan jual dan mempertahankan momentum.

Jito [JTO] telah meroket 15,96% menjadi $0,3314 pada waktu press time, karena volume perdagangan meledak lebih dari 1000%, menandakan masuknya permintaan spot yang tajam dan partisipasi pasar yang baru. Ekspansi ini mencerminkan pergeseran aktivitas yang tiba-tiba saat pembeli agresif masuk setelah periode konsolidasi.

Patut dicatat, pertumbuhan volume seperti itu tidak muncul secara bertahap; ini mencerminkan urgensi dan keyakinan dari peserta yang masuk dalam skala besar. Akibatnya, harga merespons dengan dorongan ke atas yang jelas, memperkuat kekuatan di balik pergerakan ini.

Namun, lonjakan ini juga menempatkan JTO di zona perhatian tinggi, di mana arus masuk yang cepat dapat mempercepat kelanjutan kenaikan dan volatilitas tergantung pada bagaimana permintaan tindak lanjut berkembang.

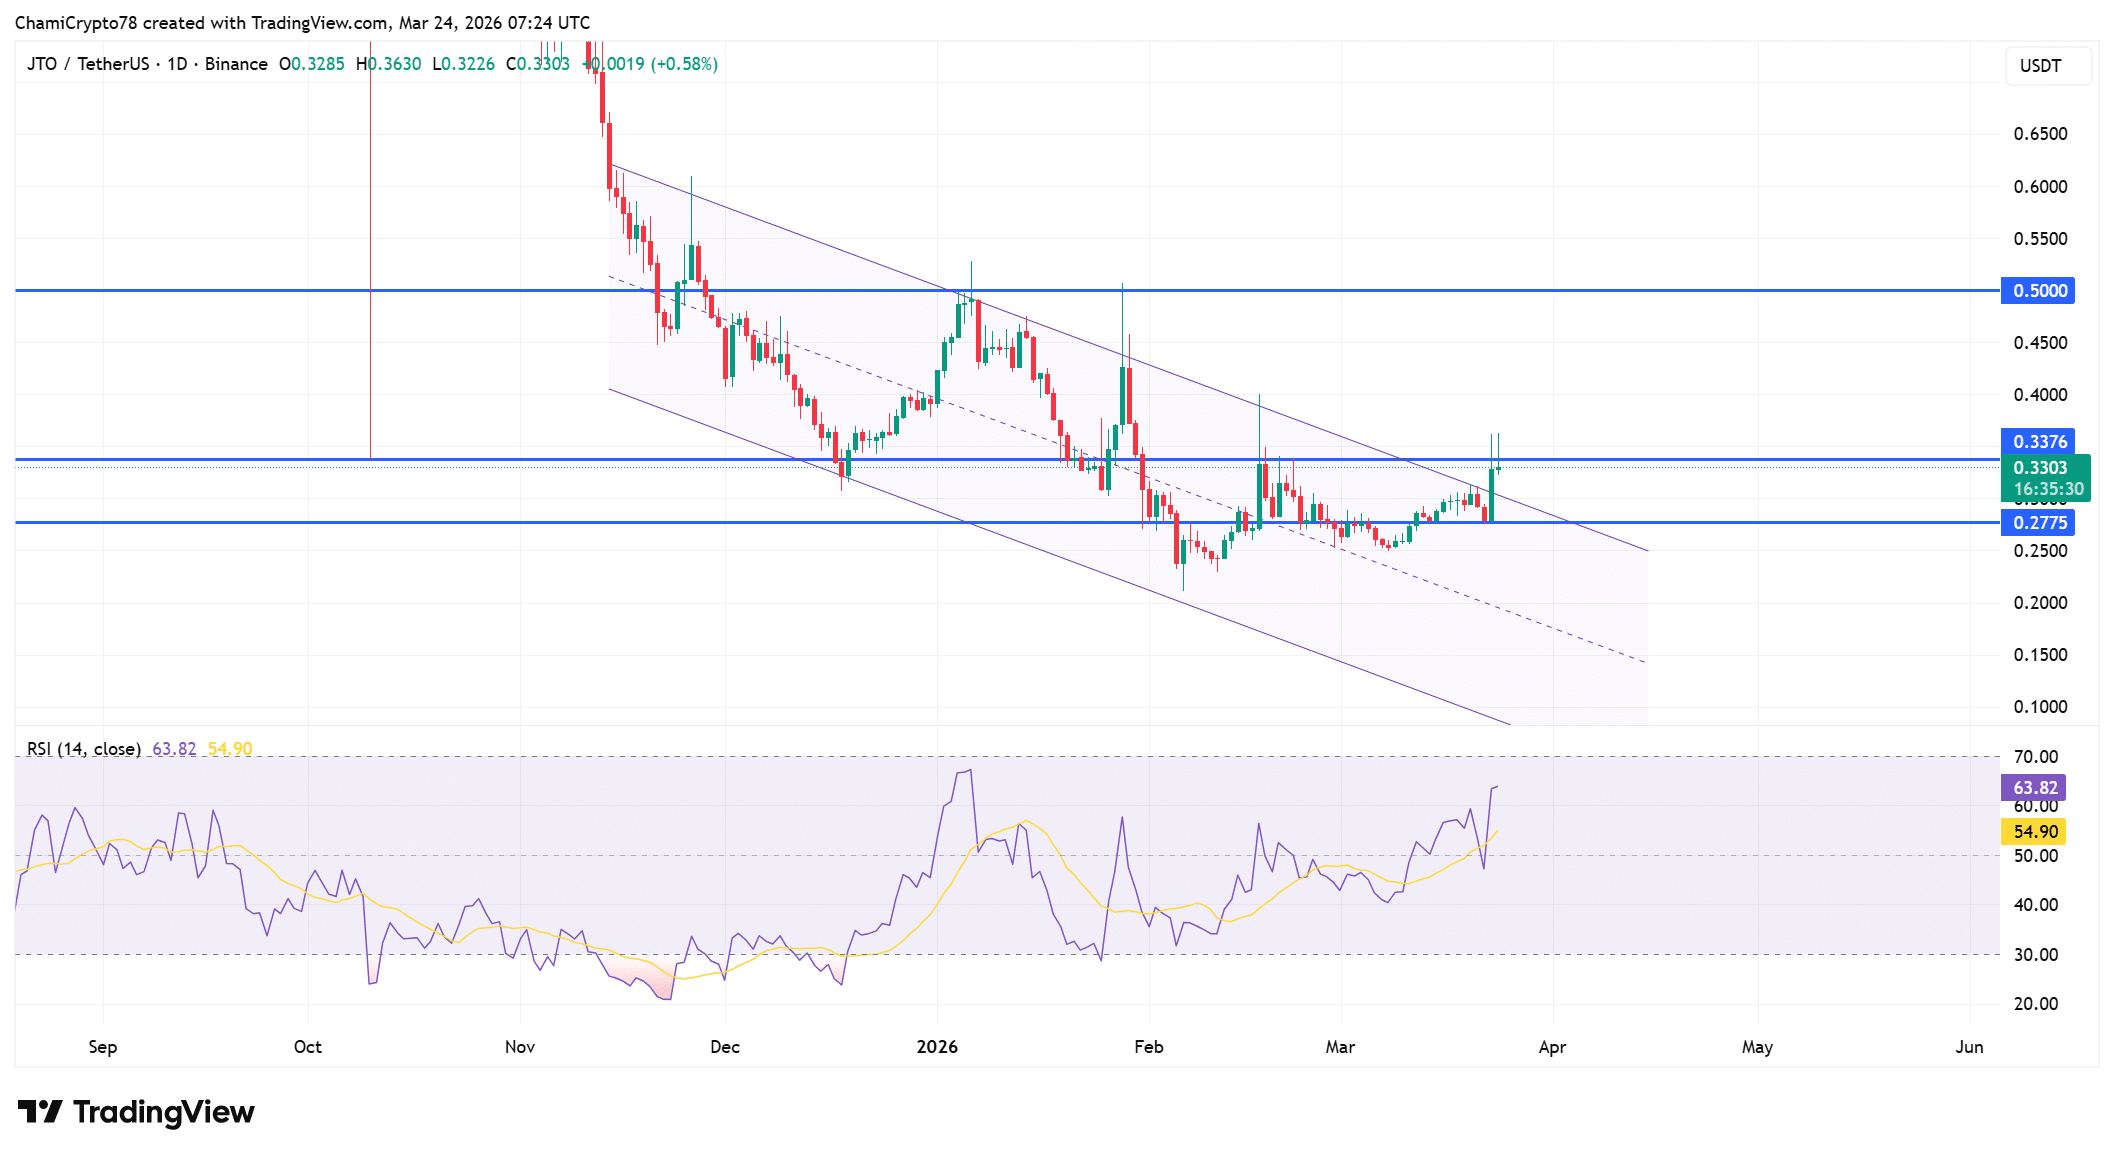
Breakout JTO bertahan saat RSI mengonfirmasi kekuatan

JTO telah keluar dari channel turunnya setelah merebut kembali support $0,2775, menandakan pergeseran struktur jangka pendek yang jelas saat pembeli mengambil kendali. Pergerakan ini mencerminkan transisi dari kompresi ke ekspansi, dengan harga tidak lagi menghormati batas-batas penurunan sebelumnya.

Akibatnya, JTO sekarang menekan resistance $0,3376, yang bertindak sebagai level kunci berikutnya dalam struktur ini. Pada saat yang sama, RSI telah naik menuju 63 pada saat penulisan, memperkuat kekuatan di balik breakout ini tanpa memasuki wilayah overbought. Posisi ini menunjukkan bahwa rally masih memiliki ruang untuk melanjutkan sambil mempertahankan stabilitas.

Selain itu, RSI telah bergerak di atas moving average-nya, selaras dengan perilaku harga saat ini dan mendukung kelanjutan. Namun, bertahan di atas zona breakout tetap kritis, karena kegagalan pada level ini dapat melemahkan struktur dan menarik harga kembali ke konsolidasi.

Sumber: TradingView

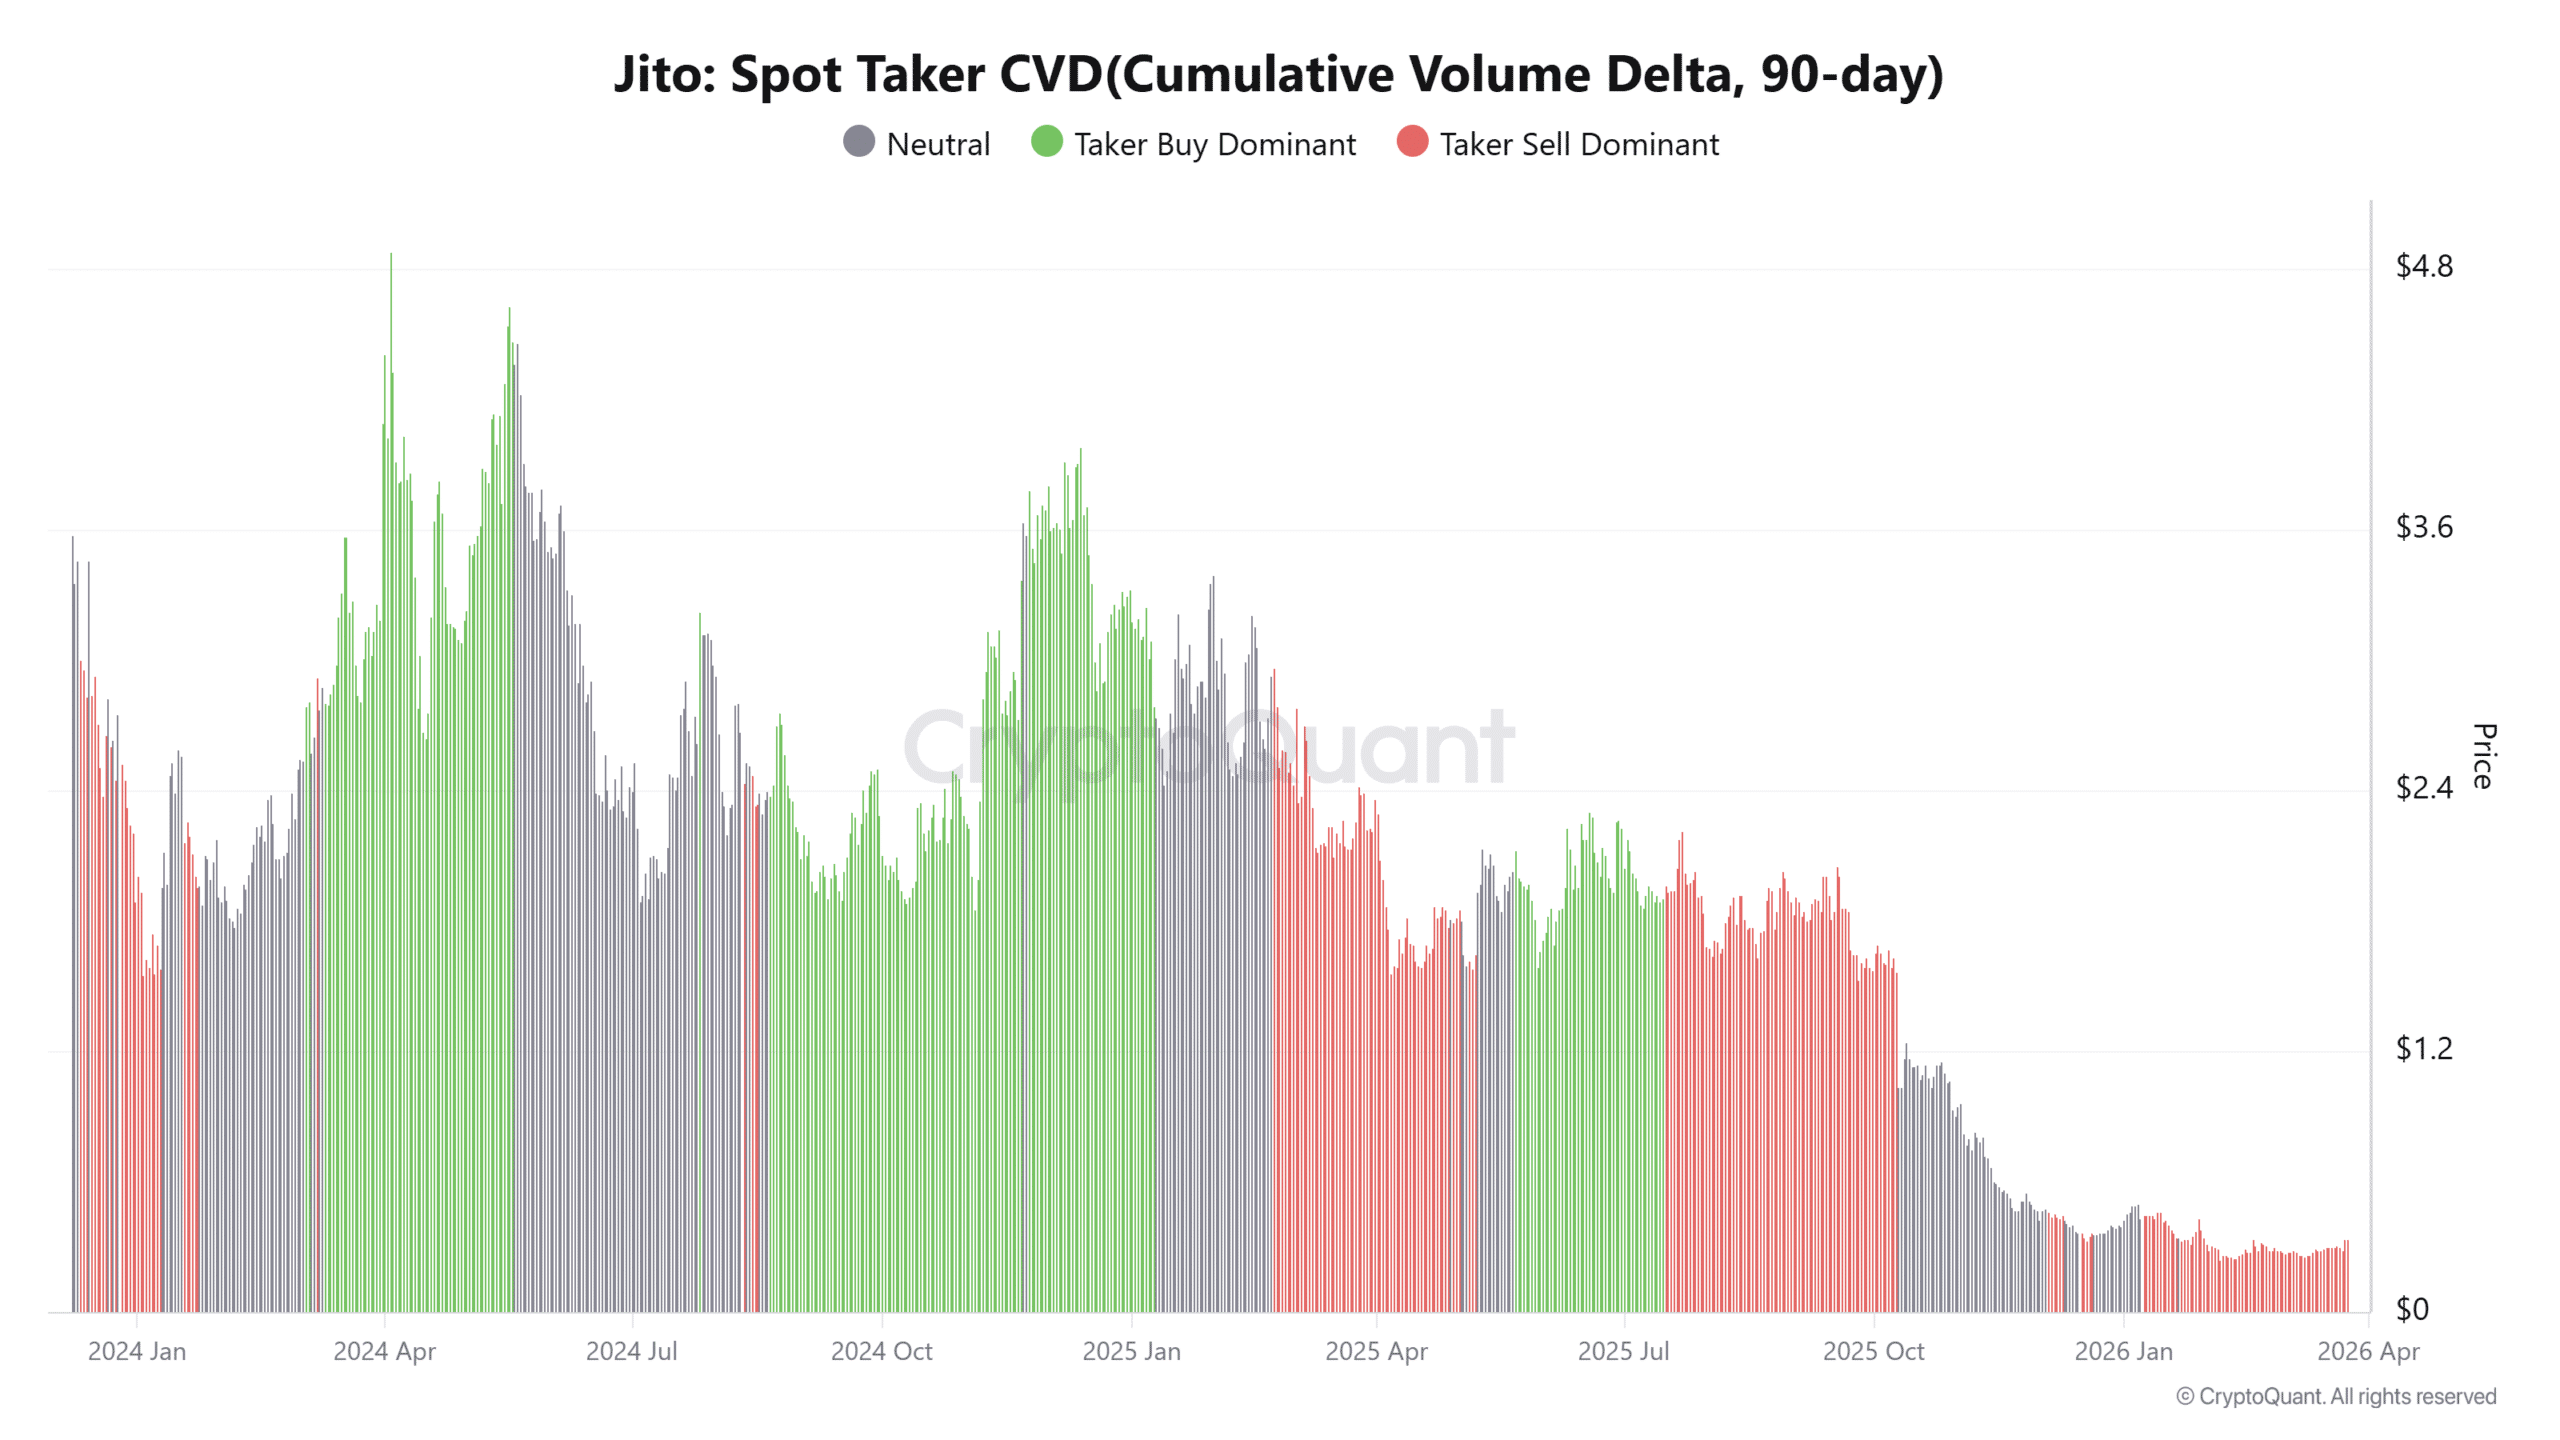
Tekanan jual meningkat saat retail mengunci keuntungan

Meskipun terjadi breakout harga, Spot Taker CVD tetap didominasi penjualan, mengungkapkan bahwa order pasar terus condong ke arah menjual daripada membeli. Divergensi ini menyoroti dinamika kunci di mana harga naik bahkan ketika peserta mengambil keuntungan dari kekuatan.

Perilaku seperti itu sering mencerminkan trader retail keluar dari posisi setelah rally, sementara tangan yang lebih kuat menyerap pasokan. Akibatnya, pergerakan yang sedang berlangsung sangat bergantung pada apakah tekanan jual ini diserap secara efisien.

Namun, jika dominasi jual terus berlanjut tanpa permintaan yang cukup, hal ini dapat memperlambat rally dan membatasi ekspansi kenaikan lebih lanjut.

Sumber: CryptoQuant

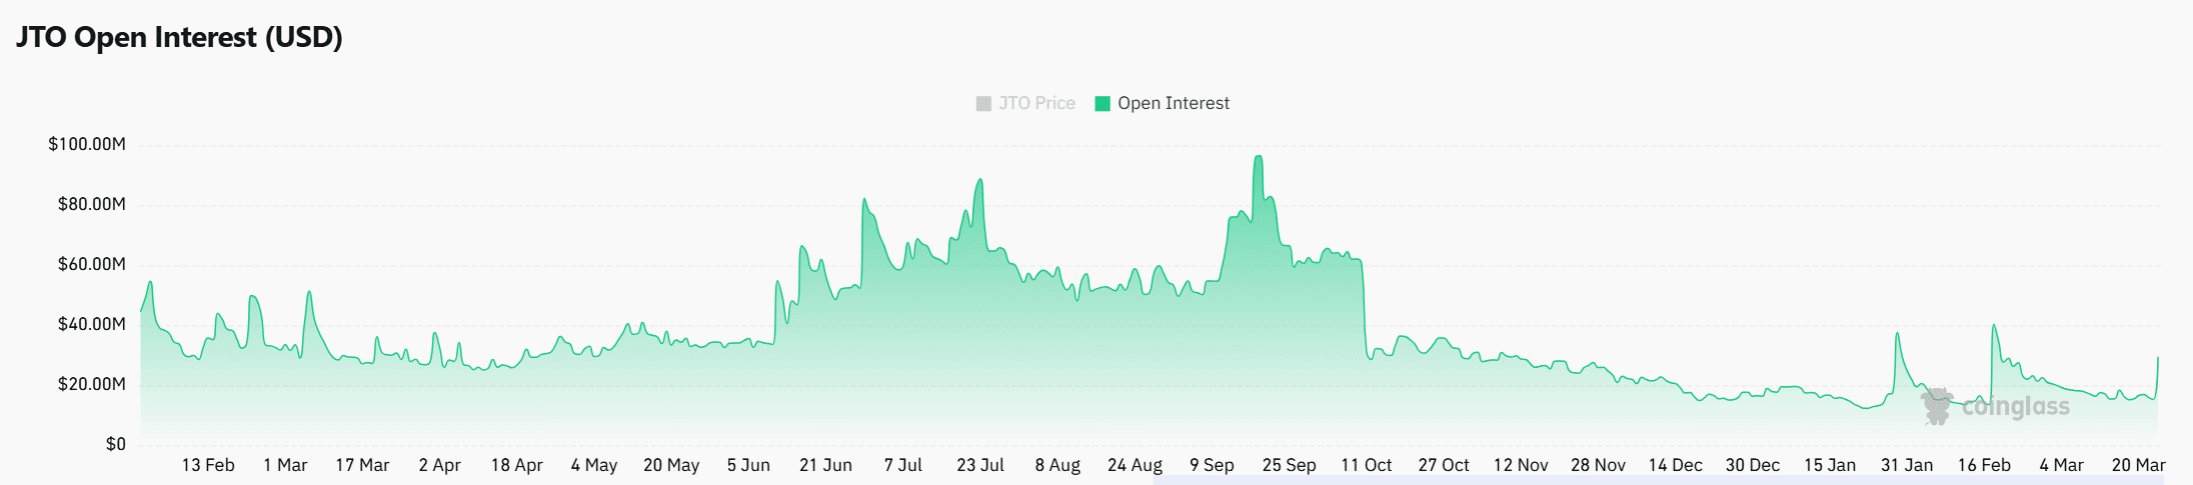
Leverage terbangun cepat seiring Open Interest JTO melonjak

Open Interest (OI) telah melonjak 89,51% menjadi $28,97 juta, menunjukkan kenaikan tajam dalam posisi leveraged saat trader masuk ke pasar dengan agresif. Peningkatan ini mencerminkan partisipasi yang tumbuh dalam derivatif, biasanya selaras dengan ekspektasi arah yang kuat.

Seiring harga dan OI naik bersama, ini menunjukkan bahwa trader sedang membangun posisi yang mengantisipasi kelanjutan kenaikan. Namun, ekspansi yang cepat seperti itu juga memperkenalkan risiko, karena posisi yang padat dapat memperbesar volatilitas.

Jika harga terus lebih tinggi, posisi-posisi ini dapat memicu kenaikan lebih lanjut melalui likuidasi paksa. Di sisi lain, jika harga terhenti di dekat resistance, leverage yang sama dapat berbalik dengan cepat, memicu pergerakan turun yang tajam yang didorong oleh likuidasi dan penutupan posisi.

Sumber: CoinGlass

Kesimpulannya, breakout JTO mencerminkan pemulihan struktural yang kuat yang didukung oleh ekspansi volume dan peningkatan leverage. Namun, alur order yang didominasi jual menandakan pengambilan keuntungan aktif yang dapat membatasi kenaikan jika permintaan melemah.

Jika pembeli terus menyerap tekanan jual, breakout kemungkinan akan bertahan dan melanjutkan lebih tinggi. Jika tidak, penumpukan posisi leveraged dapat mempercepat penarikan tajam dari level resistance saat ini.


Ringkasan Akhir

  • Breakout JTO mencerminkan kontrol pembeli yang kuat, tetapi keberlanjutan bergantung pada penyerapan tekanan sisi jual yang persisten di dekat resistance.
  • Kenaikan leverage bersama harga akan memperbesar keuntungan, namun juga meningkatkan risiko pergerakan turun tajam yang didorong likuidasi.

Preguntas relacionadas

QApa yang menyebabkan harga Jito (JTO) mengalami kenaikan signifikan sebesar 15,96%?

AHarga JTO naik 15,96% didorong oleh lonjakan volume perdagangan lebih dari 1000%, yang menandakan masuknya permintaan spot yang tajam dan partisipasi pasar yang baru.

QApa arti dari RSI yang mencapai level 63 untuk pergerakan harga JTO?

ARSI yang mencapai 63 mengonfirmasi kekuatan di balik breakout ini tanpa memasuki wilayah overbought, menunjukkan bahwa rally masih memiliki ruang untuk melanjutkan kenaikan dengan stabilitas.

QMeskipun harga naik, mengapa Spot Taker CVD tetap didominasi oleh penjualan?

ASpot Taker CVD yang didominasi penjualan mengungkapkan bahwa pesanan pasar cenderung pada penjualan, yang mencerminkan perilaku trader ritel yang mengambil keuntungan (profit-taking) selama kenaikan harga.

QApa risiko yang ditimbulkan dari melonjaknya Open Interest (OI) sebesar 89,51%?

ALonjakan Open Interest (OI) menunjukkan peningkatan posisi leverage yang tajam, yang dapat memperbesar volatilitas. Posisi yang padat ini dapat memicu pergerakan turun yang tajam jika harga gagalangi di level resistance karena likuidasi dan penutupan posisi.

QApa dua faktor kunci yang akan menentukan keberlanjutan breakout JTO menurut ringkasan akhir artikel?

AMenurut ringkasan akhir, keberlanjutan breakout bergantung pada: (1) Kemampuan pembeli untuk terus menyerap tekanan jual yang persisten di dekat resistance, dan (2) Pengaruh leverage yang meningkat, yang dapat memperbesar keuntungan tetapi juga meningkatkan risiko pergerakan turun.

Lecturas Relacionadas

Conversation with Arthur Hayes: AI Has Drained Market Liquidity, BTC Will Be Below 100k by Year-End

In this June 2026 podcast interview, BitMEX co-founder Arthur Hayes explains his decision to sell his major crypto holdings (HYPE, NEAR, Worldcoin, Zcash). His rationale is based on a macro view linking oil prices, the Iran conflict, US politics, and an impending AI bubble burst. Hayes argues that high oil prices, driven by the ongoing war, will pressure domestic US inflation. To salvage the Republican Party's chances in the midterm elections, he believes Donald Trump may pivot to a populist, anti-AI stance—advocating for taxes and regulation—which would deflate the AI investment narrative. He sees the AI sector, particularly massive capital expenditure on data centers, as having absorbed nearly all excess market liquidity (around $1.5 trillion in debt issuance since 2025), starving other assets like Bitcoin. He highlights the upcoming SpaceX IPO at a ~$1.8 trillion valuation and 100x price-to-sales ratio as a potential tipping point. If these hyped IPOs underperform, it could shatter market confidence in AI. In such a scenario, all risk assets, including crypto, would fall together as correlations converge to 1 during a broad correction. Hayes has moved his portfolio into Treasuries and energy stocks (like ExxonMobil), predicting Bitcoin will be below $100k by year-end. He sees a potential crypto bull market only after the AI frenzy cools, liquidity stops flowing exclusively into AI, and possibly after a significant market downturn prompts new monetary stimulus.

marsbitHace 6 min(s)

Conversation with Arthur Hayes: AI Has Drained Market Liquidity, BTC Will Be Below 100k by Year-End

marsbitHace 6 min(s)

Fed's Internal Doves Flock to Hawkish Stance, Warsh's Debut "Between a Rock and a Hard Place"

U.S. Federal Reserve officials who previously advocated for rate cuts, including Governor Christopher Waller, have recently shifted their stance, with many now not ruling out the possibility of future rate hikes. This sets a challenging stage for new Fed Chair Kevin Warsh's first policy meeting. Appointed by President Trump based on his dovish views, Warsh now faces a committee where the debate has pivoted from "when to cut" to "whether to hike," driven by persistent inflation above 3%, a strong labor market, and supply-side pressures from AI infrastructure demands and geopolitical tensions. Key figures illustrate the shift. Governor Waller, once concerned about employment, now says data has pushed him toward considering rate increases. Even moderate voices like Governor Lisa Cook, while expecting inflation to ease, have indicated readiness to hike if it fails to do so. Long-time hawks such as regional Fed presidents Beth Hammack, Lorie Logan, and Neel Kashkari have grown more vocal, arguing that the real policy rate is effectively falling and that action may soon be needed. The upcoming Fed meeting is expected to keep rates steady but will likely remove the "easing bias" from its statement, signaling a neutral stance between cuts and hikes. The quarterly "dot plot" is anticipated to show most officials projecting no cuts this year, with some potentially indicating hikes. Chair Warsh, a critic of the Fed's reliance on forward guidance like the dot plot, must navigate communicating this pivot using tools he has questioned, all while steering policy in a direction counter to the preferences of the president who appointed him. The consensus suggests the Fed's next move could well be a rate increase.

marsbitHace 1 hora(s)

Fed's Internal Doves Flock to Hawkish Stance, Warsh's Debut "Between a Rock and a Hard Place"

marsbitHace 1 hora(s)

The Trillion-Yuan Market Cap 'Yi Zhong Tian': Who is the True Value King?

The article analyzes the three leading Chinese optical module companies, collectively nicknamed "Yi Zhong Tian": Xinyisheng, Zhongji Innolight, and TFC Optical Communication. It evaluates their "cost-performance" not by current stock price, but through three lenses: PEG ratio (growth vs. valuation), earnings quality, and premium/discount for certainty. Xinyisheng shows the most attractive PEG ratio and high profitability, but its valuation reflects discounts for risks like high customer concentration and reliance on overseas markets. Zhongji Innolight, the most expensive, commands a premium for its market leadership, dominant share in key products like 800G/1.6T modules, and higher earnings certainty, though it faces geopolitical risks. TFC Optical, as an upstream component supplier ("water seller"), has the highest gross margin and bets on the long-term CPO/NPO architecture trend, but trades at a high valuation with more stable, less explosive growth. The core argument is that while these companies dominate module assembly, the true profit pool and technological moat lie upstream in laser and switch chips, currently controlled by U.S. firms like Lumentum and Coherent. The long-term "cost-performance" for these Chinese leaders hinges on whether the domestic industry, exemplified by companies like Yuanjie Technology, can successfully move up the value chain into high-power laser chips. Otherwise, their high growth may remain confined to the lower-margin assembly segment.

marsbitHace 1 hora(s)

The Trillion-Yuan Market Cap 'Yi Zhong Tian': Who is the True Value King?

marsbitHace 1 hora(s)

Has the Crypto Market Bottomed? Here's What Institutions Think

The crypto market is in a period of significant debate, with leading institutions offering differing views on whether a bottom has been reached. Three prominent firms have published detailed analyses: * **Galaxy Digital** argues Bitcoin has **not yet bottomed**. Their analysis of 13 historical indicators across six dimensions (valuation, profit-taking, miner pressure, etc.) shows only four are fully met. They project a potential bottom range between $30k and $54k. * **NYDIG** states a bottom is **possible but not likely**. While metrics are close to historic bear market extremes, they note the absence of a classic panic-selling event. They also suggest increased institutional adoption may have structurally altered the market cycle, potentially leading to a shallower downturn. * **Standard Chartered Bank** asserts the **bottom has already occurred** at around $59k. They cite two key factors: potential US-Iran diplomatic progress and the anticipated SpaceX IPO, which they believe absorbed capital and caused ETF selling pressure that is now subsiding. They forecast a year-end price target of $100k. Despite the surface-level disagreement, the reports share critical common ground more valuable for long-term investors: 1. All three believe the market bottom will form **within this year**. 2. All agree the current price is **closer to the bottom than to previous highs**. 3. All maintain a **bullish long-term outlook** for Bitcoin and a new cycle. The core takeaway is that while the exact bottom price ($40k, $50k, or $60k) is debated, the consensus is that a bottom is imminent. For long-term holders, the primary focus should not be pinpointing the absolute low, but on the future potential for prices to reach $100k, $200k, or higher. The fundamental thesis for Bitcoin—sovereign debt accumulation, inflation, declining trust in centralized institutions, global digitization, and improved accessibility—remains intact and is arguably strengthening. The overall landscape is viewed as more favorable than in previous crypto winters.

marsbitHace 1 hora(s)

Has the Crypto Market Bottomed? Here's What Institutions Think

marsbitHace 1 hora(s)

Trading

Spot
Futuros

Artículos destacados

Cómo comprar JTO

¡Bienvenido a HTX.com! Hemos hecho que comprar Jito (JTO) sea simple y conveniente. Sigue nuestra guía paso a paso para iniciar tu viaje de criptos.Paso 1: crea tu cuenta HTXUtiliza tu correo electrónico o número de teléfono para registrarte y obtener una cuenta gratuita en HTX. Experimenta un proceso de registro sin complicaciones y desbloquea todas las funciones.Obtener mi cuentaPaso 2: ve a Comprar cripto y elige tu método de pagoTarjeta de crédito/débito: usa tu Visa o Mastercard para comprar Jito (JTO) al instante.Saldo: utiliza fondos del saldo de tu cuenta HTX para tradear sin problemas.Terceros: hemos agregado métodos de pago populares como Google Pay y Apple Pay para mejorar la comodidad.P2P: tradear directamente con otros usuarios en HTX.Over-the-Counter (OTC): ofrecemos servicios personalizados y tipos de cambio competitivos para los traders.Paso 3: guarda tu Jito (JTO)Después de comprar tu Jito (JTO), guárdalo en tu cuenta HTX. Alternativamente, puedes enviarlo a otro lugar mediante transferencia blockchain o utilizarlo para tradear otras criptomonedas.Paso 4: tradear Jito (JTO)Tradear fácilmente con Jito (JTO) en HTX's mercado spot. Simplemente accede a tu cuenta, selecciona tu par de trading, ejecuta tus trades y monitorea en tiempo real. Ofrecemos una experiencia fácil de usar tanto para principiantes como para traders experimentados.

99 Vistas totalesPublicado en 2024.12.11Actualizado en 2026.06.02

Cómo comprar JTO

Discusiones

Bienvenido a la comunidad de HTX. Aquí puedes mantenerte informado sobre los últimos desarrollos de la plataforma y acceder a análisis profesionales del mercado. A continuación se presentan las opiniones de los usuarios sobre el precio de JTO (JTO).

活动图片