Cash flows and revenues may be bearish for digital assets, as they place caps on their potential valuations in line with traditional companies with far slower growth trajectories
“The nature of crypto is that it cares about growth potential,” one portfolio manager said
_
_
Most cryptocurrencies die.
It’s well known among those who’ve witnessed more than one cycle. Hundreds, if not thousands, of tokens surge, alongside bitcoin and ether, but rarely — or, often never — reclaim all-time highs.
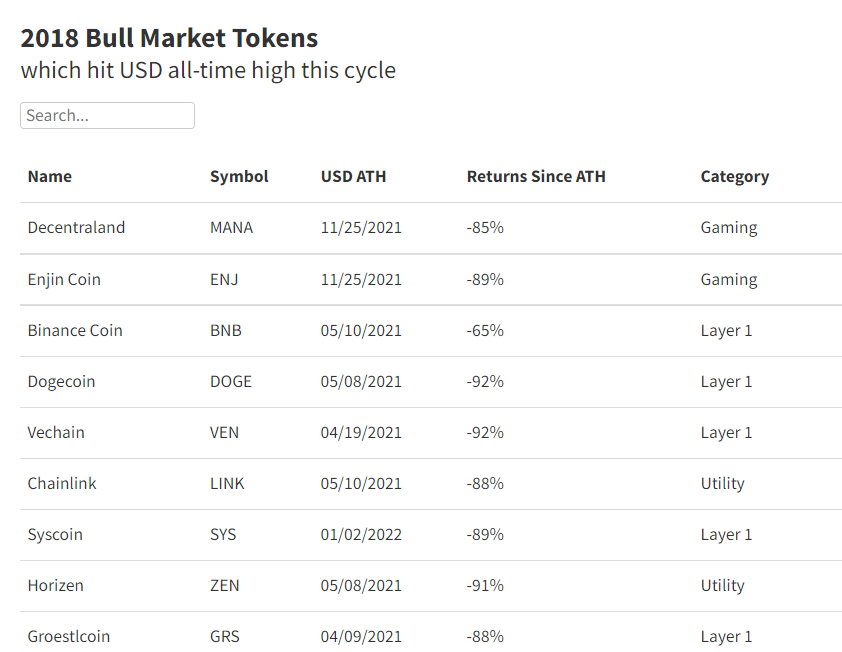
Just 26 of the top 200 digital assets by market capitalization went on to set new highs after the peak of the last bull market in January 2018.
Half were layer-1 tokens, such as litecoin, ether and cardano. Five were governance tokens conferring voting rights powering decentralized finance protocols, such as Gnosis and district0x.
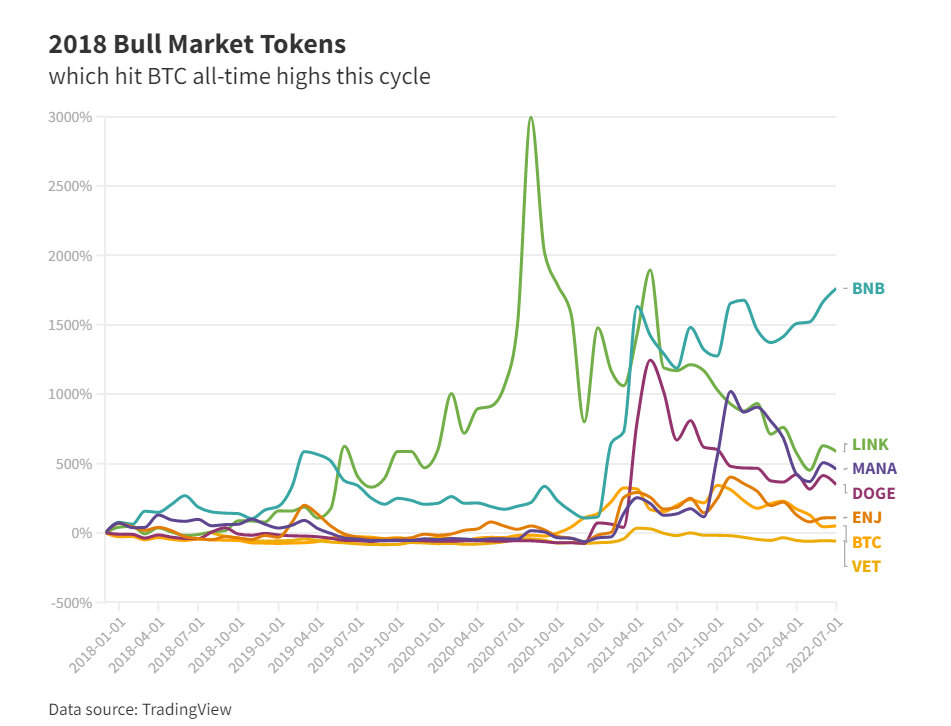
It’s not a rosy picture. But the outlook deteriorates further in denominating how much a cryptocurrency is worth in bitcoin terms, instead of the customary dollar.
Switch to bitcoin pricing, and only six of those cryptocurrencies exceeded their previous peak over the same time period: dogecoin, binance coin, chainlink, decentraland, vechain and enjin coin.
A small selection of winners, representing just 3% of the top 200 digital assets. There’s no clear trend linking them, either.
Dogecoin is literally a “to-the-moon” self-parody, while layer-1 token vechain is powered by the “blockchain for supply chains” meme.
Binance coin boasts some staying power buoyed by enticing burn mechanisms. Chainlink has, arguably, more utility than most, supporting a stretching ecosystem of data feeds and price oracles, which connect various blockchains and smart contracts to execute transactions without third-party validators.
Decentraland and enjin coin’s success, industry participants say, can be explained in part by the metaverse brouhaha and blockchain-powered gaming dapps (decentralized applications) expected to soon grow in popularity.
Such spurious connections suggest most digital assets inevitably crescendo in a bull market, but quickly go kaput once the hype fades — destined to never revisit their glittery glories to render top-buying bagholders whole.
So, how does one equitably price digital assets? What is crypto worth, really?
Considering the top 200 coins from the previous bull market are down more than 90%, in dollar terms, from all-time highs, how and why do markets decide how low they go?
Cash flows are bearish for digital assets
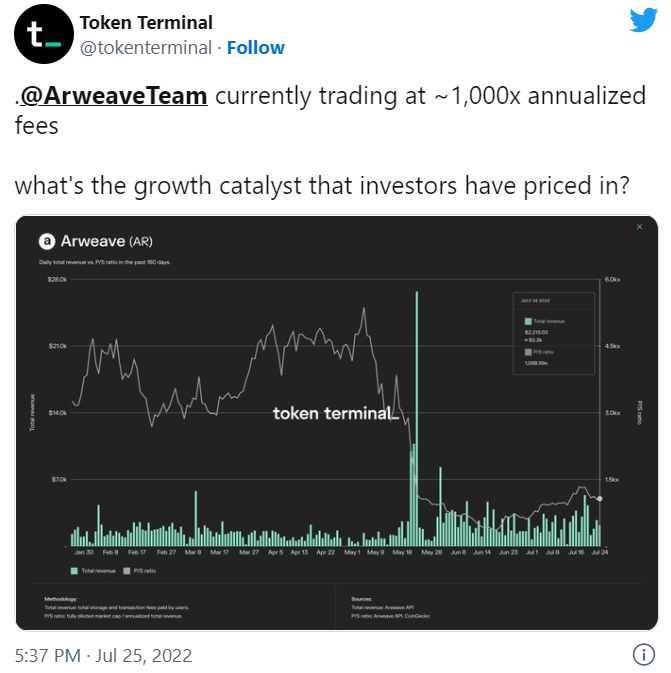
Token Terminal is one platform pitching ways to figure it all out. It offers a range of metrics that aim to compare various protocols, echoing traditional company valuation methods in price-to-earning ratios and total revenues.
“Looking backwards, especially comparing the 2018 bull market to what we witnessed in 2021, it’s very difficult to really build any sort of thesis for why certain tokens succeed,” Oskari Tempakka, Token Terminal’s growth lead, told Blockworks.
The platform gauges protocols that generate cash flow alongside blockchain startups that operate entirely on-chain. It wasn’t possible to value protocols based on those factors during the last bull market, Tempakka said, as it was only halfway through 2020 — during DeFi summer — when the first applications built on Ethereum actually started generating positive cash flows to the protocol.
The conclusion: Analyzing the highest-flying cryptocurrencies from the last bull, whether dollar valuation or bitcoin, on a fundamental basis is essentially impossible.
Still, half of the top 200 digital assets which recorded fresh all-time highs throughout the most recent cycle were layer-1 assets.
Layer-1s, the backbone of digital assets, outperformed this time around on the back of healthy name recognition and the efforts of legions of developers, as well as market makers and deep-pocketed traders favoring assets with more liquidity.
There has to be a sizable market capitalization for a $1 billion-plus hedge fund to bother trading an asset — or else move the price needle so much in building a long or short leg that profits become obsolete.
“I’d say the thesis behind layer-1s is that you’re essentially building an infinitely scalable settlement layer for any other applications being built on top,” Tempakka said. “It’s easier to build a more bullish thesis without a valuation cap than it is for a pure application — that’s how we’re looking at layer-1s right now, at least the ones that actually are able to generate cash flow and capture that value.”
Cash flows are actually bearish as they relate to trying to put a price tag on cryptoassets. They’re not bearish in and of themselves as a metric, but industry participants argue that crypto’s rapid growth trajectory demands a different framework.
Applying convention fundamental stock-picking techniques would never work with venture capital-backed startups, they say — so why should it work when it comes to digital assets?
If it’s possible to value a cryptoasset based on conventional fundamentals, then a relatively apples-to-apples comparison to a real-world company ought to be possible, too.
“Crypto doesn’t care about fundamentals, traditional sense of cash flows,” Hassan Bassiri, vice president of portfolio management at digital asset manager Arca, told Blockworks. “The nature of crypto is that it cares about growth potential.”
Added Bassiri: “Say something like Aave or Yearn is trading at a 1,000 price-to-sales ratio but its fintech competitor neobank is trading at 200 — is the cryptocurrency worth a 5x multiple on that?”
Tapping cash flows to value digital assets — just like an Amazon or a Tesla stock — implies they can’t go up forever, a notion akin to kryptonite for crypto die-hards.
Indeed, cash flows provide one method of valuing digital assets, which automatically means they can’t go up forever, a notion akin to kryptonite for cryptocurrency investors.
The result: a volatile, topsy-turvy market that prioritizes social sentiment and glamor over Econ 101.
Markets driven by fundamentals are on the horizon
If looking to the past doesn’t illuminate how traders appraise digital assets, who’s to say which projects out of a sea of many hopefuls have a realistic shot at outlasting the bear market?
One cause for optimism, according to Bassiri: More and more protocols are working to tie real-world use cases to on-chain yield. Case in point: MakerDAO’s recent move to float a $100 million loan denominated in the token DAI to 151-year old Huntingdon Valley Bank, with the potential to increase the credit revolver to a staggering $1 billion over 12 months.
Token Terminal’s Tempakka is vying for the prospects of a future in which the majority of top tokens are driven by measurable fundamentals — and they must generate sustainable cash flows to power that model.
“If you’re a traditional private equity investor, you’re getting to a stage where you can look at the revenue data of crypto protocol and actually build a strong investment thesis around it,” Tempakka said.
In other words, it’s slowly — then, perhaps, all at once — becoming possible to rationalize crypto plays on something more tangible than hype or belief.
Many an institutional digital assets-focused trader would argue that world is already here. Crypto hedge fund firms build complicated quant models around social sentiment and ebbs and flows in trading volumes.
But those players are often the first to admit those convictions that construct strategies change rapidly in cryptoland. Fundamental metrics are, finally, becoming a powerful standby for sophisticated investors — consider the rise of discretionary strategies — but, for now, they’re just one piece of the overall puzzle.
The remainder is filled in by deep research probing the ins-and-outs of developer teams and their abilities, or lack thereof, to meet the lofty, winding road that lies before them.