Las Salidas de Fondos de los ETF de Bitcoin y Ethereum Persisten: Los Flujos Netos Mensuales Siguen en Rojo

bitcoinistPublicado a 2025-12-31Actualizado a 2025-12-31

Resumen

Los fondos cotizados (ETF) de Bitcoin y Ethereum continúan registrando salidas netas de capital, con flujos negativos de -656 millones de dólares para BTC y -422 millones para ETH en los últimos 30 días. Esta tendencia refleja una demanda débil similar a la observada en la primera mitad de 2025, aunque históricamente estos periodos han sido seguidos por recuperaciones explosivas. Paralelamente, las reservas corporativas y gubernamentales de criptoactivos superan los 185.000 millones de dólares, con empresas controlando el 73% del total. Mientras, el precio de Bitcoin se mantiene estable alrededor de los 88.100 dólares, mostrando una fase de consolidación en el mercado.

Los datos muestran que el flujo neto de ETF a 30 días sigue siendo negativo tanto para Bitcoin como para Ethereum, lo que sugiere que el capital ha estado saliendo de los activos digitales.

Los Flujos Netos de los ETF de Bitcoin y Ethereum Han Sido Negativos Recientemente

Como explicó el analista comunitario de CryptoQuant, Maartunn, en una nueva publicación en X, los fondos cotizados en bolsa (ETF) spot de Bitcoin y Ethereum han enfrentado un flujo neto negativo durante el último mes.

Los ETF spot son vehículos de inversión que permiten a los inversores obtener exposición indirecta a los movimientos de precio de un activo subyacente. En el contexto de las criptomonedas, esto significa que un inversor en ETF nunca tiene que interactuar on-chain; el fondo compra y custodia los tokens en su nombre.

Los ETF spot estadounidenses son un fenómeno relativamente nuevo en el sector de los activos digitales, que solo obtuvieron la aprobación de la Comisión de Bolsa y Valores (SEC) en enero de 2024 para Bitcoin y en julio de 2024 para Ethereum.

Los ETF spot pueden parecer un modo conveniente de inversión para los traders no familiarizados con los monederos y exchanges de criptomonedas. Las entidades institucionales, en particular, prefieren obtener exposición a través de ellos.

Desde su llegada, estos vehículos de inversión han ganado popularidad rápidamente al aprovechar esta demanda de los inversores tradicionales y se han establecido como uno de los pilares del sector.

A continuación se muestra un gráfico que muestra cómo han cambiado los flujos netos a 30 días relacionados con los ETF spot de Bitcoin y Ethereum durante su existencia hasta ahora.
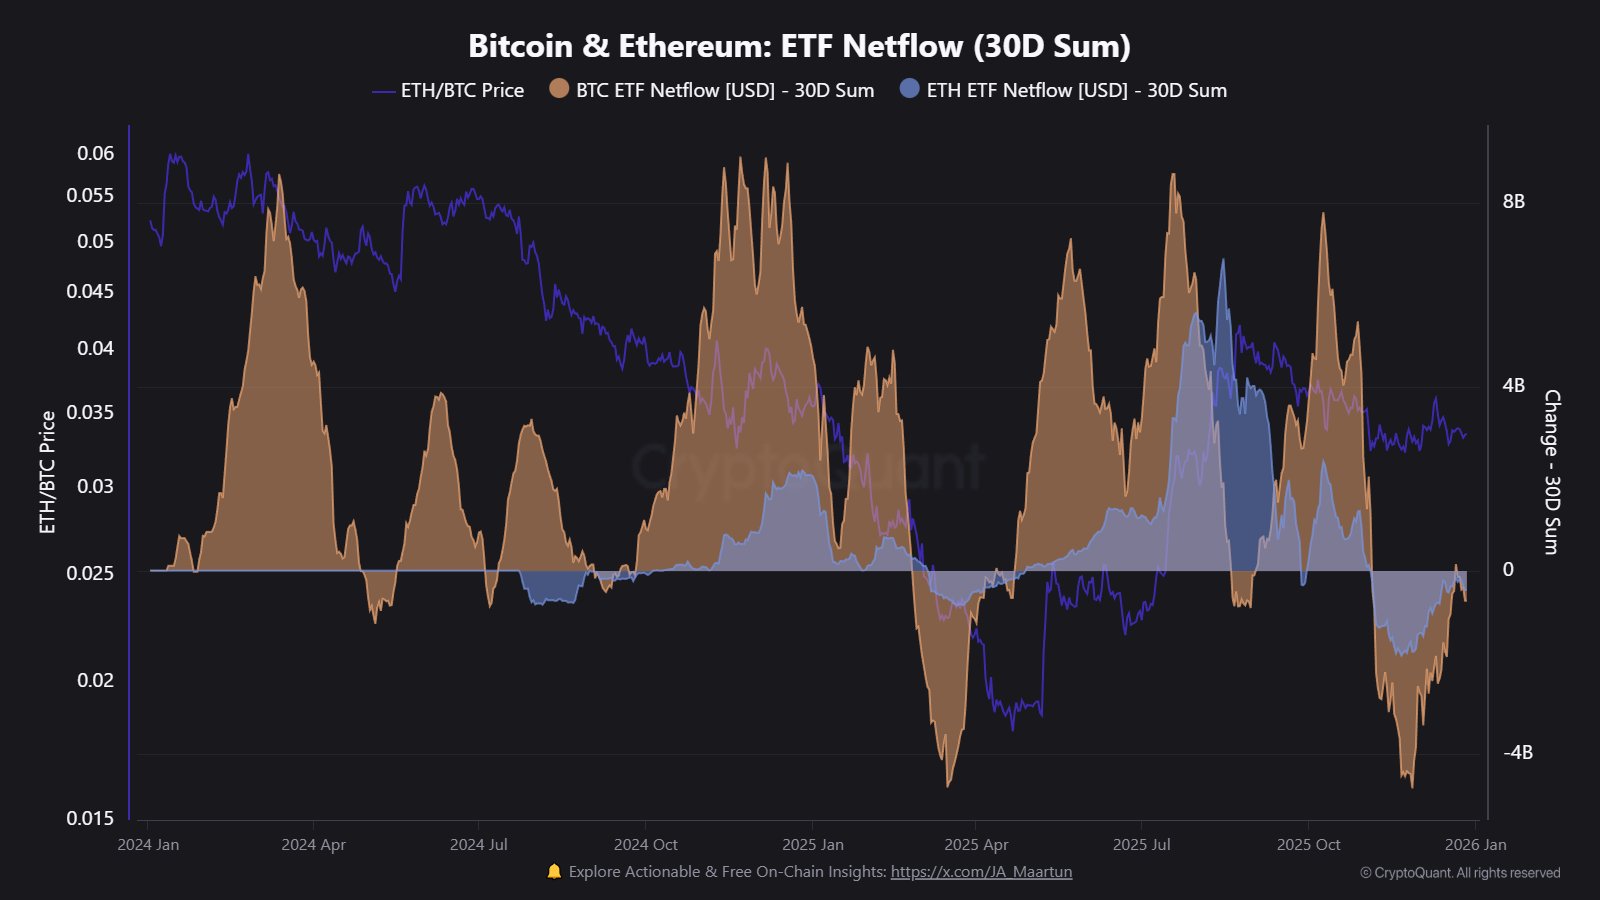
Parece que el valor del indicador ha sido negativo para ambos activos en las últimas semanas | Fuente: @JA_Maartun en X

Como es visible en el gráfico, el flujo neto de ETF spot a 30 días ha sido negativo tanto para Bitcoin como para Ethereum desde hace un tiempo, lo que sugiere que los fondos han estado experimentando salidas netas sostenidas.

La situación ha mejorado un poco más recientemente, pero el indicador sigue en rojo para ambos activos, situándose en -$656 millones para BTC y -$422 millones para ETH. La débil demanda en el mercado es similar a la fase de salidas de fondos de la primera mitad de 2025.

En aquel entonces, la demanda finalmente hizo un retorno explosivo, con Bitcoin y Ethereum experimentando fuertes subidas de precios. Ahora queda por ver si ocurrirá un regreso esta vez o si la desaceleración de la demanda se mantendrá por ahora.

Otra fuente de demanda relativamente reciente en el mercado son las tesorerías de activos digitales. Como destacó el proveedor de soluciones DeFi institucionales Sentora en una nueva publicación en X, las tenencias de las tesorerías de criptomonedas ahora superan los $185 mil millones en 368 entidades.
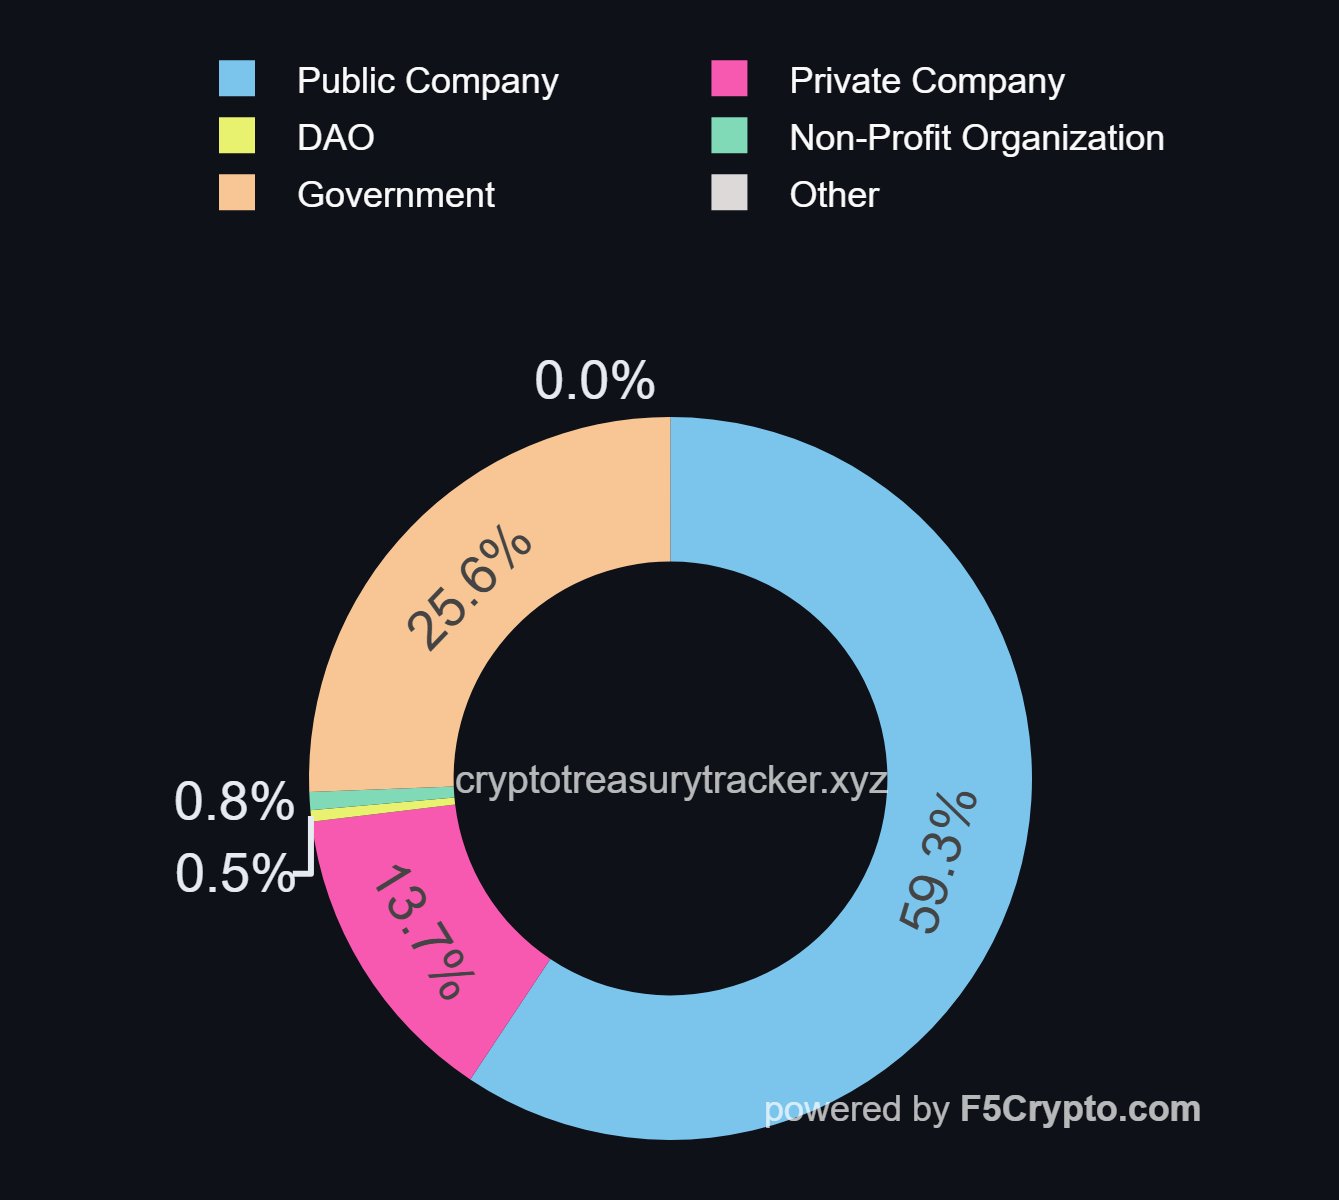
El desglose de las tesorerías en varios sectores | Fuente: Sentora en X

De esta cantidad, el 73% de las tesorerías de activos digitales están controladas por empresas, mientras que el resto está en manos de gobiernos.

Precio de BTC

Al momento de escribir, Bitcoin se negocia alrededor de $88,100, sin cambios desde la semana pasada.

El precio de la moneda parece haber estado consolidándose recientemente | Fuente: BTCUSDT en TradingView


Criptos en tendencia

Preguntas relacionadas

Q¿Qué indican los flujos netos negativos de los ETF de Bitcoin y Ethereum en los últimos 30 días?

ALos flujos netos negativos indican que el capital ha estado saliendo de estos activos digitales, lo que sugiere una disminución en la demanda de los ETF en el corto plazo.

Q¿Cuándo fueron aprobados los ETF spot de Bitcoin y Ethereum por la SEC en Estados Unidos?

ALos ETF spot de Bitcoin fueron aprobados en enero de 2024, mientras que los de Ethereum obtuvieron la aprobación en julio de 2024.

Q¿A cuánto ascienden actualmente los flujos netos negativos de BTC y ETH según el artículo?

ALos flujos netos negativos son de -656 millones de dólares para Bitcoin y -422 millones de dólares para Ethereum.

Q¿Qué similitud menciona el artículo entre la situación actual y la primera mitad de 2025?

ALa débil demanda actual es similar a la fase de salidas de capitales de la primera mitad de 2025, que luego fue seguida por una recuperación explosiva de los precios.

Q¿Qué otro fenómeno reciente de demanda en el mercado de criptoactivos se destaca además de los ETF?

ASe destaca el crecimiento de las tesorerías de activos digitales, que actualmente superan los 185 mil millones de dólares en manos de 368 entidades, principalmente empresas y gobiernos.

Lecturas Relacionadas

Sevenfold Oversubscription, Can SK Hynix Save the Semiconductor Industry This Time?

SK Hynix's planned US ADR listing is drawing intense interest, with its offering reportedly oversubscribed by over seven times, potentially making it the largest foreign listing in US history. The fundraising of approximately $24.5 billion is intended for expanding its Korean production capacity, including advanced packaging and EUV equipment. This massive demand from long-term funds and prominent institutions like Baillie Gifford and Situational Awareness Partners (led by noted investor Leopold Aschenbrenner) presents a stark contrast to the recent downturn in the broader semiconductor sector. The sector has faced a significant correction, with SK Hynix's own stock falling nearly 30% from its June high. This sell-off was triggered by concerns that major tech giants might slow their AI infrastructure spending, following signals like Meta's reported plan to sell surplus computing capacity. The strong ADR appetite suggests long-term investors still believe in the AI investment cycle's fundamentals, viewing the recent decline more as a valuation reset than a demand collapse. Some market speculation even suggests the pre-IPO price drop could be strategic, setting the stage for a stronger post-listing performance. While SK Hynix's successful listing may act as a short-term positive catalyst for market sentiment, the article argues the true signal for a sustained semiconductor recovery will come from upcoming earnings reports of tech giants like Microsoft, Google, Meta, and Amazon. Their future capital expenditure plans will be crucial in determining whether the AI-driven growth cycle can continue.

Odaily星球日报Hace 16 min(s)

Sevenfold Oversubscription, Can SK Hynix Save the Semiconductor Industry This Time?

Odaily星球日报Hace 16 min(s)

Breaking News: Musk Delivers the Most Powerful Grok 4.5, Slashes Price of Top-tier Opus Intelligence Drastically

**Elon Musk Launches Grok 4.5: A Cost-Effective, High-Performance AI Rival** SpaceXAI, in collaboration with Cursor, has released Grok 4.5, its new flagship AI model designed specifically for coding and agentic tasks. Trained on tens of thousands of NVIDIA GB300 GPUs using massive, high-quality data filtered from trillions of Cursor developer interactions, the model emphasizes "per-token intelligence." In benchmark performance, Grok 4.5 is highly competitive. It scores 64.7% on SWE Bench Pro (surpassing GPT-5.5's 58.6% and Opus 4.7's 64.3%), 83.3% on Terminal Bench 2.1 (nearly matching GPT-5.5), and 62.0% on DeepSWE 1.0 (beating Opus 4.8). Overall, it ranks fourth in AAAI official tests and first in the Harvey legal agent benchmark. The model's key advantage is its combination of speed, efficiency, and low cost. It generates responses at 80 tokens per second and, crucially, uses far fewer tokens to complete tasks—4.2 times fewer than Opus 4.8 on SWE Bench Pro. It is priced at $2 per million input tokens and $6 per million output tokens, significantly undercutting competitors. Musk stated it is "roughly equivalent to Opus 4.7, but much faster." Early user tests show Grok 4.5 can generate functional code for applications like 3D solar system simulators and basic games from simple prompts, though some note it still lags behind top models in certain creative tasks. Musk has hinted at a major update next month, leveraging real-world engineering data from his companies, with an even larger 2-trillion parameter version reportedly in development. Grok 4.5 positions itself not as the absolute strongest model, but as a highly efficient and affordable alternative in the top tier.

marsbitHace 20 min(s)

Breaking News: Musk Delivers the Most Powerful Grok 4.5, Slashes Price of Top-tier Opus Intelligence Drastically

marsbitHace 20 min(s)

Today, The Hong Kong Exchange Was Once Again Overwhelmed

Hong Kong's stock exchange witnessed an exceptionally busy day on July 9, with a record seven companies conducting initial public offerings (IPOs) simultaneously. The list included major firms such as Luxshare Precision, which launched the largest Hong Kong IPO of the year, and other notable names like Tri-Ring Group and Qiyunshan Food. However, the market reception was sharply divided on the first trading day. While Qiyunshan Food's shares surged over 110%, several other newcomers, including Luxshare Precision, Dingtai High-Tech, and Rigol Technologies, opened below their issue prices, with some falling nearly 20%. This event highlights a broader, bustling IPO scene in Hong Kong for 2024, with 82 Chinese companies listing in the first half alone—more than double the figure from the same period last year. A significant portion of this activity comes from dual "A+H" listings, where mainland China-listed firms seek secondary listings in Hong Kong. These larger companies have accounted for nearly 60% of total fundraising. Despite the high volume, recent trends show a cooling market sentiment for many new listings. Several IPOs in early July, including that of Tongrentang Healthcare, debuted with significant losses, indicating increased investor caution and selectivity. The market narrative is shifting, with capital increasingly concentrating on high-growth sectors like artificial intelligence, robotics, and semiconductors, while traditional manufacturing and consumer goods face greater pressure and volatility. This divergence underscores a market where success is no longer guaranteed by merely listing, but depends heavily on a company's growth prospects and sector appeal.

marsbitHace 24 min(s)

Today, The Hong Kong Exchange Was Once Again Overwhelmed

marsbitHace 24 min(s)

Glassnode: Crypto Market Enters Later Stages of Bottoming Phase

Glassnode: Crypto Market Enters Later Stages of Bottom Formation Bitcoin has traded below the true market average and the short-term holder cost basis for five consecutive months, indicating a deep undervaluation. On-chain data reveals a significant shift in selling pressure, with long-term holders now accounting for 43% of all realized losses. Daily realized losses for this group recently peaked at $280 million, the highest level since December 2022. While this large-scale capitulation is a hallmark of bear market bottoms, a sustained decline in this metric is a prerequisite for a sustained recovery. Institutional demand remains weak. US spot Bitcoin ETFs continue to see monthly net outflows, although the pace has moderated from June's peak. Furthermore, average daily ETF trading volumes have contracted by approximately 80% from their October 2025 peak, reflecting subdued institutional participation. Derivatives markets present a mixed picture. Overall positioning has shifted to cautiously bullish, with the put/call ratio dropping to a yearly low. However, the options volatility skew remains elevated, signaling that traders are still paying a premium for downside protection. The spot price also trades below the gamma "max pain" level. In summary, multiple indicators suggest the market is in the later phases of a bottoming process, characterized by long-term holder capitulation and weak institutional inflows. However, key confirmation signals for a durable trend reversal—a sustained drop in long-term holder selling pressure, stabilization of ETF flows, and a price recovery above key cost bases—are still pending.

Foresight NewsHace 51 min(s)

Glassnode: Crypto Market Enters Later Stages of Bottoming Phase

Foresight NewsHace 51 min(s)

Trading

Spot

Artículos destacados

Cómo comprar RED

¡Bienvenido a HTX.com! Hemos hecho que comprar RedStone (RED) sea simple y conveniente. Sigue nuestra guía paso a paso para iniciar tu viaje de criptos.Paso 1: crea tu cuenta HTXUtiliza tu correo electrónico o número de teléfono para registrarte y obtener una cuenta gratuita en HTX. Experimenta un proceso de registro sin complicaciones y desbloquea todas las funciones.Obtener mi cuentaPaso 2: ve a Comprar cripto y elige tu método de pagoTarjeta de crédito/débito: usa tu Visa o Mastercard para comprar RedStone (RED) al instante.Saldo: utiliza fondos del saldo de tu cuenta HTX para tradear sin problemas.Terceros: hemos agregado métodos de pago populares como Google Pay y Apple Pay para mejorar la comodidad.P2P: tradear directamente con otros usuarios en HTX.Over-the-Counter (OTC): ofrecemos servicios personalizados y tipos de cambio competitivos para los traders.Paso 3: guarda tu RedStone (RED)Después de comprar tu RedStone (RED), guárdalo en tu cuenta HTX. Alternativamente, puedes enviarlo a otro lugar mediante transferencia blockchain o utilizarlo para tradear otras criptomonedas.Paso 4: tradear RedStone (RED)Tradear fácilmente con RedStone (RED) en HTX's mercado spot. Simplemente accede a tu cuenta, selecciona tu par de trading, ejecuta tus trades y monitorea en tiempo real. Ofrecemos una experiencia fácil de usar tanto para principiantes como para traders experimentados.

406 Vistas totalesPublicado en 2025.03.05Actualizado en 2026.06.02

Cómo comprar RED

Discusiones

Bienvenido a la comunidad de HTX. Aquí puedes mantenerte informado sobre los últimos desarrollos de la plataforma y acceder a análisis profesionales del mercado. A continuación se presentan las opiniones de los usuarios sobre el precio de RED (RED).

活动图片