December 17: BTC, ETH, SOL, PTB, IR Market Analysis

金色财经Publicado a 2025-12-17Actualizado a 2025-12-17

Resumen

On December 17, the market analysis covers BTC, ETH, SOL, PTB, and IR amid mixed economic signals. Non-farm data showed both positive and negative impacts, with Wall Street focused on January data for potential rate cuts. BTC remains weak on the 4-hour chart with no clear support. It broke below the trendline with a bearish MACD cross, suggesting further downside. Key support levels are identified at 77,250–78,800 for initial entry, and 74,600–75,000 if 77,000 is breached. ETH is in a correction phase, with MACD nearing zero and potential for accelerated decline. Key supports are at 2,228 and 2,112, with 2,752–2,680 as a possible short-term rebound zone. SOL is trading between Bollinger Bands with supports at 114–102. A break below 100 could lead to a drop toward 86–85. PTB is considered highly risky due to extreme volatility and low trading reliability, often resulting in significant losses. IR has a total supply of 1 billion tokens with initial circulation of 20.5% at a price of $0.1. While it has strong backing and previous protocol revenue, current metrics show decline. Tokenomics are unclear, and cautious approach is advised. Overall, the market suggests waiting for clearer signals post-BoJ decision on the 19th, with strategic entries at key support levels.

Last night, one piece of non-farm payroll data was positive while another was negative, effectively canceling each other out. Wall Street is currently focused on January's data, as it relates to whether there will be a rate cut in January. After the non-farm data was released last night, the prediction market saw a slight increase in expectations for a January rate cut, but the magnitude was not significant.

Bitcoin has continued to weaken and adjust over the past 4 hours, with no clear signals of a halt in the decline or support being found. We will wait until the 19th, after the Bank of Japan's rate hike, to see the market's reaction.

BTC

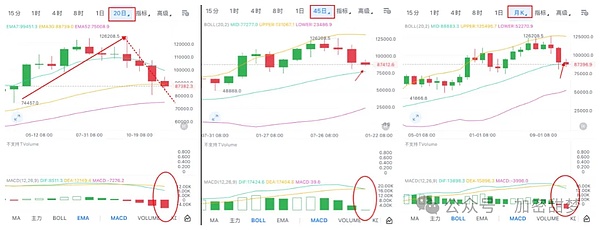
From a daily chart perspective, BTC has broken below the trend line, and the MACD has formed a death cross, indicating potential for further decline. The daily chart still shows a bearish pattern, so it is advisable to go short at resistance levels.

The monthly Bollinger Band mid-line at 88,800 was breached this week and has now turned into resistance. Therefore, we are now looking at the 45-day Bollinger Band mid-line, which corresponds to 77,250. This month, consider entering a small long position in the range of 78,800–77,250.

The 20-day chart shows a rounding top formation, with downward momentum strengthening. Its support points are the Bollinger lower band at 80,250 and the EMA52 (around 75,000). If the price breaks below 77,000, the key accumulation range for this decline will be 75,000–74,600.
ETH

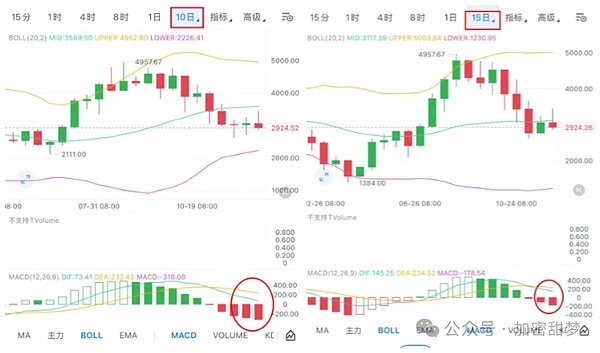
Currently in a 10–15 day correction phase within a monthly adjustment cycle. The 10-day correction is not yet over, and the MACD fast line is about to hit zero, which could accelerate the decline when it reaches the zero axis. The EMA7/30/52 have all been broken, with only the Bollinger lower band at 2,228 providing short-term support.

The 20-day chart has formed a death cross and is now on a 5-day losing streak, with the price slightly below the mid-band and far from the lower band. The primary support is the EMA52 (2,752). If this breaks, the low could test the June low of 2,112 (indicating a proportional correction and the end of the right-side adjustment). The monthly mid-band has been broken, but the lower band at 1,620 is too far to be effective. The effective support is the EMA52 (2,508).

The阶段性 bottom range for this phase: 2,222–2,112. The range of 2,752–2,680 offers some support and could serve as a short-term accumulation zone if there are no major negative catalysts causing an extreme drop.
SOL

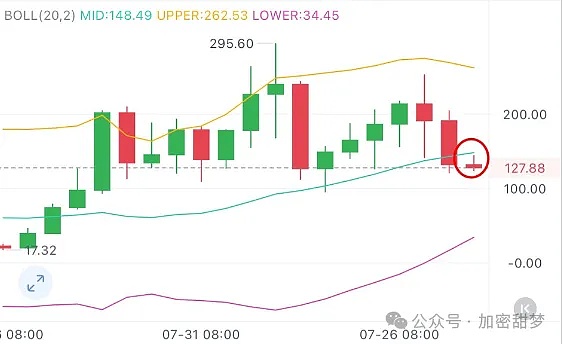
Currently trading between the 10, 15, 20-day and monthly Bollinger mid and lower bands. Their lower bands are all in the range of 114–102, which can serve as one reference for accumulation.

All the 10, 15, 20-day EMA7-30 have been broken, offering no support.

The monthly EMA52 is at 109.5. Therefore, the accumulation range before the 100 level is broken is 114–102.

Considering extreme scenarios where a sharp spike might briefly break below 100, the levels after a false break of 100 would be 96.25–95.65. A break below 95 would be considered a real break, and the price could then fall to around 86.25–84.85.
PTB

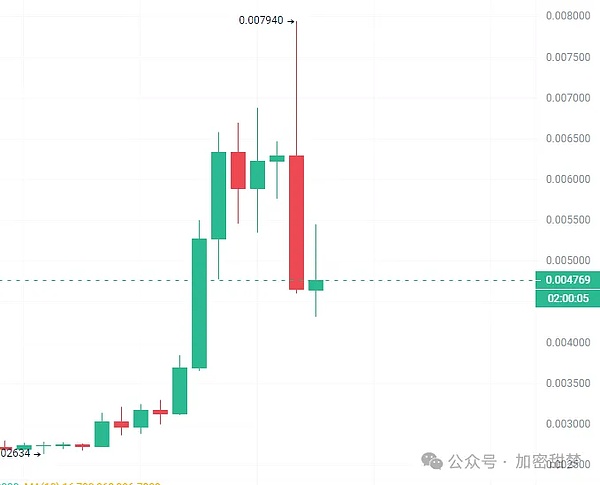
PTB is a token I wouldn't dare touch. It's like a single-player coin—going long or short is risky, and the risk-reward ratio is very low. You might get a quick profit if you're fast, but if you're slow, you'll get hit. In short, greed will eventually lead to losses. It can pump quickly and then drop over 40% in a single spike.
IR

Total supply: 1 billion, initial circulating supply: 20.5%, pool price: 0.1

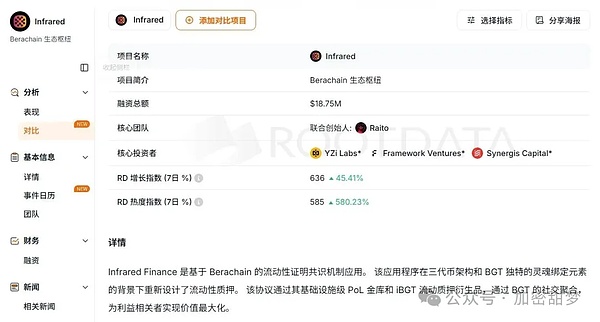
Pros: 1. Strong funding background—invested by Yzi Lab, co-founder of Bera. 2. Protocol revenue this year exceeded $8 million, TVL is still 210M. 3. Pool price is not expensive at 0.1, 100M. 4. Airdrop is on CEX, and participants say the airdrop is small.

Cons: 1. Protocol revenue has been declining due to the bear market—it peaked but didn't launch a token then, and is doing so now. Peak monthly revenue was $2.81 million in March, but this month it's only around $10,000 so far. 2. Tokenomics haven't been announced, and there's little community discussion.

The project's only chance is to accumulate筹码 during the sell-off, then counter-screw the community to achieve control, fully secure contract positions, and make a profit through contracts. Otherwise, there's basically no opportunity. Not planning to buy at open, will wait for the sell-off to stabilize. With the赚钱效应 of previous projects, market attention is returning to ALPHA, and recent projects have started harvesting. Better to be cautious.
If you find our content helpful, please share our public account with your friends! Welcome to follow and stay tuned for the latest updates in the crypto space! Every sharp decline is followed by vast opportunities. If you're feeling lost about planning for the next market phase, follow Tianmeng. Contact WeChat: RFGH8689


Criptos en tendencia

Preguntas relacionadas

QWhat is the current technical outlook for Bitcoin (BTC) according to the daily chart analysis?

AThe daily chart shows BTC has broken below the trend line with a MACD death cross, indicating a bearish outlook and potential for further decline. The analysis suggests selling at resistance levels.

QWhat are the identified support levels for Ethereum (ETH) in its current correction phase?

AKey support levels for ETH include the 20-day Bollinger lower band at 2228, the EMA52 on the 20-day chart at 2752, and the June low of 2112. The EMA52 on the monthly chart at 2508 is also noted as effective support.

QWhat is the suggested buying range for Solana (SOL) before the $100 level is broken?

AThe suggested buying range for SOL before the $100 level is broken is between 114 and 102, which corresponds to the lower Bollinger bands on the 10, 15, and 20-day charts.

QWhy does the analysis advise caution with the PTB token?

AThe analysis advises extreme caution with PTB because it behaves like a single-coin token, where both long and short positions are risky. It is prone to sharp, sudden drops of over 40%, making it a low性价比 (cost-performance) asset.

QWhat are the main bullish and bearish factors mentioned for the IR token launch?

ABullish factors: Strong funding background from Yzi Lab and Bera's co-founder, $8M+ protocol revenue this year, $210M TVL, and a low pool price of $0.1. Bearish factors: Declining protocol revenue (from $2.81M peak in March to just over $10K currently), no published tokenomics, and low community discussion.

Lecturas Relacionadas

Breaking: Google Earth Urgently Pulls Back Nano Banana 2 Image Generation Feature!

Google Earth's newly launched "Create image" feature, powered by the Nano Banana 2 AI image generation model, was abruptly withdrawn shortly after its release due to being "played" by users. The feature allowed users to generate and overlay AI-created visuals directly onto real-world satellite and 3D maps in Google Earth. The tool enabled creative applications like historical recreations (e.g., visualizing ancient Pompeii), generating informational graphics for landmarks, and envisioning architectural projects or futuristic cityscapes on real terrain. It operated under "geospatial grounding," meaning the AI respected the underlying geography, topography, and perspective of the chosen map view. The model also integrated with Gemini to retrieve relevant factual information. However, upon release, users quickly tested its limits. A prominent example involved reimagining Philadelphia's historic Independence Hall as a post-apocalyptic ruin overrun by "happy" zombies, evil clowns, and giant alien mechs. This highlighted both the feature's playful potential and its risks regarding the generation of inappropriate or misleading content on realistic maps, leading to its swift temporary removal. Google stated it would re-release the feature after implementing "enhanced guardrails." Analysts note this move strategically leverages Google's vast proprietary geospatial data, positioning its AI not just for artistic generation but for spatially accurate world visualization—a unique advantage in the competitive AI image generation landscape.

marsbitHace 1 hora(s)

Breaking: Google Earth Urgently Pulls Back Nano Banana 2 Image Generation Feature!

marsbitHace 1 hora(s)

Altman Admits: Overestimated AI Snatching Jobs! Huang Renxun: The Unemployment Narrative Is Completely Backwards

Sam Altman has revised his earlier predictions about AI rapidly replacing jobs, admitting he overestimated the speed at which AI would eliminate entry-level white-collar roles. Speaking on the "Invest Like the Best" podcast, he stated that people do not truly want an AI CEO, as accountability and human connection remain critical. He found that individuals prefer interacting with people who can be held responsible for decisions. Similarly, NVIDIA's Jensen Huang argued that the narrative of AI destroying jobs is misguided. He distinguishes between tasks and jobs, noting that while AI can automate specific tasks, entire jobs—encompassing communication, judgment, coordination, and accountability—are not eliminated. He cited examples like radiologists and software engineers, where demand for these roles has increased as AI handles repetitive tasks, allowing for business expansion and the creation of more positions. Data from a University of Maryland and LinkUp study supports this, showing that U.S. job postings for new graduates have actually risen, countering the fear of vanishing entry-level roles. However, a significant shift is occurring: the traditional entry-level tasks that help newcomers gain experience are being automated, making initial career access more challenging. The key insight is that as AI takes over standardized tasks, the enduring value of human work shifts toward areas of responsibility, trust-building, and final decision-making—aspects that AI cannot replicate. The real "moat" for professionals lies in these irreplaceable human elements.

marsbitHace 1 hora(s)

Altman Admits: Overestimated AI Snatching Jobs! Huang Renxun: The Unemployment Narrative Is Completely Backwards

marsbitHace 1 hora(s)

Weekly Editor's Picks (0725-0731)

Weekly Editor's Picks (0725-0731) provides a curated selection of deep analysis, filtering out market noise. Key themes from this week include: **Macro & Policy:** The Federal Reserve's upcoming meeting is marked by high uncertainty, balancing cooling inflation data against persistent price pressures. Meanwhile, the U.S. crypto regulatory Clarity Act faces critical political hurdles, with its 2026 passage probability seen as low. **Investing & Crypto:** Analysis suggests long-term crypto success depends on conviction through volatile cycles, focusing on assets like Bitcoin and core smart contract platforms. A trend noted is the increasing similarity between global equity markets (especially tech) and crypto, driven by narrative and leverage. Several major crypto protocols show strong revenue growth, but this isn't always translating to token price appreciation due to sell pressure and structural factors. **AI & Semiconductors:** Nvidia's rising credit default swap rates signal market concern over AI infrastructure financing risks. The storage sector experienced volatility as markets began pricing in potential 2027 oversupply. Despite a record profitable quarter, SK Hynix's results were deemed "below expectations," reflecting heightened investor demands for future growth visibility. **Markets & DeFi:** TradeXYZ demonstrated remarkable accuracy in pre-market pricing for a major A股 listing. The token ONDO saw gains, linked to its growing role in the on-chain tokenized stock ecosystem. **Ethereum:** Post-Pectra upgrade, a major structural shift is underway as Lido begins migrating millions of ETH to new validator architectures designed for capital efficiency. **Also Highlighted:** Butian's bullish stock market move; OpenAI's Altman promising major advances; Samsung and SK Hynix securing large AI chip deals; Apple reaching a $5T market cap; and ongoing discussions around exchange security following Poolin's bankruptcy case.

marsbitHace 2 hora(s)

Weekly Editor's Picks (0725-0731)

marsbitHace 2 hora(s)

Low Investment Isn't Apple's Immunity Pass

While Meta and Google face investor scrutiny over ballooning AI capital expenditures, Apple's minimal AI investment has paradoxically become a strength. Its market cap recently reclaimed the global top spot, surpassing $5 trillion. The irony is deep: Apple's own AI efforts have lagged, with "Apple Intelligence" delayed and core talent lost, forcing reliance on partners like Google Gemini and Alibaba's Qianwen. Its Q3 FY2026 (Q2 CY) earnings initially seemed stellar. Revenue hit $109.4B (up 16% YoY), with iPhone and Mac sales, growing 22% and 29% respectively, driving most of the growth. However, the stock fell over 8% post-earnings. The primary concern was a weaker Q4 revenue growth forecast of 9-11%, below expectations, due to looming supply chain constraints. Apple is feeling the indirect cost of the AI boom. Soaring memory and chip prices, fueled by massive data center investments from Microsoft, Amazon, and others, are forcing Apple to raise Mac and iPad prices significantly. The upcoming iPhone launch is also expected to see substantial price hikes. Despite avoiding heavy AI infrastructure spending—its capital expenditures are actually down 28%—Apple cannot escape the industry-wide supply and cost pressures. While Apple's operating cash flow remains robust, its substantial R&D spending (up 32% YoY) has yet to yield major AI breakthroughs. As Tim Cook prepares to step down as CEO, Apple faces a challenging transition: balancing its premium hardware success against the strategic and cost pressures of the AI era it has so far cautiously navigated.

marsbitHace 3 hora(s)

Low Investment Isn't Apple's Immunity Pass

marsbitHace 3 hora(s)

Trading

Spot

Artículos destacados

Cómo comprar IR

¡Bienvenido a HTX.com! Hemos hecho que comprar Infrared Finance (IR) sea simple y conveniente. Sigue nuestra guía paso a paso para iniciar tu viaje de criptos.Paso 1: crea tu cuenta HTXUtiliza tu correo electrónico o número de teléfono para registrarte y obtener una cuenta gratuita en HTX. Experimenta un proceso de registro sin complicaciones y desbloquea todas las funciones.Obtener mi cuentaPaso 2: ve a Comprar cripto y elige tu método de pagoTarjeta de crédito/débito: usa tu Visa o Mastercard para comprar Infrared Finance (IR) al instante.Saldo: utiliza fondos del saldo de tu cuenta HTX para tradear sin problemas.Terceros: hemos agregado métodos de pago populares como Google Pay y Apple Pay para mejorar la comodidad.P2P: tradear directamente con otros usuarios en HTX.Over-the-Counter (OTC): ofrecemos servicios personalizados y tipos de cambio competitivos para los traders.Paso 3: guarda tu Infrared Finance (IR)Después de comprar tu Infrared Finance (IR), guárdalo en tu cuenta HTX. Alternativamente, puedes enviarlo a otro lugar mediante transferencia blockchain o utilizarlo para tradear otras criptomonedas.Paso 4: tradear Infrared Finance (IR)Tradear fácilmente con Infrared Finance (IR) en HTX's mercado spot. Simplemente accede a tu cuenta, selecciona tu par de trading, ejecuta tus trades y monitorea en tiempo real. Ofrecemos una experiencia fácil de usar tanto para principiantes como para traders experimentados.

548 Vistas totalesPublicado en 2025.12.17Actualizado en 2026.06.02

Cómo comprar IR

Discusiones

Bienvenido a la comunidad de HTX. Aquí puedes mantenerte informado sobre los últimos desarrollos de la plataforma y acceder a análisis profesionales del mercado. A continuación se presentan las opiniones de los usuarios sobre el precio de IR (IR).

活动图片