Crypto Analyst Predicts Bitcoin (BTC) Triples in Price Based on One Metric – Here’s His Timeframe

Daily HodlPublicado a 2022-07-06Actualizado a 2022-07-06

Resumen

One crypto analyst is comparing Bitcoin’s price action to one traditional stock to predict what's...

One crypto analyst is comparing Bitcoin’s price action to one traditional stock to predict what’s next for BTC after a rocky last two months.

In a new strategy session, the anonymous host of InvestAnswers highlights automaker Tesla while telling his 442,000 YouTube subscribers about the significance of mean reversion, a metric that posits an asset’s price will eventually return to its long-term average.

“Let’s look at the pair. This is the Tesla-divided-by-Bitcoin pair, and you can see the price now is about 0.036. We are back at late 2020 levels. It’s like a big huge U.

Is mean reversion overdue? Looking at this chart, you’ll see the blue line, that’s the 200-day moving average. That’s about 0.024 and we’re currently trading at 0.036. While Tesla has remained flat over the last 12 months, Bitcoin has gotten clobbered down 70%.

That is where we are, that is the situation and that’s why there’s parallax like this.”

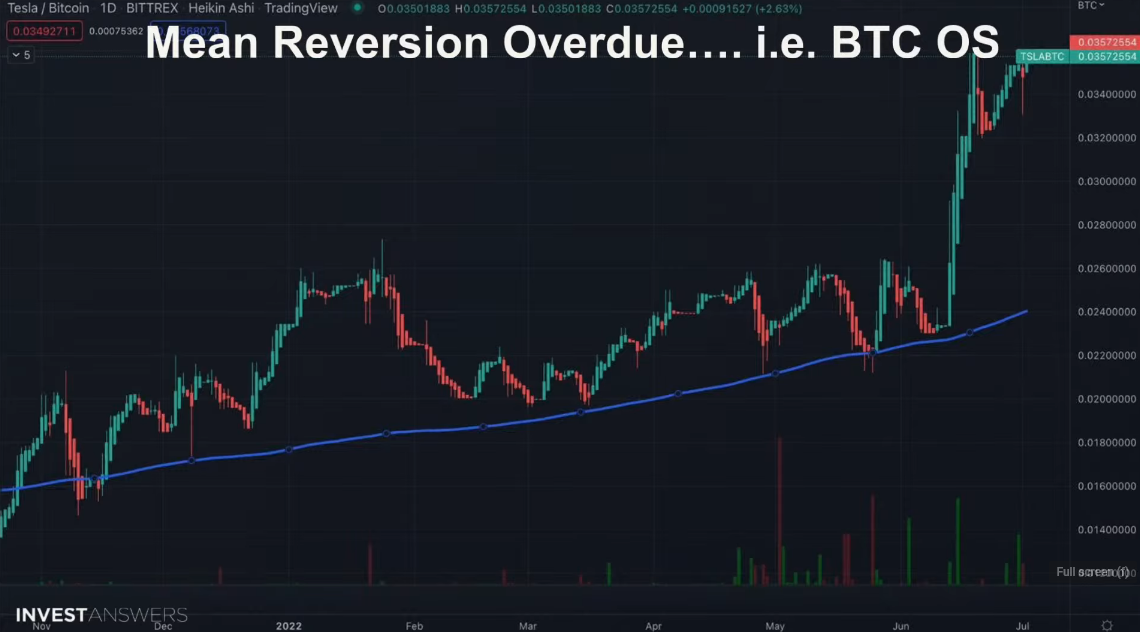
Source: InvestAnswers/YouTube

The analyst says most assets with true underlying utility and value will revert to their mean, which is why he expects both Tesla and Bitcoin to post rallies starting in about half a year.

“Short and succinct, not financial advice, of course, everything mean reverts unless it’s a piece of crap or it’s broken.

Tesla has held up well during the correction and recession incredibly well. While I believe Tesla will hit $1,200 in the next six to 12 months, which is slightly less than double, I also believe Bitcoin could potentially triple in the same timeframe. Six to 12 months, which takes out to summer 2023 and that’s very, very conservative.

The Tesla /Bitcoin pair right now is 0.036. [The] 200-day moving average is 0.024, so technically we are here. I do not expect the pair to go higher than this 0.036 level.”

Regarding Tesla’s future earnings, the chart guru mentions the company will incur a hefty on-paper loss for its current Bitcoin holdings.

“They’re going to get hit hard. They’re gonna have an impairment charge of maybe $450 million dollars. A lot of stuff is hitting them, but they had the worst quarter-over-quarter performance in over two years.

I think that pair will come down, and I think once the bids start coming back… it’s more likely that Bitcoin gets bought up at this level and Tesla could come down, so watch that level 0.036.”

At time of writing, Bitcoin is up 6.02% on the day and priced at $20,258.

Lecturas Relacionadas

Bitcoin Trading Strategy Breakdown: Celebrity Predictions and Classic Models All Fail, Only These Four Indicators Remain

Analysis of Bitcoin Trading Strategies: Why Celebrity Forecasts and Classic Models Fail, Leaving Only These Four Reliable Indicators This analysis examines the failure of common Bitcoin prediction methods and identifies four reliable indicators for constructing a trading strategy. The author reviewed all major BTC prediction approaches from 2017-2025, categorizing them into three groups: celebrity price targets (consistently over-optimistic), analytical models like Stock-to-Flow (broken post-2022), and on-chain signals. The key finding is that more data often creates confusion, not clarity. The strategy discards unreliable elements: celebrity predictions (incentivized to be extreme), pure models (invalidated by post-ETF market changes), and the Fear & Greed Index used alone (too many false signals). Four reliable indicators were selected: 1. **MVRV Z-Score:** Accurately identifies cycle bottoms when entering its green zone (e.g., 2018, 2020, 2022). Note: Its ability to call tops is now ineffective post-2024. 2. **SOPR (28-day MA):** Consistently signals bottoms when below 1.0, indicating holders are selling at a loss. 3. **ETF Net Flow:** A crucial post-2024 metric showing institutional momentum (e.g., sustained inflows = buying). 4. **Macro Liquidity (Fed policy & M2):** Sets the overall directional bias (e.g., bullish during easing cycles). The core strategy involves waiting for a multi-signal共振 (resonance). For example, a bottom signal requires MVRV in the green zone + SOPR < 1.0. A top signal requires overheated on-chain data + sustained ETF outflows. Macro policy sets the overall direction. The Fear & Greed Index is only used as a weighted confirmatory signal, never alone. Action is only taken when three or more indicators align. The author automated this into a monitoring system that sends Telegram alerts only when signals trigger. As of the article's date (April 15, 2026), the system showed a strong bottom signal: extreme fear (F&G=12), MVRV in the buy zone, and SOPR < 1.0. The only contrary signal was weak ETF flows. Historically, such triple on-chain共振 has preceded 100%+ returns. The conclusion emphasizes building a personal framework over relying on external predictions, allowing for iterative improvement and customization based on individual risk tolerance.

marsbitHace 13 min(s)

Bitcoin Trading Strategy Breakdown: Celebrity Predictions and Classic Models All Fail, Only These Four Indicators Remain

marsbitHace 13 min(s)

Trading

Spot
Futuros
活动图片