As Bitcoin [BTC] flashes green, is the worst finally behind it

AmbcryptoPublicado a 2022-07-05Actualizado a 2022-07-05

Resumen

On-chain data indicates that the worst might be over for Bitcoin as per acclaimed researchers. BTC has also seen a bullish uptick since 3 July, marking a good start to the month.

Bitcoin [BTC] investors have more reasons than one to be amused by the celebrations of 4 July. On-chain data indicates that the worst might be over for Bitcoin as per acclaimed researchers. BTC has also seen a bullish uptick since 3 July, marking a good start to the month.

A renewed optimism on the charts

Bitcoin supporters have good reasons to be optimistic after positive signs on the network. A recent Santiment tweet suggested a positive uptick in longs on exchanges in the early hours of 4 July. The tweet further claims that trader optimism is usually high on holidays. It also raises caution as whales may attempt to “punish the overly eager”.
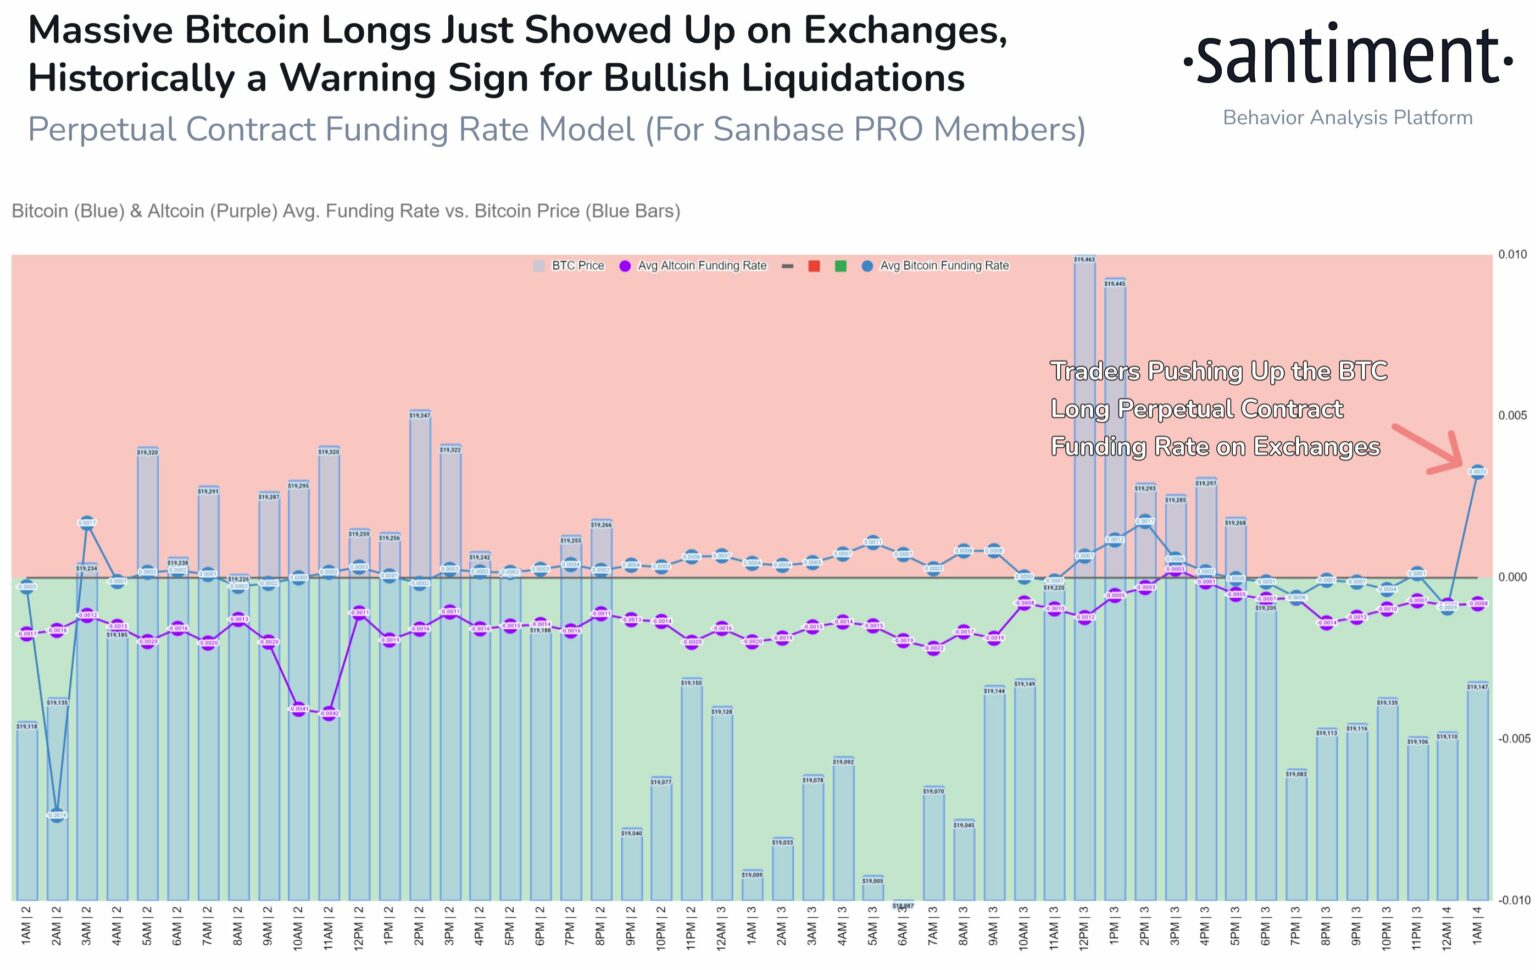
Source: Santiment

Crypto analyst Ali Martinez further posted his analysis suggesting the worst is probably over for Bitcoin. He used the Santiment MVRV (365d) metric which timed the previous market bottoms in two bearish cycles.

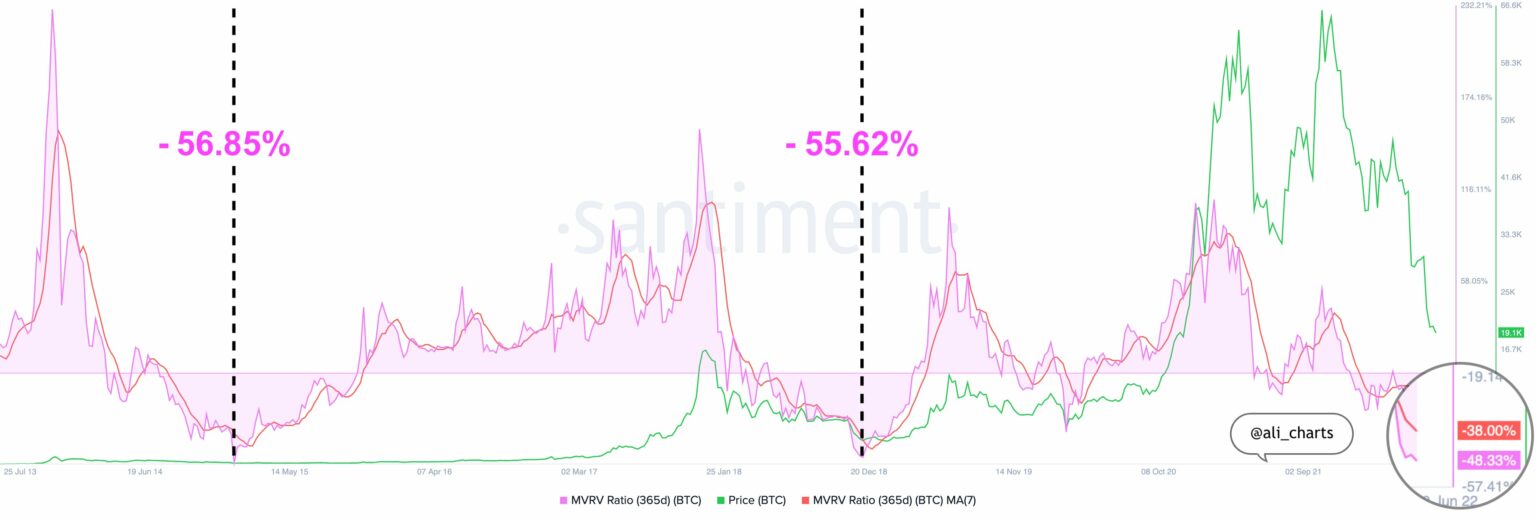
Source: Ali Martinez/ Santiment

During the January 2015 bear market, the MVRV metric hit -56.85% to mark the market bottom. And again in December 2018, it struck -55.62% flashing a bottom for the bear market. As of now, with the current bearish cycle in full swing, this value dropped to -50.09% in mid-June and currently sits at – 48.23%.

Can this ignite the bulls as we wrap the underwhelming Q2?

Let’s talk data!

Bitcoin is consolidating in the $18,000-$22,000 range as both bulls and bears are not sure of the trends of market volatility. Currently trading at $20,241, BTC was up by 5.7% in the last 24 hours. In its latest recovery attempt, Bitcoin is further aided by a near 50% hike in network volume. This is a healthy sign for Bitcoin as it battles on under difficult market conditions.

The MVRV ratio has also witnessed significant changes since mid-June. The value saw a gradual upturn during a late recovery in June. Despite a fall in prices of the king token and the volatility it has experienced, the MVRV ratio still stands in a good position.
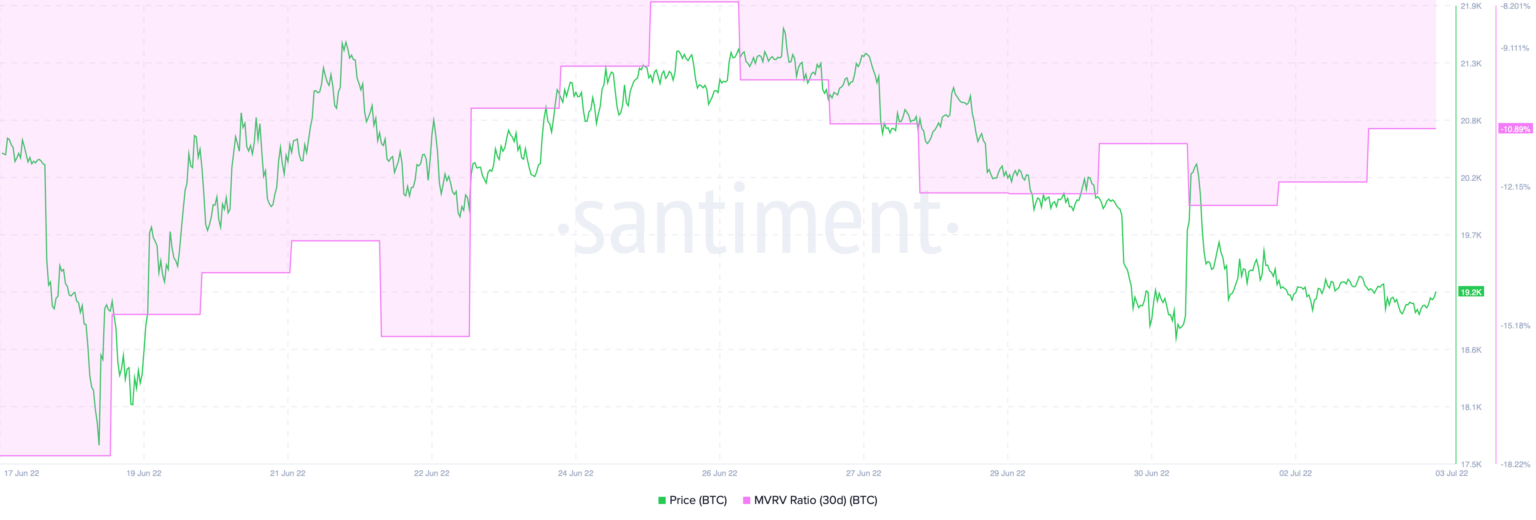
Source: Santiment

The Musk-BTC affair

Despite numbers showing some signs of recovery, Tesla wrapped up a disastrous Q2 on 30 June. With Elon Musk’s $1.5 billion Bitcoin investments, the CEO must have been reeling from his losses. Additionally, Musk’s move has so far not gone as per plan at least financially.

As the Telegraph reports, “Tesla is likely to record an impairment on its Bitcoin holdings of around $440m – equivalent to 9% of its annual profit last year – when it reports quarterly results later this month.”

Lecturas Relacionadas

Bitcoin Trading Strategy Breakdown: Celebrity Predictions and Classic Models All Fail, Only These Four Indicators Remain

Analysis of Bitcoin Trading Strategies: Why Celebrity Forecasts and Classic Models Fail, Leaving Only These Four Reliable Indicators This analysis examines the failure of common Bitcoin prediction methods and identifies four reliable indicators for constructing a trading strategy. The author reviewed all major BTC prediction approaches from 2017-2025, categorizing them into three groups: celebrity price targets (consistently over-optimistic), analytical models like Stock-to-Flow (broken post-2022), and on-chain signals. The key finding is that more data often creates confusion, not clarity. The strategy discards unreliable elements: celebrity predictions (incentivized to be extreme), pure models (invalidated by post-ETF market changes), and the Fear & Greed Index used alone (too many false signals). Four reliable indicators were selected: 1. **MVRV Z-Score:** Accurately identifies cycle bottoms when entering its green zone (e.g., 2018, 2020, 2022). Note: Its ability to call tops is now ineffective post-2024. 2. **SOPR (28-day MA):** Consistently signals bottoms when below 1.0, indicating holders are selling at a loss. 3. **ETF Net Flow:** A crucial post-2024 metric showing institutional momentum (e.g., sustained inflows = buying). 4. **Macro Liquidity (Fed policy & M2):** Sets the overall directional bias (e.g., bullish during easing cycles). The core strategy involves waiting for a multi-signal共振 (resonance). For example, a bottom signal requires MVRV in the green zone + SOPR < 1.0. A top signal requires overheated on-chain data + sustained ETF outflows. Macro policy sets the overall direction. The Fear & Greed Index is only used as a weighted confirmatory signal, never alone. Action is only taken when three or more indicators align. The author automated this into a monitoring system that sends Telegram alerts only when signals trigger. As of the article's date (April 15, 2026), the system showed a strong bottom signal: extreme fear (F&G=12), MVRV in the buy zone, and SOPR < 1.0. The only contrary signal was weak ETF flows. Historically, such triple on-chain共振 has preceded 100%+ returns. The conclusion emphasizes building a personal framework over relying on external predictions, allowing for iterative improvement and customization based on individual risk tolerance.

marsbitHace 33 min(s)

Bitcoin Trading Strategy Breakdown: Celebrity Predictions and Classic Models All Fail, Only These Four Indicators Remain

marsbitHace 33 min(s)

Trading

Spot
Futuros
活动图片