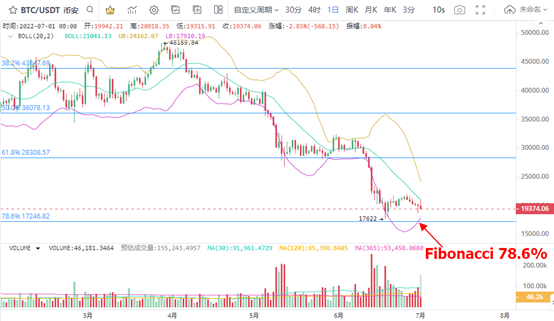
【重磅解读】BTC未确认交易低迷,主力抛压再现

火必研究院Publicado a 2022-07-01Actualizado a 2022-07-04

Resumen

BTC价格走势低迷,主力异动增多。

1、 BTC在酝酿加速变盘

BTC的日K线图中,连续多个交易日的下跌期间,逐步接近区间低位。目前来看,BTC依然在斐波那契78.6%对应的17246美元以上运行,只是行情走势较弱,主动买入投资者还能以拉升价格涨幅。因此,交易方面需要关注每一次的调整幅度。目前BTC日内振幅可达7.7%。低价区,还要关注可能的高强度波动可能性。

日内交易量方面,BTC交易量小幅度回升,没能达到近期峰值表现。交易量小幅回升到等量线上方,意味着投资者交易热度开始升温。
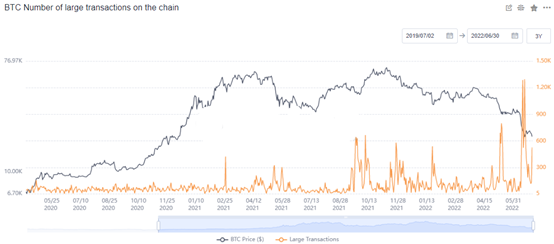
2、BTC主力抛压再现

数据显示, 6月18日BTC大额交易笔数可达1295笔。而目前,6月30日的大额交易笔数回升到了527笔,也为近期的数值高位。也就是说,主力活跃度依然回升,伴随着BTC波动强度随升,投资者的低吸交易信号再次出现。

主力大额交易笔数高于500枚BTC,527笔大额交易笔数折合成BTC的交易量为263500枚BTC。从2021年的9月份开始,BTC大额交易笔数频繁达到高位。本次大额交易笔数反弹,恰好是BTC在低价位的弱势运行阶段,不排除主力出货的可能性。
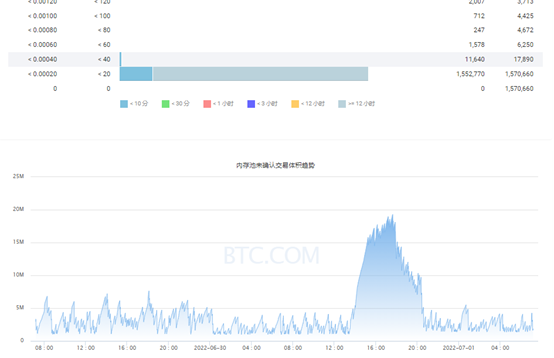
3、BTC未确认交易低位运行

BTC未确认交易低位运行,交易手续费多数处在低水平,意味着中小投资者占据了交易的多数席位。据此判断,近期BTC价格回撤的过程中,主力低吸买入的可能性不大。在经历了6月份的价格回撤以后,交易降温意味着行情继续表现得相对低迷,投资者可适当调整仓位应对价格颓势。
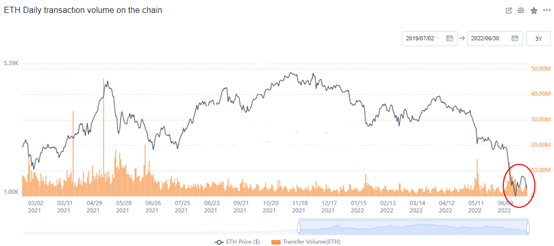
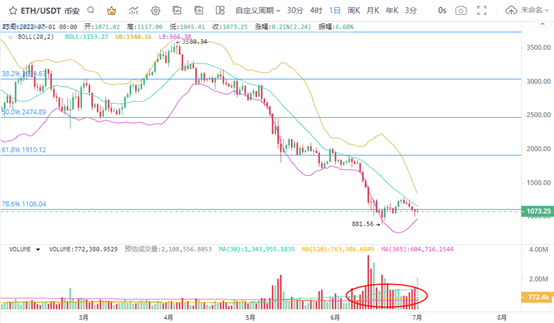
4、 ETH交易热度小幅回升

ETH的短线回撤继续小幅推升了交易量,价格短线反弹,关键支撑1106美元的价格表现较弱。由此判断,ETH若不能短线上涨,价格进行维持低位运行的可能性较大。斐波那契78.6%对应的1106美元正在逐步成为ETH的压力位。因此,买入ETH的交易动作可以向后推迟,以便获取更好的低吸成本。

5、ETH链上交易量反弹

ETH每日链上交易量近期虽然持续了增长,但是相比2021年中旬以前的量能较低。近期ETH的日内交易量维持在300万枚ETH以上。据此判断,行情处在一个比较典型的筹码大量转手阶段。结合ETH价格波动率较低,行情相对低迷,上涨的交易日比较有限。行情回调期间,低价区内交易机会较多,不排除行情持续再次回撤异动,拉升换手率的同时提示底部买入机会的可能性。

Lecturas Relacionadas

Bitcoin Trading Strategy Breakdown: Celebrity Predictions and Classic Models All Fail, Only These Four Indicators Remain

Analysis of Bitcoin Trading Strategies: Why Celebrity Forecasts and Classic Models Fail, Leaving Only These Four Reliable Indicators This analysis examines the failure of common Bitcoin prediction methods and identifies four reliable indicators for constructing a trading strategy. The author reviewed all major BTC prediction approaches from 2017-2025, categorizing them into three groups: celebrity price targets (consistently over-optimistic), analytical models like Stock-to-Flow (broken post-2022), and on-chain signals. The key finding is that more data often creates confusion, not clarity. The strategy discards unreliable elements: celebrity predictions (incentivized to be extreme), pure models (invalidated by post-ETF market changes), and the Fear & Greed Index used alone (too many false signals). Four reliable indicators were selected: 1. **MVRV Z-Score:** Accurately identifies cycle bottoms when entering its green zone (e.g., 2018, 2020, 2022). Note: Its ability to call tops is now ineffective post-2024. 2. **SOPR (28-day MA):** Consistently signals bottoms when below 1.0, indicating holders are selling at a loss. 3. **ETF Net Flow:** A crucial post-2024 metric showing institutional momentum (e.g., sustained inflows = buying). 4. **Macro Liquidity (Fed policy & M2):** Sets the overall directional bias (e.g., bullish during easing cycles). The core strategy involves waiting for a multi-signal共振 (resonance). For example, a bottom signal requires MVRV in the green zone + SOPR < 1.0. A top signal requires overheated on-chain data + sustained ETF outflows. Macro policy sets the overall direction. The Fear & Greed Index is only used as a weighted confirmatory signal, never alone. Action is only taken when three or more indicators align. The author automated this into a monitoring system that sends Telegram alerts only when signals trigger. As of the article's date (April 15, 2026), the system showed a strong bottom signal: extreme fear (F&G=12), MVRV in the buy zone, and SOPR < 1.0. The only contrary signal was weak ETF flows. Historically, such triple on-chain共振 has preceded 100%+ returns. The conclusion emphasizes building a personal framework over relying on external predictions, allowing for iterative improvement and customization based on individual risk tolerance.

marsbitHace 1 hora(s)

Bitcoin Trading Strategy Breakdown: Celebrity Predictions and Classic Models All Fail, Only These Four Indicators Remain

marsbitHace 1 hora(s)

Trading

Spot
Futuros
活动图片