Key Bitcoin price metrics say BTC bottomed, but traders still fear a drop to $10K

CointelegraphPublicado a 2022-06-29Actualizado a 2022-06-29

Resumen

On-chain and technical analysis indicators suggest BTC price may have bottomed, but several traders are still wary that BTC price could fall as low as $10,000 in the short-term.

The crypto market is currently going through a period of heightened volatility as global economic conditions continue to worsen amid a backdrop of rising inflation and interest rates.

As the headwinds impacting global financial markets beat down all traces of bullish sentiment, many crypto investors are predicting that Bitcoin (BTC) price could drop to as low as $10,000 before a market bottom is found.

BTC/USDT 1-day chart. Source: TradingView

While many traders scoffed at the idea of BTC falling below its 2017 all-time high, the recent dip to $17,600 suggests that this bear market could be different from the last one.

Here’s what several analysts are saying about the possibility of Bitcoin falling to $10,000 in the next few weeks.

Historic pullbacks point to a low at $10,350

Insight into how BTC may perform in the short-term can be gleaned by looking at its performance during the bear market cycles of 2013 and 2017. In 2013, the maximum drawdown for Bitcoin was 85%, which took place over a period of 407 days. The maximum drawdown in 2017 was 84% and this period lasted for 364 days.

Historical drawdowns for Bitcoin. Source: Arcane Research

According to a recent report by Arcane Research, the current drawdown has been going on for 229 days and has thus far seen a maximum drawdown of 73%.

Arcane Research said: “If Bitcoin follows the blueprint of these cycles, a bottom should occur sometime in late Q4 2022, at a price as low as $10,350.”

While there is always a chance that an 85% pullback is a possibility, Arcane Research also noted that “Bitcoin is now far more intertwined in the broad financial markets, with the Fed, US elections, crypto regulations, and stock market impacting its performance.”

Further evidence that supports the possibility of a drop to the $10,000 range was touched upon by cryptocurrency research firm Delphi Digital, who posted the following chart noting that “From a high timeframe market structure perspective, the next place we have to be looking at is $10K-$12K.”

Brave new coin index for Bitcoin (BLX) 1-month chart. Source: Delphi Digital

Based on the chart above, the high timeframe market structure support is likely to exist between $9,500 and $13,500.

Delphi Digital said: “Coincidentally, this area lines up with the implied low if BTC experiences an 85% drawdown from peak to trough.”

Would $10,000 be a good spot to go long?

Not every analyst expects a drop to $10,000. Take for example, Will Clemente of Blockware Solutions. According to Clemente, Bitcoin's current range reflects a good spot for accumulation.

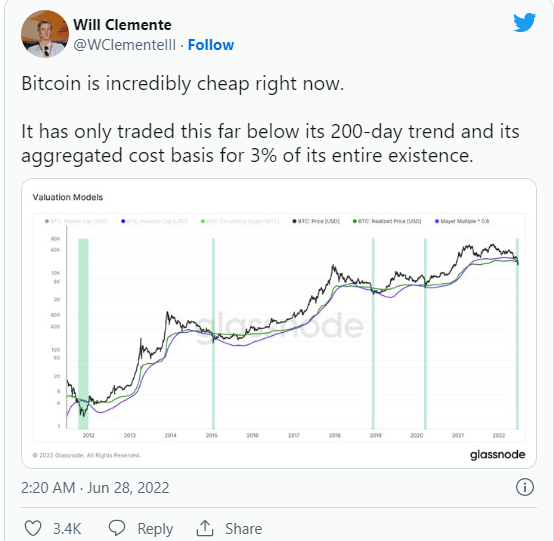
Additional data from Glassnode shows that Bitcoin’s 200-week moving average, balance price and delta price in its bear market floor model align with the 0.6 Mayer Multiple metric analyzed by Clemente.

Bitcoin bear market floor models. Source: Glassnode

Glassnode said: “Only 13 out of 4,360 trading days (0.2%) have ever seen similar circumstances, occurring in just two prior events, Jan 2015 and March 2020. These points are marked in green on the chart.”

Based on the Delta price metric which still remains untouched, the potential low for BTC is $15,750.

BTC/USD 1-month chart. Source: Twitter

John Bollinger, the creator of the popular Bollinger Bands trading indicator also suggested that Bitcoin price may have bottomed.

According to Bollinger: “Picture perfect double (M-type) top in BTCUSD on the monthly chart complete with confirmation by BandWidth and %b leads to a tag of the lower Bollinger Band. No sign of one yet, but this would be a logical place to put in a bottom.”

Lecturas Relacionadas

Microsoft Announces Commercial-Grade Quantum Computer to be Completed in Three Years: Will the Boots Land?

Microsoft announces plans to build a commercially viable quantum computer by 2029, a significant acceleration from the previous industry consensus of a decade. The breakthrough is fueled by their new Majorana 2 quantum chip, which boasts a record-breaking average qubit lifetime of 20 seconds—a 1,000-fold reliability improvement over its predecessor. This leap was achieved by leveraging topological qubits, a theoretically more stable technology using Majorana zero modes, and switching the core superconducting material from aluminum to lead. Crucially, Microsoft's "Discovery" agentic AI platform accelerated the R&D process. AI agents autonomously analyzed vast experimental data, optimized manufacturing parameters (like the lead alloy composition), and solved issues like "ghost noise," dramatically speeding up experimentation. While the 20-second coherence time is a landmark, challenges remain: scaling from 12 qubits to the millions needed for practical applications, managing compilation costs, and verifying quantum results. Skeptics call for peer-reviewed data, and questions persist about whether even 20 seconds is sufficient for complex algorithms like breaking RSA encryption. The race is on with other approaches (superconducting, trapped ions), but Microsoft's confidence in its topological roadmap signals a potential shortcut to a scalable quantum future.

marsbitHace 15 min(s)

Microsoft Announces Commercial-Grade Quantum Computer to be Completed in Three Years: Will the Boots Land?

marsbitHace 15 min(s)

Is There Really a "World Cup Curse" in the Market?

Is there really a "World Cup Curse" affecting markets? Historical data shows global equity markets often underperform during the tournament. The S&P 500 has averaged negative returns of -1.5% to -2.11% across 19 World Cups since 1950, with declines in 58% of events. China's Shanghai Composite fell in 71% of tournaments since 1994. Studies confirm reduced trading activity during matches, with volumes dropping significantly, especially when a home nation plays. A team's loss can also lead to negative sentiment and selling pressure in its domestic market the next day. However, the "curse" may be partly attributed to seasonal weakness. Many tournaments are held in June-July, a historically weaker period for stocks ("Sell in May and go away"). The 2022 Qatar World Cup, held in November-December, saw a smaller drop in trading volume compared to summer events, suggesting timing plays a role. The cryptocurrency market's performance during World Cups has been mixed and largely driven by its own major catalysts (e.g., Mt. Gox hack, FTX collapse, halving cycles) rather than the tournament. Investment opportunities have shifted over time. Traditional beneficiaries like TV manufacturers have seen fading returns as streaming platforms become the core viewing channel. Classic consumer plays like beer and sportswear face challenges from changing consumption trends. Newer digital assets, like fractionalized collectible player cards on blockchain, have seen explosive growth. While gambling is a traditional sector, prediction markets are emerging. In conclusion, while a statistical correlation exists, the World Cup's direct impact on markets is likely limited and intertwined with seasonal patterns. With lower liquidity during the event, the simplest strategy for many might be to step back from trading and enjoy the games.

marsbitHace 22 min(s)

Is There Really a "World Cup Curse" in the Market?

marsbitHace 22 min(s)

Why 'AI Service Subscription' Is Destined to Die Out?

"Why 'AI Service Subscription Models' Are Doomed to Disappear" The article argues that the flat-rate subscription model for AI services is fundamentally unsustainable. It points to recent industry shifts, such as Anthropic limiting access to its flagship Claude Fable 5 model for subscribers after just 14 days, and GitHub and OpenAI moving towards credit-based or usage-based billing. The core problem is that subscription models rely on a capped human consumption limit—like watching videos or listening to music—which keeps costs predictable. However, the rise of autonomous AI agents shatters this premise. Agents can consume 5 to 30 times more computing resources (tokens) than a human chatting, and they operate continuously without user presence. This removes the natural usage cap, making fixed-price plans financially unviable as heavy users incur massive costs. Attempts to patch the model with higher tiers or usage caps have failed, often leading to "adverse selection" where only the heaviest users subscribe. The industry's solution is to hollow out subscriptions, replacing "unlimited" access with prepaid credits charged per token, akin to a utility meter. While chat-based subscriptions may linger, the real value and revenue are shifting to pay-as-you-go models. The current period represents a final, heavily subsidized phase for users. The conclusion is that the soul of subscription—a fixed price for worry-free use—is dying, soon to be replaced by pure usage-based pricing where everyone pays for their own "electricity meter."

marsbitHace 23 min(s)

Why 'AI Service Subscription' Is Destined to Die Out?

marsbitHace 23 min(s)

Trading

Spot
Futuros
活动图片