300 to 2: A Valuation Experiment on Real Protocol Revenue

marsbitPublicado a 2026-09-09Actualizado a 2026-09-09

Resumen

The article details a valuation experiment screening the top 300 cryptocurrencies to identify undervalued projects. The key screening criteria were: lower valuation than sector peers, revenue growth exceeding the market median, and token price appreciation lagging behind improving fundamentals. A critical adjustment was using a protocol's actual retained revenue (its real earnings) rather than total fees collected for valuation, as the latter can be misleading (e.g., Jito's P/E shifts from 4.5x to 73x). Initial filtering of 300 tokens left 38 with meaningful revenue data. Applying the three criteria sequentially narrowed the list to 2 final projects: Orca and Jupiter, both Solana-based DEXs. The analysis highlights that many seemingly cheap tokens are either fairly priced (like Pump), value traps with declining revenue, or overvalued despite price lag (like Jito on a retained revenue basis). The author emphasizes this is a screening tool, not investment advice, and notes limitations such as using Fully Diluted Valuation (FDV) and the influence of broader Solana market performance.

Written by: Edgy

Compiled by: Chopper, Foresight News

I am searching for cryptocurrencies with valuation advantages. I set three screening criteria for tokens ranked in the top 300 by market capitalization: revenue growth, valuation lower than industry peers, and token price not yet reflecting the improvement in fundamentals.

In the end, only two projects met all the standards, and they share common characteristics; the projects that were filtered out might be more worthy of in-depth investigation. Here are the conclusions of this research.

Explanation of Screening Rules

The goal of this screening is to identify projects that simultaneously meet all three conditions:

  • Lower valuation compared to peers in the same sector
  • Revenue growth rate outperforms the market average
  • Token price has not yet priced in the positive fundamentals

Using CoinGecko prices and DeFiLlama revenue as benchmarks, I compared data from the past 30 days with the previous 60 days. Then, I asked Claude to assist me with the analysis.

A key adjustment was made in this analysis: ranking is based on the protocol's actual retained revenue, not total fees. Fees are the total amount paid by users, while revenue is the profit actually retained by the protocol.

Take Jito as an example: for every $100 in fees generated, the protocol only retains about $6, with the vast majority distributed as MEV rewards to validators.

If valued based on total fees, Jito's P/E ratio is only 4.5x, appearing extremely cost-effective; but when calculated based on the protocol's actual retained revenue, the valuation is as high as 73x.

Lido similarly retains only about 6% of fees, and Uniswap's retention ratio is 8%.

If judged solely by fees, the "undervalued opportunities" you find are not real.

How 300 Tokens Were Reduced to Just 2

First round of preliminary screening, filtering down to 38 targets with valid statistical data:

  • Initial sample: 300 tokens
  • Among them, DeFiLlama can query revenue data: 117
  • Excluding public chain projects and overly small targets, filtering down to projects where the protocol can retain revenue: 38 remaining

Projects like Morpho, Ondo, Celestia, The Graph, EigenCloud were all excluded. While these projects generate fees, the profits do not flow back to the token itself.

Subsequently, three screening thresholds were applied sequentially, comparing each project to the median Fully Diluted Valuation (FDV) to Annualized Revenue in its own sector (Trading, Lending, Staking, and Others):

  • Valuation lower than peers → 18 remaining
  • Revenue growth higher than sector median → 9 remaining
  • Token price increase lags sector median → 3 remaining

Adding a stress test to eliminate targets with abnormal one-day spike revenue, only 2 remained in the end.

The industry median level is an average 18% increase in project revenue and a 25% average increase in token price. A target must have revenue growth exceeding 18% and a token price increase below 25% to qualify.

The Bias from Fully Diluted Valuation (FDV)

Using FDV instead of circulating market cap for valuation directly eliminated many projects with solid fundamentals. Hyperliquid is the most typical example: calculated based on circulating market cap, the revenue multiple is 28x; but using FDV calculation pushes the valuation to 120x, because the circulating token supply is only a quarter of the total supply.

This criterion might not be fair to HYPE, but this screening uniformly applies this rule.

Results

Cheap valuation, business growth, but price already fully reflects value.
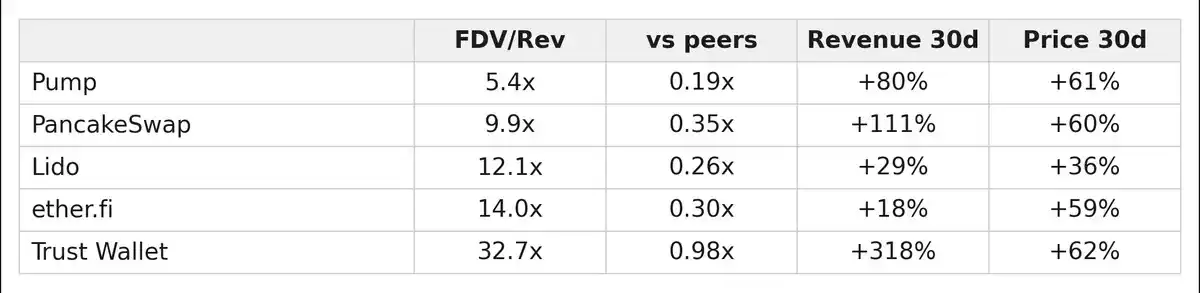
Pump remains the project with the strongest business model in this screening. 30-day revenue of $57 million, valuation less than 6x; revenue up 80%, token price up 61%. The market has already priced it fully, no undervaluation opportunity exists. The market pricing for this type of token is efficiently reasonable.

Low valuation, but out of market favor, business itself is no longer growing.
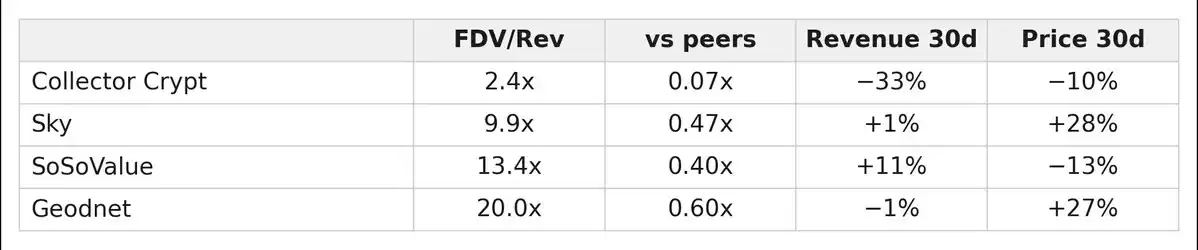
Value trap zone, low price does not equal undervalued. Collector Crypt revenue multiple is only 2.4x, the lowest valuation among the top 300 tokens, but its revenue dropped by one-third.

Business growth, low market attention, but valuation is not cheap.

Revenue continues to rise, token price is flat or even falling, seemingly a perfect deployment opportunity on the surface. But compared horizontally to competitors, their valuations are actually high.

If looking only at fee data, Jito can easily mislead investors: revenue up 44%, token price down 13%, fee-based valuation is only 4.5x. Seems like a perfect opportunity, but when converted to real retained revenue, the valuation reaches 73x.

Bonk has another issue. After removing the spike data from the last three days, the 57% revenue growth directly turns into a negative 17% decline. This growth is likely just a short-term pulse effect brought by the Solana market trend.

Meeting all three conditions.

Aethir failed the revenue stability stress test, with 65% of monthly revenue concentrated in a single-day spike. The underlying cause has not been deeply investigated yet, preliminary data suggests high risk.

Finally, Orca and Jupiter remained, both belonging to Solana ecosystem decentralized exchanges.

The Objective Variable Brought by the Solana Trend

The background must be stated objectively here: SOL increased by 42% that month, part of the exchange revenue growth came from the lagging effect of the Solana bull market, but there are also independent fundamental drivers. Both projects' revenue growth rates outperformed SOL itself, yet their token price increases lagged far behind the public chain.

Jupiter has a more mature business model:

  • 30-day revenue $6.4 million, revenue growth 44%
  • Fee retention ratio 34%, performing outstandingly in profit quality within this screening sample
  • Token price increase 22%, sector median is 25%, meeting the "price lag" screening condition by only a slight margin

Orca has a lower valuation and is a smaller project:

  • Monthly revenue $700k, ranked 293rd by market cap
  • Revenue doubled, and the growth was spread throughout the month rather than concentrated overnight, indicating genuine growth; the downside is the relatively small project scale.

Meteora is worth mentioning. It narrowly missed the growth target by 0.04 percentage points. Revenue grew 18.33%, target value was 18.37%, P/E ratio 7.9x.

Positioning and Limitations of This Screening List

This content does not constitute any buying advice. I will use another complete evaluation system to deeply investigate truly undervalued targets; subsequent comprehensive research across more dimensions is still required.

This screening selected projects with at least 60 days of revenue history, so Robinhood Chain tokens launched relatively recently are not within the statistical scope.

The core significance of this list lies in screening out crypto projects whose businesses are growing, but whose token prices have not yet reflected the upward potential.

Preguntas relacionadas

QAccording to the article, what are the three screening criteria used to filter the top 300 tokens for undervalued opportunities?

AThe three screening criteria are: 1) The token's valuation is lower than its industry peers. 2) Its revenue growth outpaces the market average. 3) The token price has not yet reflected the improvement in fundamentals.

QWhy does the author emphasize using 'protocol actual retained revenue' instead of 'total fees' for valuation analysis?

AThe author emphasizes using 'protocol actual retained revenue' because total fees represent what users pay, but a large portion is often distributed elsewhere (e.g., as MEV rewards to validators). Retained revenue is the portion the protocol actually keeps as profit. Using total fees can create a misleading picture of value, as seen with Jito's P/E ratio appearing as 4.5x with fees but 73x with retained revenue.

QWhich two projects passed all three screening filters and the final pressure test in the analysis?

AThe two projects that passed all three screening filters and the final pressure test are Orca and Jupiter, both of which are decentralized exchanges (DEXs) on the Solana ecosystem.

QWhat is a key limitation mentioned regarding the use of Fully Diluted Valuation (FDV) in this screening process?

AA key limitation of using FDV is that it can unfairly penalize projects with a low token circulation. For example, Hyperliquid (HYPE) appears to have a reasonable 28x revenue multiple based on circulating market cap, but a much higher 120x multiple based on FDV because only about a quarter of its tokens are in circulation.

QWhat common characteristic did most projects eliminated in the first round of screening share?

AMost projects eliminated in the first round were those where fees or revenue generated do not accrue back to the token itself. Examples given include Morpho, Ondo, Celestia, The Graph, and EigenCloud, which generate fees but where the proceeds do not flow to the token holders.

Lecturas Relacionadas

BTC Daily Adjustment in Progress, HYPE Nears Short-term Directional Decision | Invited Analysis

This weekly analysis examines the recent price action of Bitcoin (BTC) and HYPE, focusing on key technical developments and outlining potential trading strategies. **Bitcoin (BTC) Analysis:** * **Market Trend Assessment:** The analysis applies a "52-week moving average confirmation method" to assess the broader trend. While BTC's weekly closing price has broken above this key average, the moving average itself remains in a downtrend, and a proper pullback confirmation is still lacking. The conclusion is that the rally from the July 1st low is still classified as a technical rebound, not yet confirming a new bull market. * **Daily Chart Structure:** The report argues that the five-wave rally (a-e) from the July low likely concluded at the September 21st high. The recent breakdown below the key support of $82,500, followed by a weak-volume rebound, supports this view. If the e-wave is complete, a larger corrective decline (potentially in three sub-waves) is anticipated. The first leg of this correction is underway, with an initial target around $78,000. * **Weekly Outlook & Strategy:** * **Outlook:** The focus is on the downside targets from the September 21st high. Key resistance is seen at $85,500 and the $87,500-$90,000 zone. Support levels are identified at $80,500-$82,500, $75,000-$78,000, and $69,100-$70,500. * **Strategy:** The medium-term posture is neutral/cautious, recommending watching for a potential pullback to a "channel" for confirmation. For short-term traders, two scenarios are outlined: (A) Selling into strength near the $85,500-$87,500 resistance if bearish signals appear, or (B) Selling a confirmed breakdown below the $80,500-$82,500 support zone. A 30% position size with strict stop-loss management is advised. **HYPE Analysis:** * **Daily Chart Structure:** HYPE broke below the lower boundary of its two-month ascending channel on October 8th. Price is currently in a "pullback confirmation" phase, testing this breached support-turned-resistance. A failure to reclaim this level would signal weakness and open the path towards the $75-$77 support area. The longer-term uptrend line, however, remains intact. * **Weekly Outlook & Strategy:** * **Outlook:** The critical watchpoint is the outcome of the current test of the former channel support. Resistance levels are noted at $88-$90, $94, and $102. Key support zones are $80-$82 and $75-$77. * **Strategy:** Two bullish scenarios are proposed for short-term trades: (1) A light long position if price convincingly reclaims and holds above the former channel support, or (2) A light long position if price falls to the $75-$77 support area and shows signs of stabilization. A 30% position size with strict stop-loss discipline is emphasized. **Risk Management Reminder:** The article includes a standard trailing stop-loss protocol (moving stop to breakeven at +1% profit, then locking in profits progressively). It strongly cautions that all analysis is for informational purposes only, not investment advice, and strategies must be adapted to changing market conditions.

marsbitHace 52 min(s)

BTC Daily Adjustment in Progress, HYPE Nears Short-term Directional Decision | Invited Analysis

marsbitHace 52 min(s)

U.S. Defense Procurement Seeks to Exclude Chinese PCBs, Stirring Domestic Disputes Among American Companies

A U.S. defense procurement rule set to take effect in January 2027, which aims to exclude printed circuit boards (PCBs) from China, Russia, Iran, and North Korea, has sparked debate within the American industry. While the policy, stemming from the 2021 National Defense Authorization Act, is intended to bolster U.S. domestic manufacturing and supply chain security, it faces conflicting pressures. The U.S. PCB industry association (PCBAA) urges swift implementation to redirect defense contracts to local manufacturers. In contrast, technology industry groups like the Information Technology Industry Council (ITI) seek a longer transition period, citing high costs and complexities for companies needing to establish new, certified supply lines and production facilities. The rule's direct impact on China's vast PCB industry is estimated to be minimal, affecting less than 1% of its total demand. However, it highlights a broader U.S. strategy to revive advanced electronics manufacturing through defense contracts, tax credits, and subsidies. Despite these efforts, rebuilding a competitive domestic PCB industry faces significant hurdles, including multi-year factory construction timelines, reliance on overseas materials and equipment, and the challenge of achieving commercial scale without sufficient non-defense orders. Notably, even U.S. defense contractors like TTM continue to expand production capacity in China to leverage its mature, cost-effective supply chain. Meanwhile, China's PCB sector is transitioning from scale to technological sophistication, making significant inroads in high-end areas like AI servers and advanced packaging. Leading Chinese firms are achieving breakthroughs in materials and complex multi-layer board production, supported by a deep industrial ecosystem of suppliers, manufacturers, and end-client collaboration. This entrenched system of scale, iterative development, and integrated supply chains represents a competitive advantage that U.S. policy alone cannot quickly replicate. The core challenge for the U.S. is not merely redirecting orders but rebuilding the comprehensive manufacturing capabilities and commercial viability that have shifted overseas.

marsbitHace 52 min(s)

U.S. Defense Procurement Seeks to Exclude Chinese PCBs, Stirring Domestic Disputes Among American Companies

marsbitHace 52 min(s)

Trading

Spot
活动图片