Rippling Away

insights.glassnodePublicado a 2025-04-01Actualizado a 2025-04-02

Executive Summary

  • The Bitcoin market continues to consolidate within the $76k to $87k range, with the Realized Profit/Loss Ratio starting to show signs of near-term seller exhaustion but not yet a renewal of sustained bullish momentum.
  • A longer-term view reveals a deterioration of investor profitability, and an on-chain ‘Death-Cross’ has occurred, suggesting the market may remain weak for the foreseeable future.
  • Supply in loss remains elevated at 4.7M BTC, while the behavior of coins held in-loss is signalling moderate investor stress. Together, these metrics build a picture of deepening bearish conditions.
  • Ripple’s XRP network recently experienced a +490% spike in address activity and a near-doubling of Realized Cap, signalling aggressive retail interest. However, profitability has rapidly faded, suggesting retail interest may be increasingly fragile.
💡
View all charts in this edition in The Week On-chain Dashboard.

Short-Term Relief

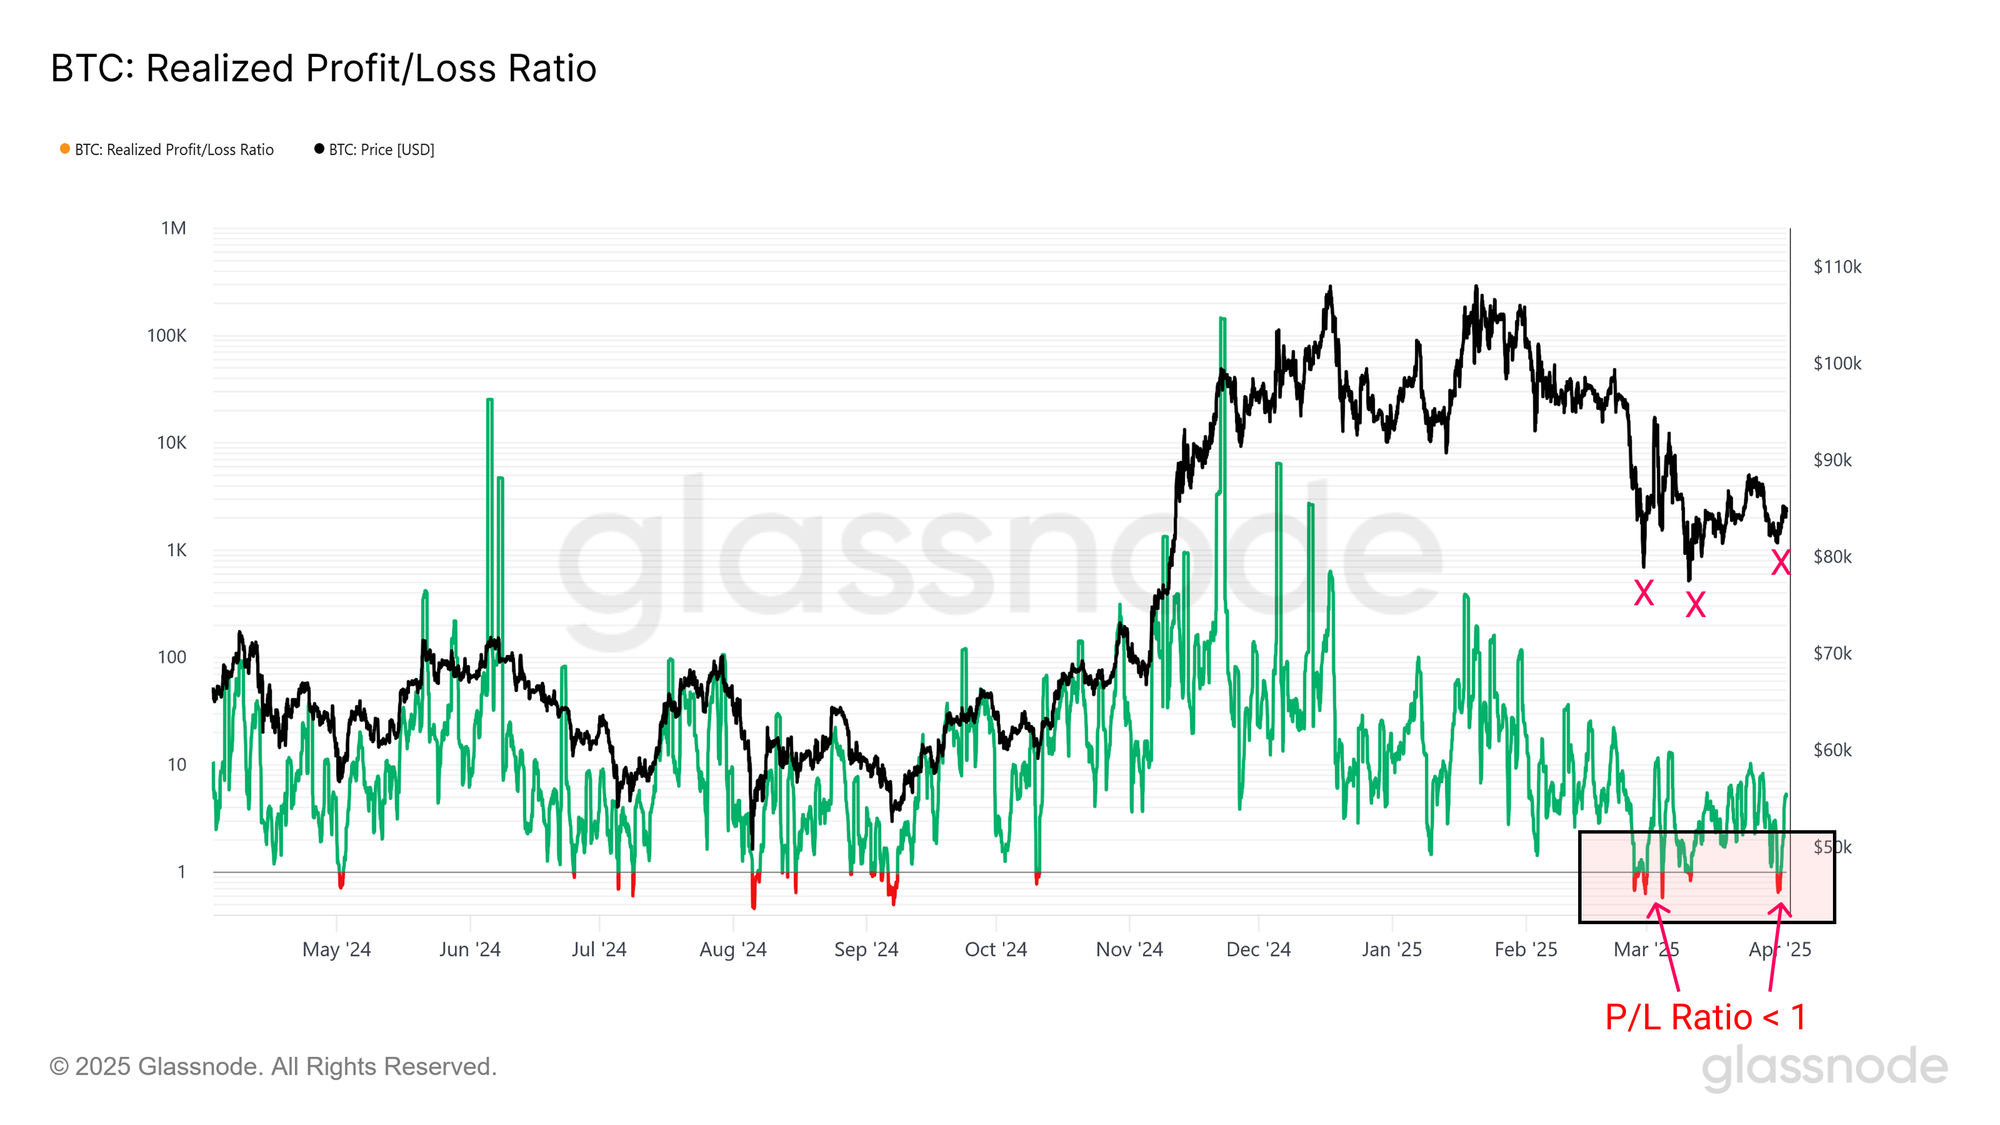
Recent weeks in digital asset markets have been defined by a steady downtrend, with Bitcoin prices trading -30% below the ATH. During this correction, the $76k to $85k zone has emerged as a critical area of interest, with the market trading in this range since late February. Each sell-off towards the range lows has been met with a swift recovery, suggesting the presence of strong reactive demand has shown up whenever prices trade below $80k.

To better understand these dynamics, we turn to the Realized Profit/Loss Ratio — a metric that compares the USD volume of realized profits versus losses. When this ratio falls below 1.0, it signals that more capital is being locked in a loss than a profit. These retests of the 1.0 level often coincide with local capitulation events and short-term price reversals.

Most notably, each dip into the $76k to $80k range has coincided with a P/L Ratio dipping below 1.0, highlighting episodes where losses outweighed profits. This imbalance typically marks a degree of seller exhaustion, where downside momentum fades as sell-side pressure is absorbed.

The resulting rebound appears as relief rallies, but we have not yet seen signs of renewed and sustained strength, reflecting a market which is still processing the emotional and financial hangover of the $109k ATH peak.
Live Chart

Zooming Out

Although short-term seller exhaustion can provide momentary relief, a deeper question emerges: Are these rebounds signs of a larger bullish impulse, or simply reactive bounces within a broader downtrend?

While some market participants may speculate that repeated bounce-backs from the $76k–$80k range could eventually rally toward new all-time highs, a longer-term perspective is necessary to gauge the sustainability of such momentum.

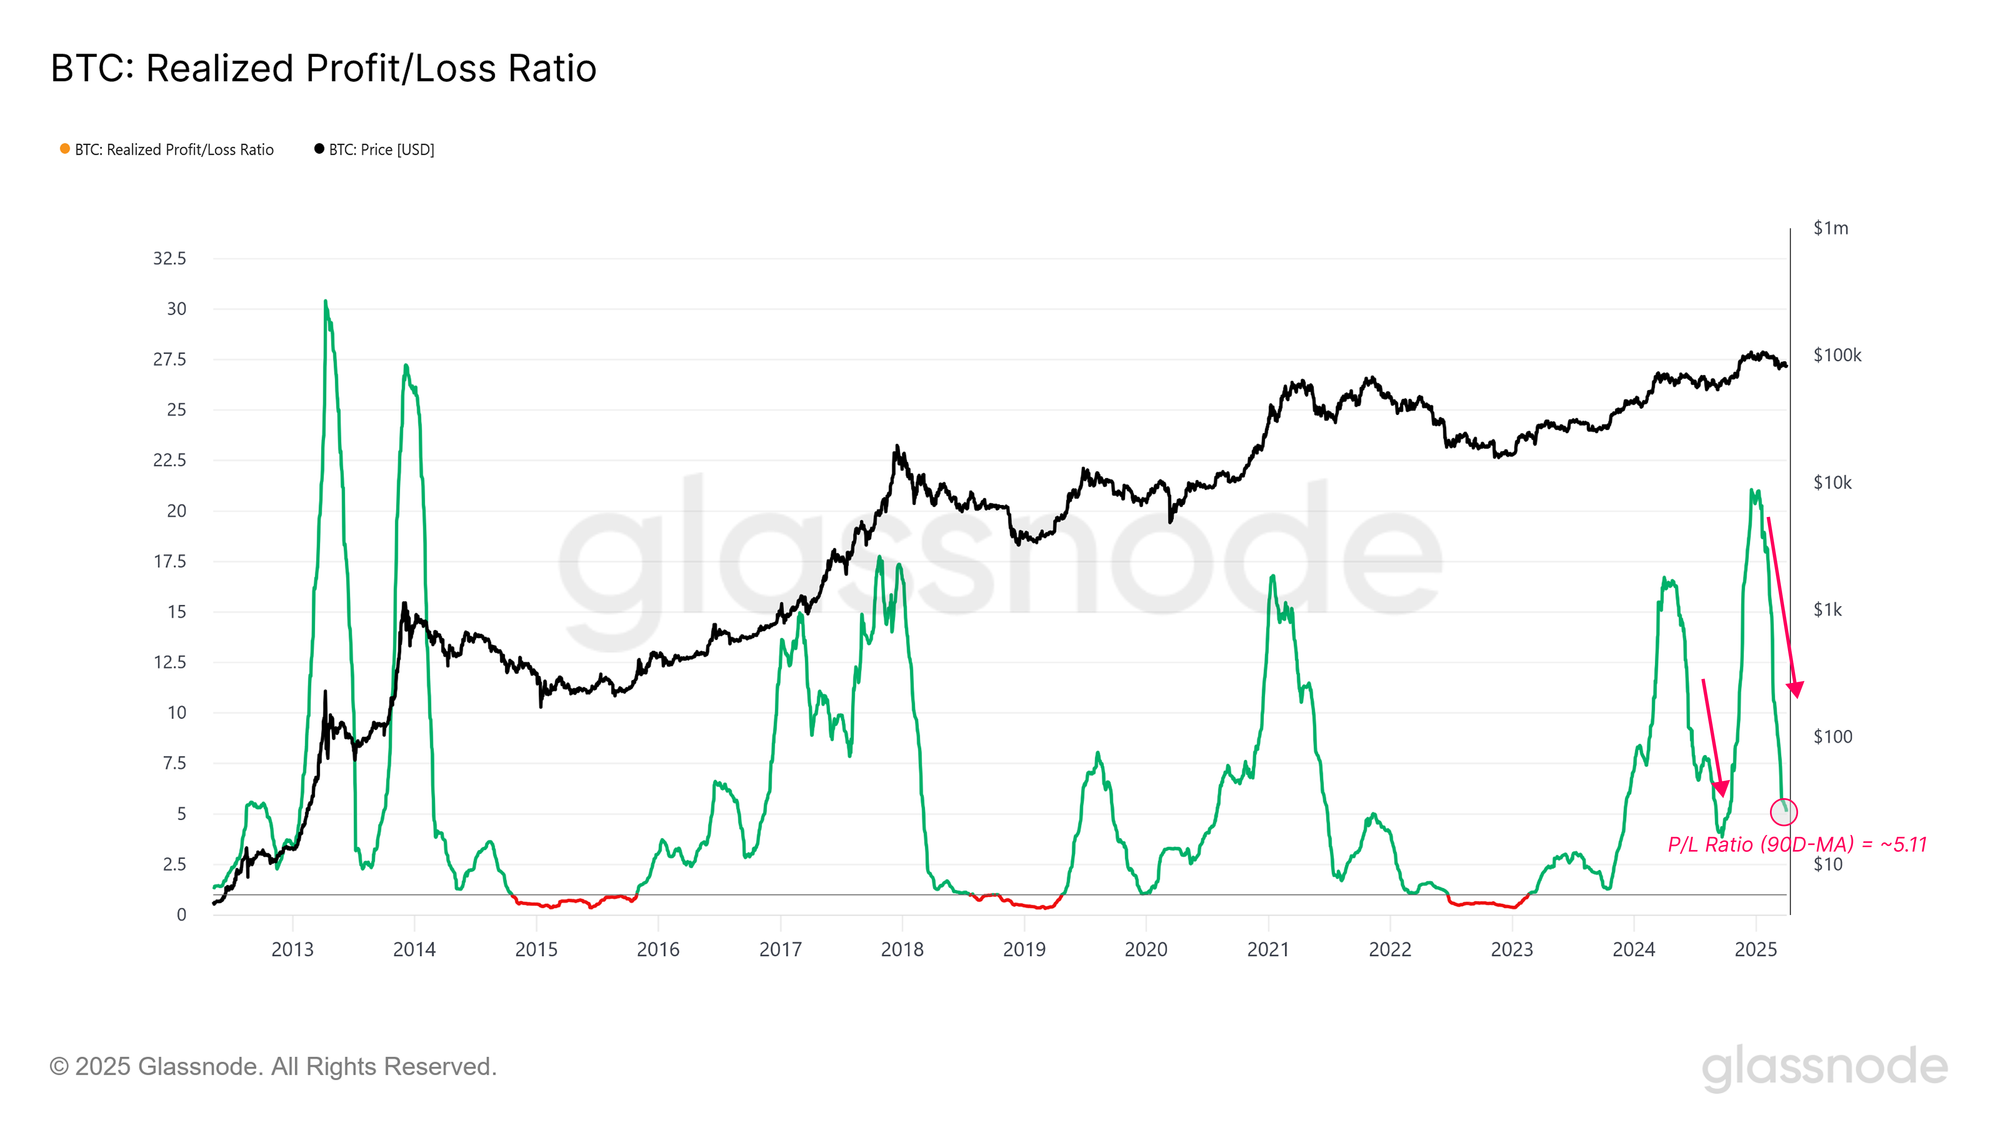
The Realized Profit/Loss Ratio, is traditionally shown in logarithmic scale due to its volatility and wide range. To provide a clearer view of broader market dynamics, we have plotted a 90-day simple moving average to the metric on a linear scale. This smoothed presentation helps filter out the daily noise and highlights prevailing trends in spending profitability.

From this vantage point, the longer-term momentum has declined markedly since early January, despite the recent short-term spikes seen on the raw daily resolution. These brief profit-driven surges have failed to reverse the broader downtrend, suggesting that the macro picture remains one of generally weaker liquidity and deteriorating investor profitability.

So far, there is little evidence suggesting a structural bullish shift in momentum is underway.
Live Chart

An On-Chain Death Cross

With profitability trending lower, it’s logical to turn our attention to price momentum as a core driver behind investors locking in both profit and loss.

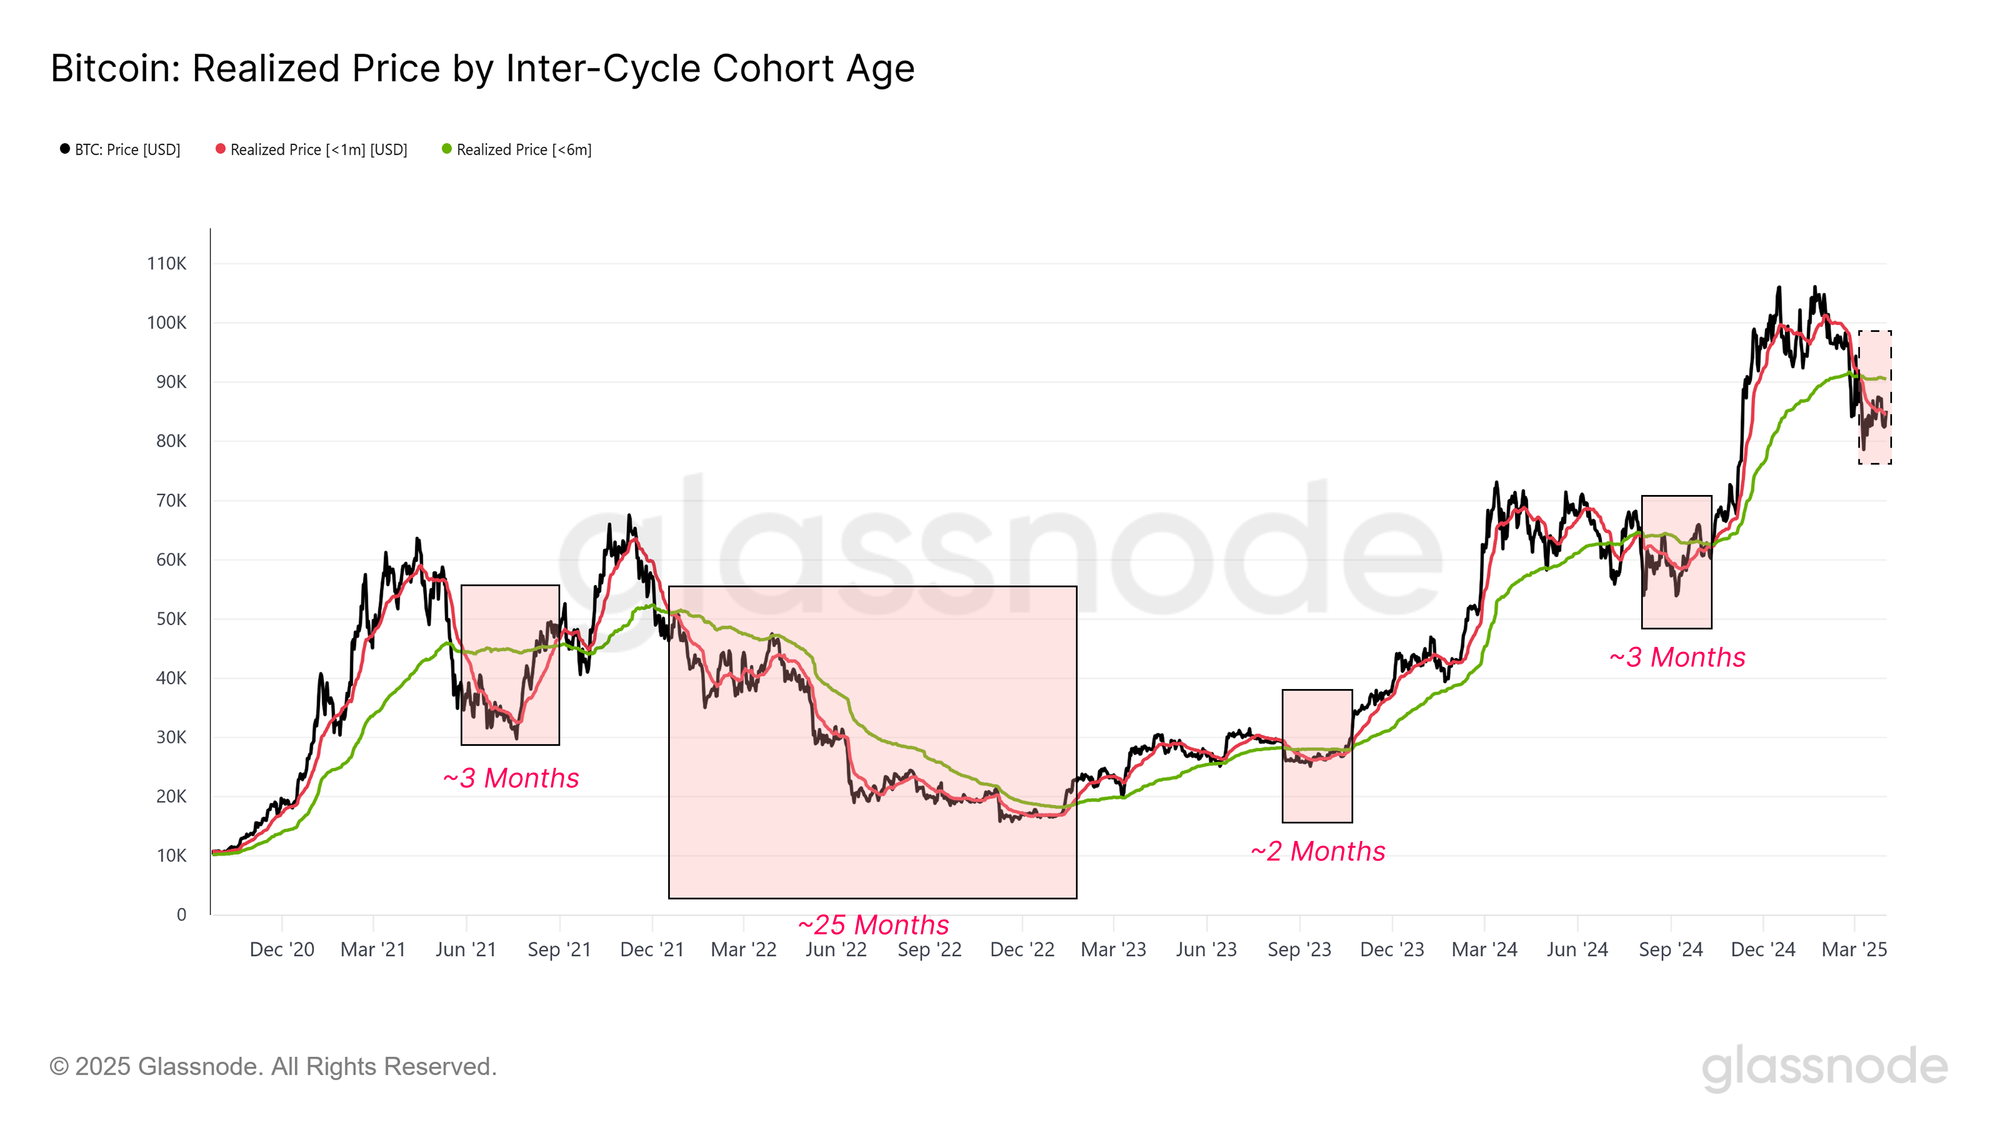
Traditionally, technical analysts identify major shifts in momentum when a “Death Cross” occurs, indicating where the 50-day moving average drops below the 200-day. This event often signals a weakening trend.

To bring this concept into the on-chain domain, we construct an analogue using on-chain volume-weighted prices for coins moved in the last 1 month, compared to the last 6 months. This method directly reflects market sentiment by factoring in both when and how much capital actually moves on-chain.

The recent crossover of the short-term 1-month average below the long-term 6-month price could be considered to mark an on-chain Death Cross. This pattern has historically preceded 3–6 month-long bearish trends. If this cycle follows suit, it suggests the market may still be working through a period of weakness before the bulls can reestablish a robust uptrend.
Live Chart

Bear Market Depth

Following signs of weakening momentum and shrinking profitability, the current market structure ticks nearly many of the boxes we look at for a typical bear market phase. The current market is characterized by tighter liquidity conditions, negative sentiment and momentum, and investor behaviour increasingly moving toward loss-taking events.

In such environments, investor psychology is dominated by fear and emotional fatigue. Historically, the most extreme bearish phases tend to culminate with a capitulation event, often setting the stage for bottom formation and an eventual recovery.

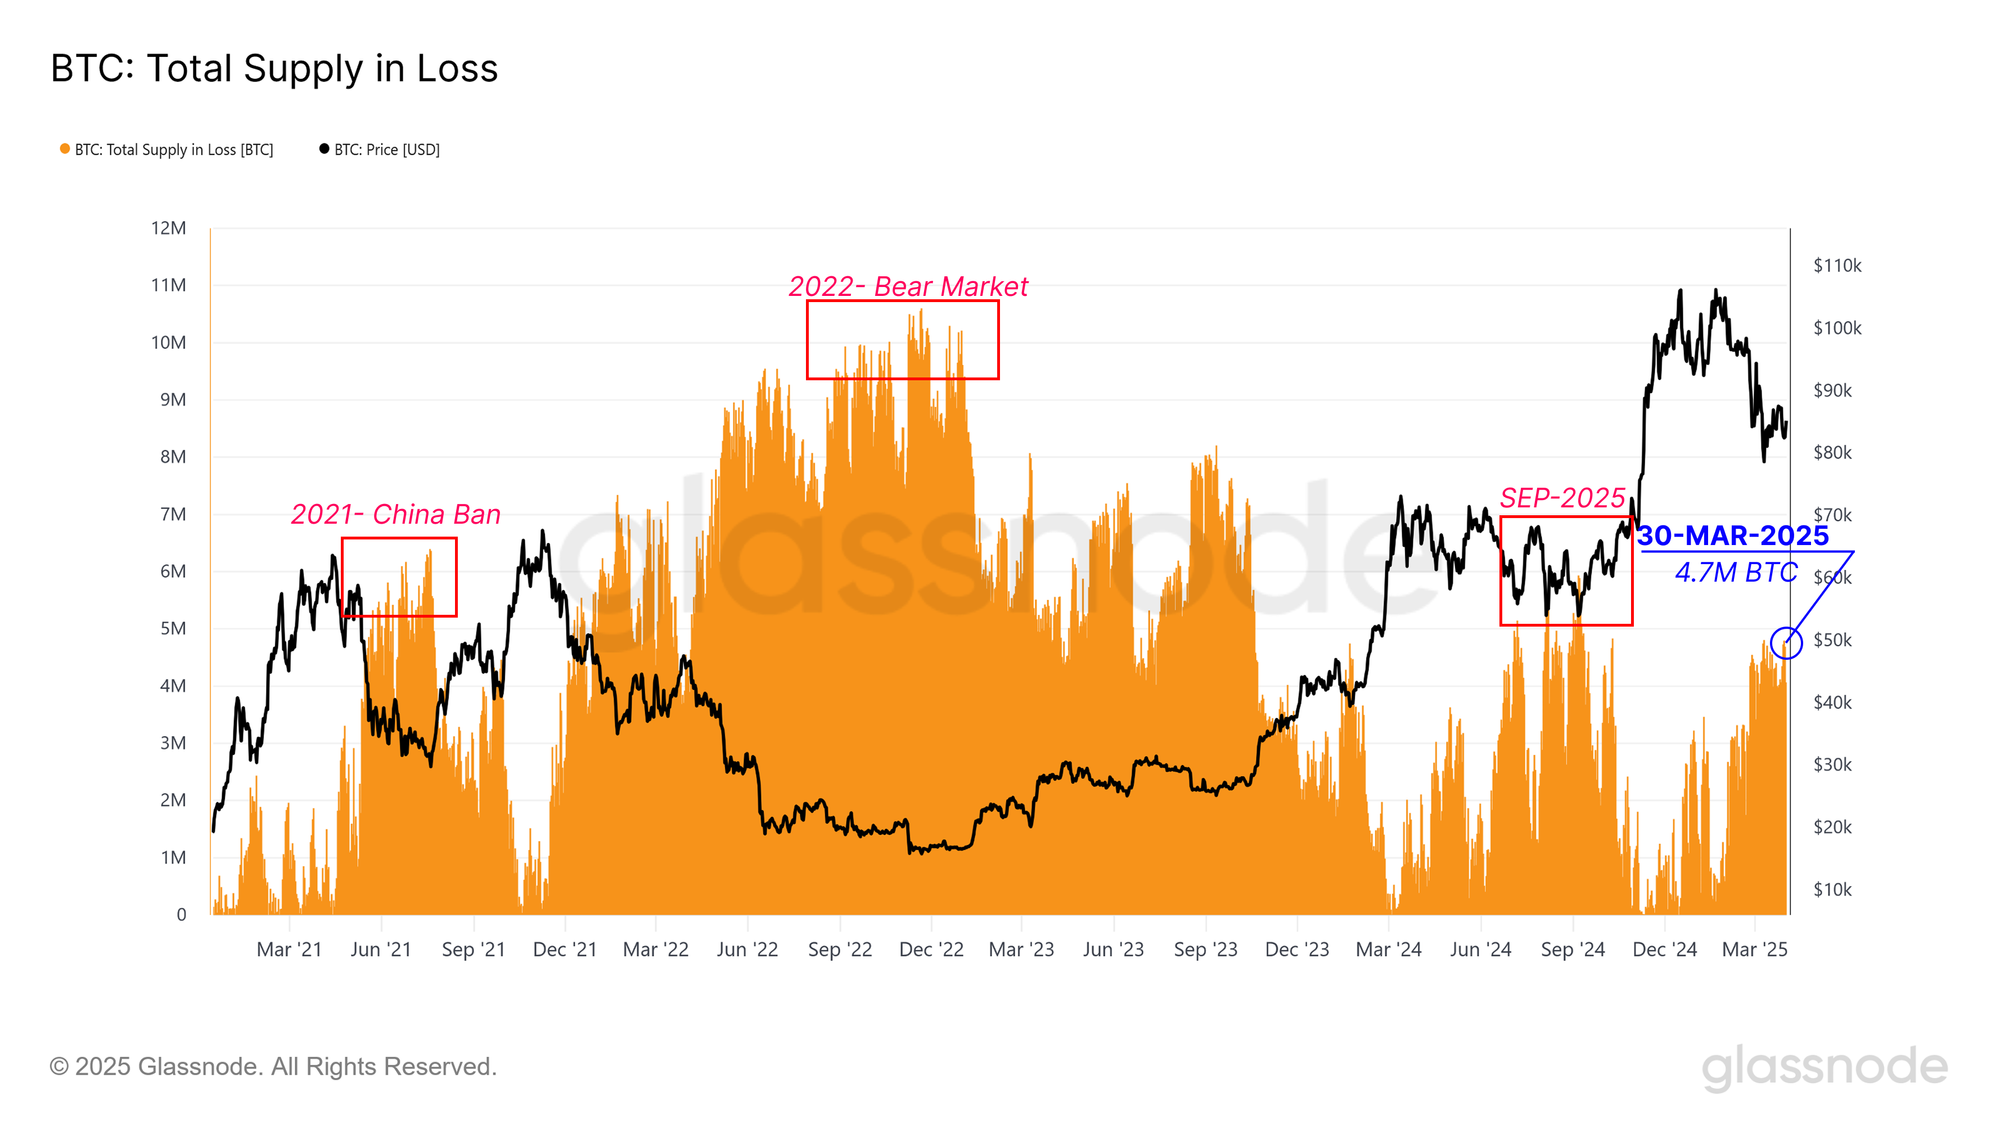
A comprehensive analysis of bearish markets involves two key dimensions: loss dominance and loss intensity. Loss dominance is captured by the Total Supply held in Loss, which tracks the volume of coins held below their on-chain acquisition price. On March 30, 4.7M BTC were held below their cost basis, which is an elevated level, though still below extremes seen in mid-2021, the 2022 bear market, and during the September 2024 drawdown.

Sizing up these losses helps frame where we are in the cycle and whether the market is deep in despair, nearing exhaustion, or may still have more pain to endure.
Live Chart

Measuring Loss Intensity

Building on our view of loss dominance, the second dimension of investor stress is loss intensity, which captures how far below the cost basis investor holdings are. To assess this, we turn to the Market Value to Realized Value (MVRV) ratio, a metric that compares the spot price to the average cost basis of all coins in the supply.

To isolate the experience of underwater investors, we can focus specifically on the MVRV of supply held in loss. We can construct this metric by dividing the total USD-denominated unrealized loss held by the market by the number of coins contributing to it.

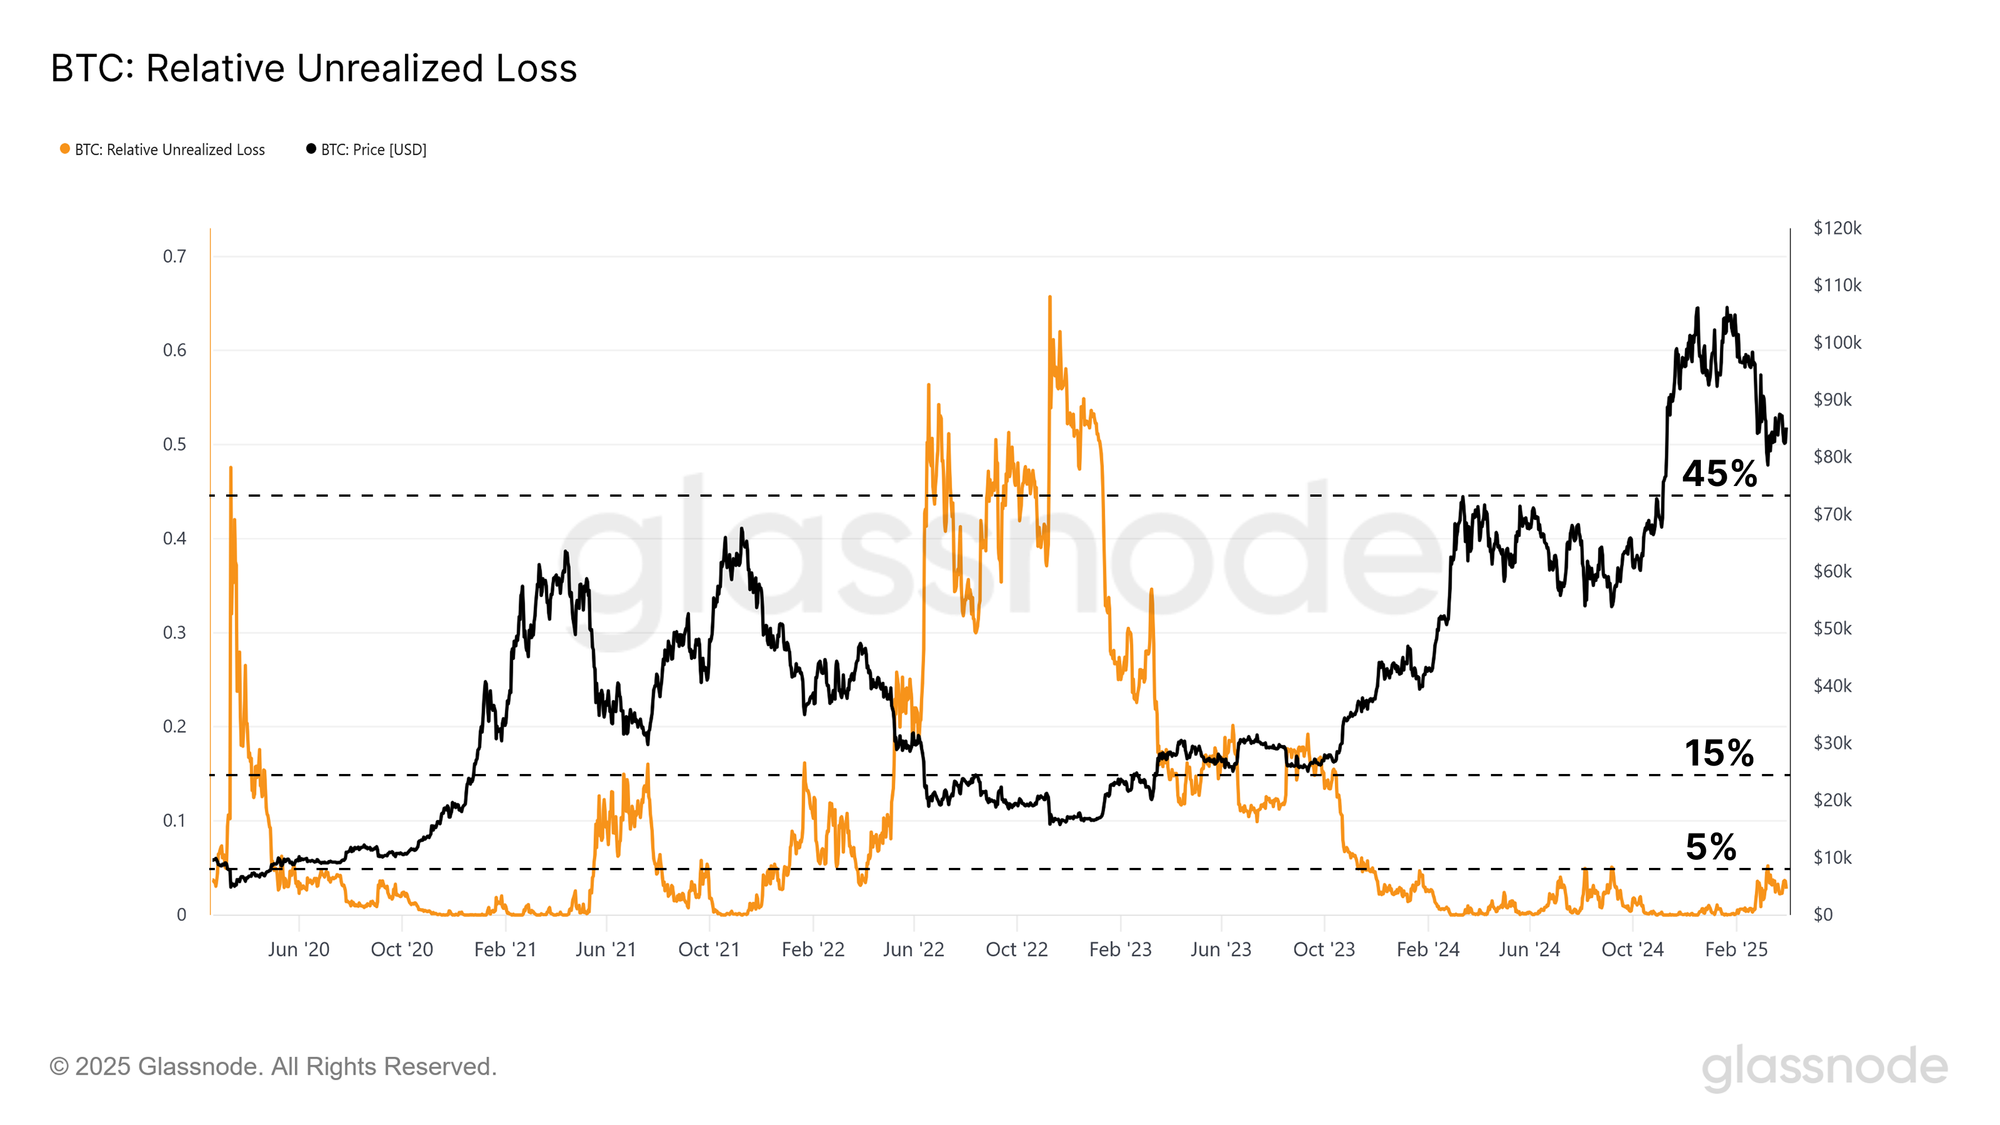
The Relative unrealized loss, which expresses the proportion of the market cap that is underwater, is currently at 2%. This is notably lower in magnitude than what we have seen in previous bear markets, such as in 2022. By this measure, whilst the number of coins held in loss is substantial, the magnitude of the unrealized losses they carry is not.
Live Chart

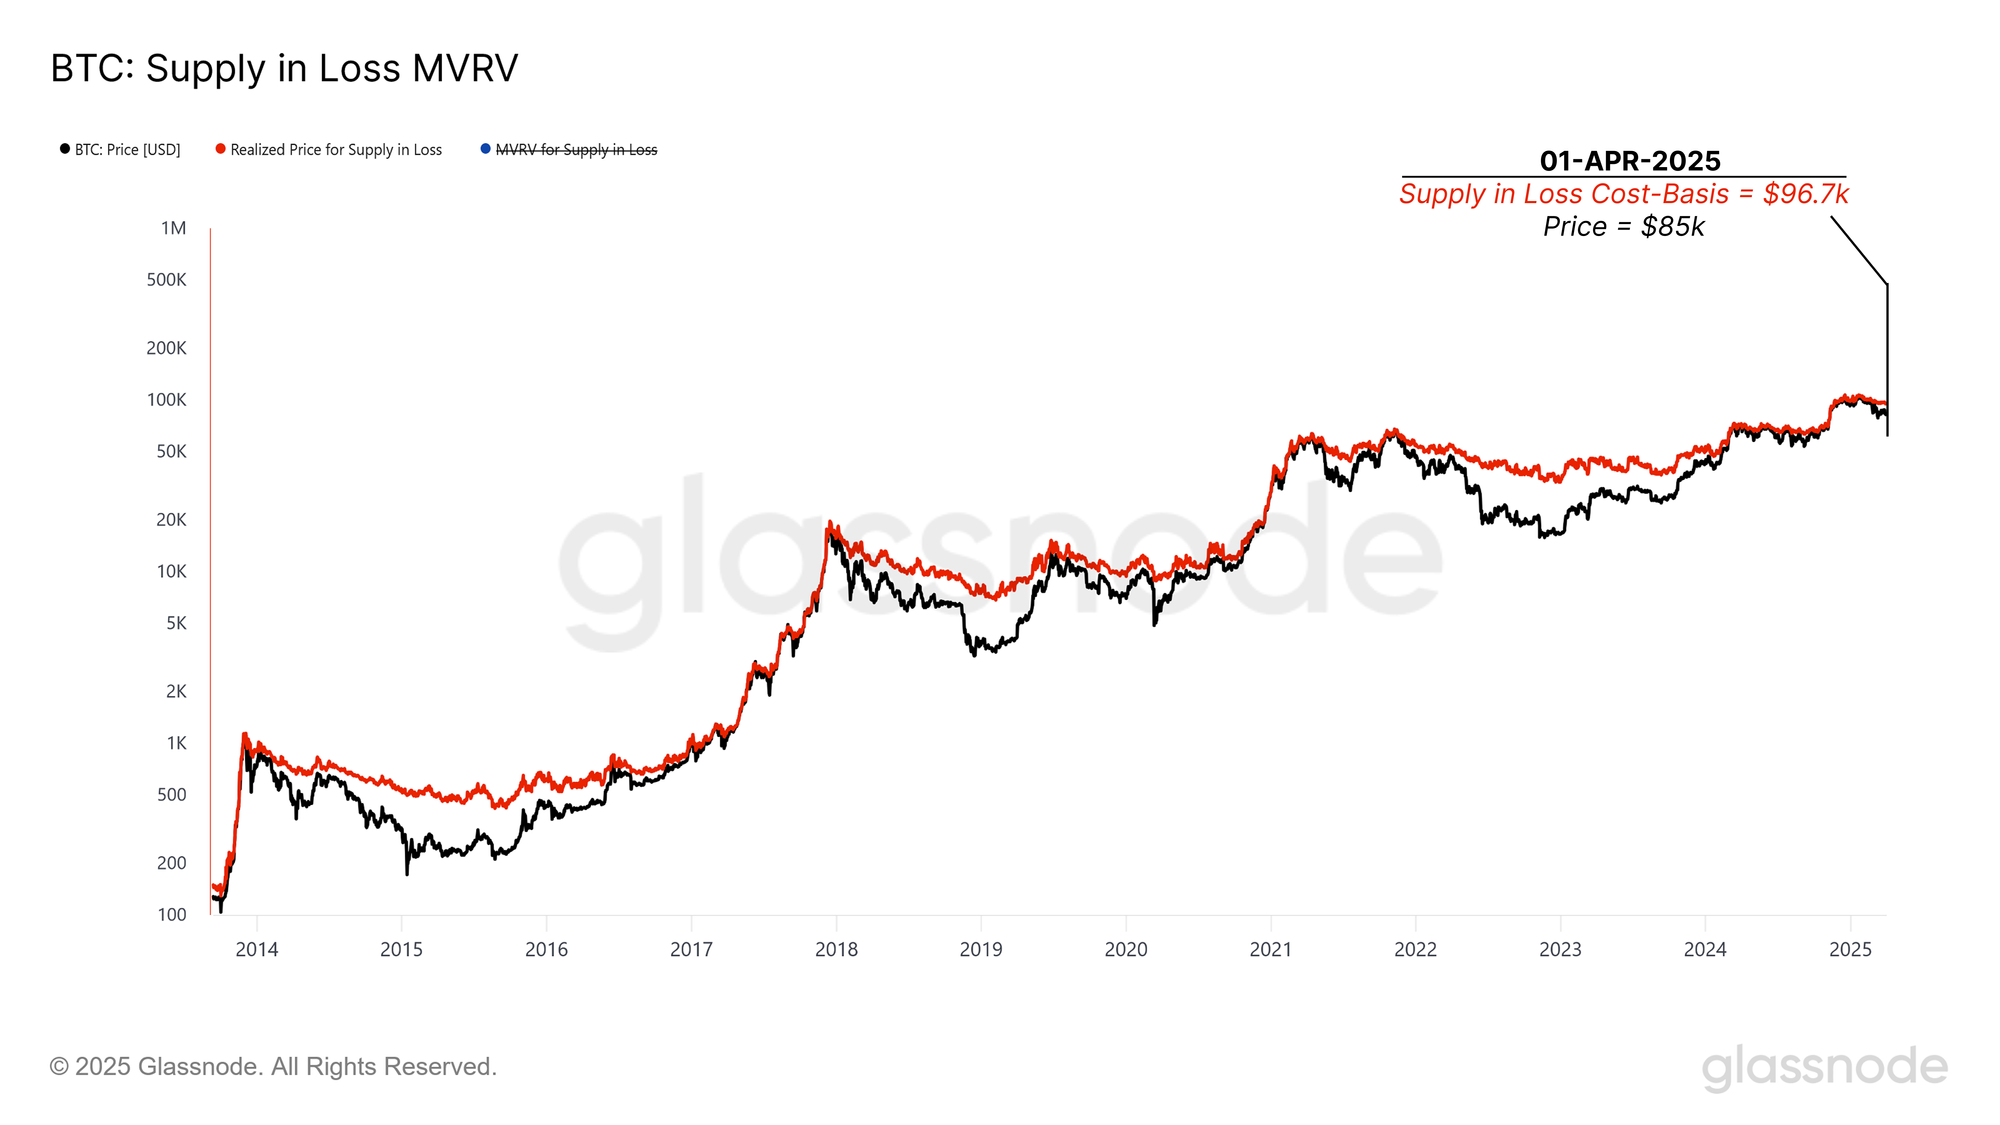
From this, we can compute the average cost basis of coins in loss using the following formula:

The realized price for the supply in loss is at $96.7k, which means, on average, the average underwater coin is holding an unrealized loss of -12%.
Live Chart

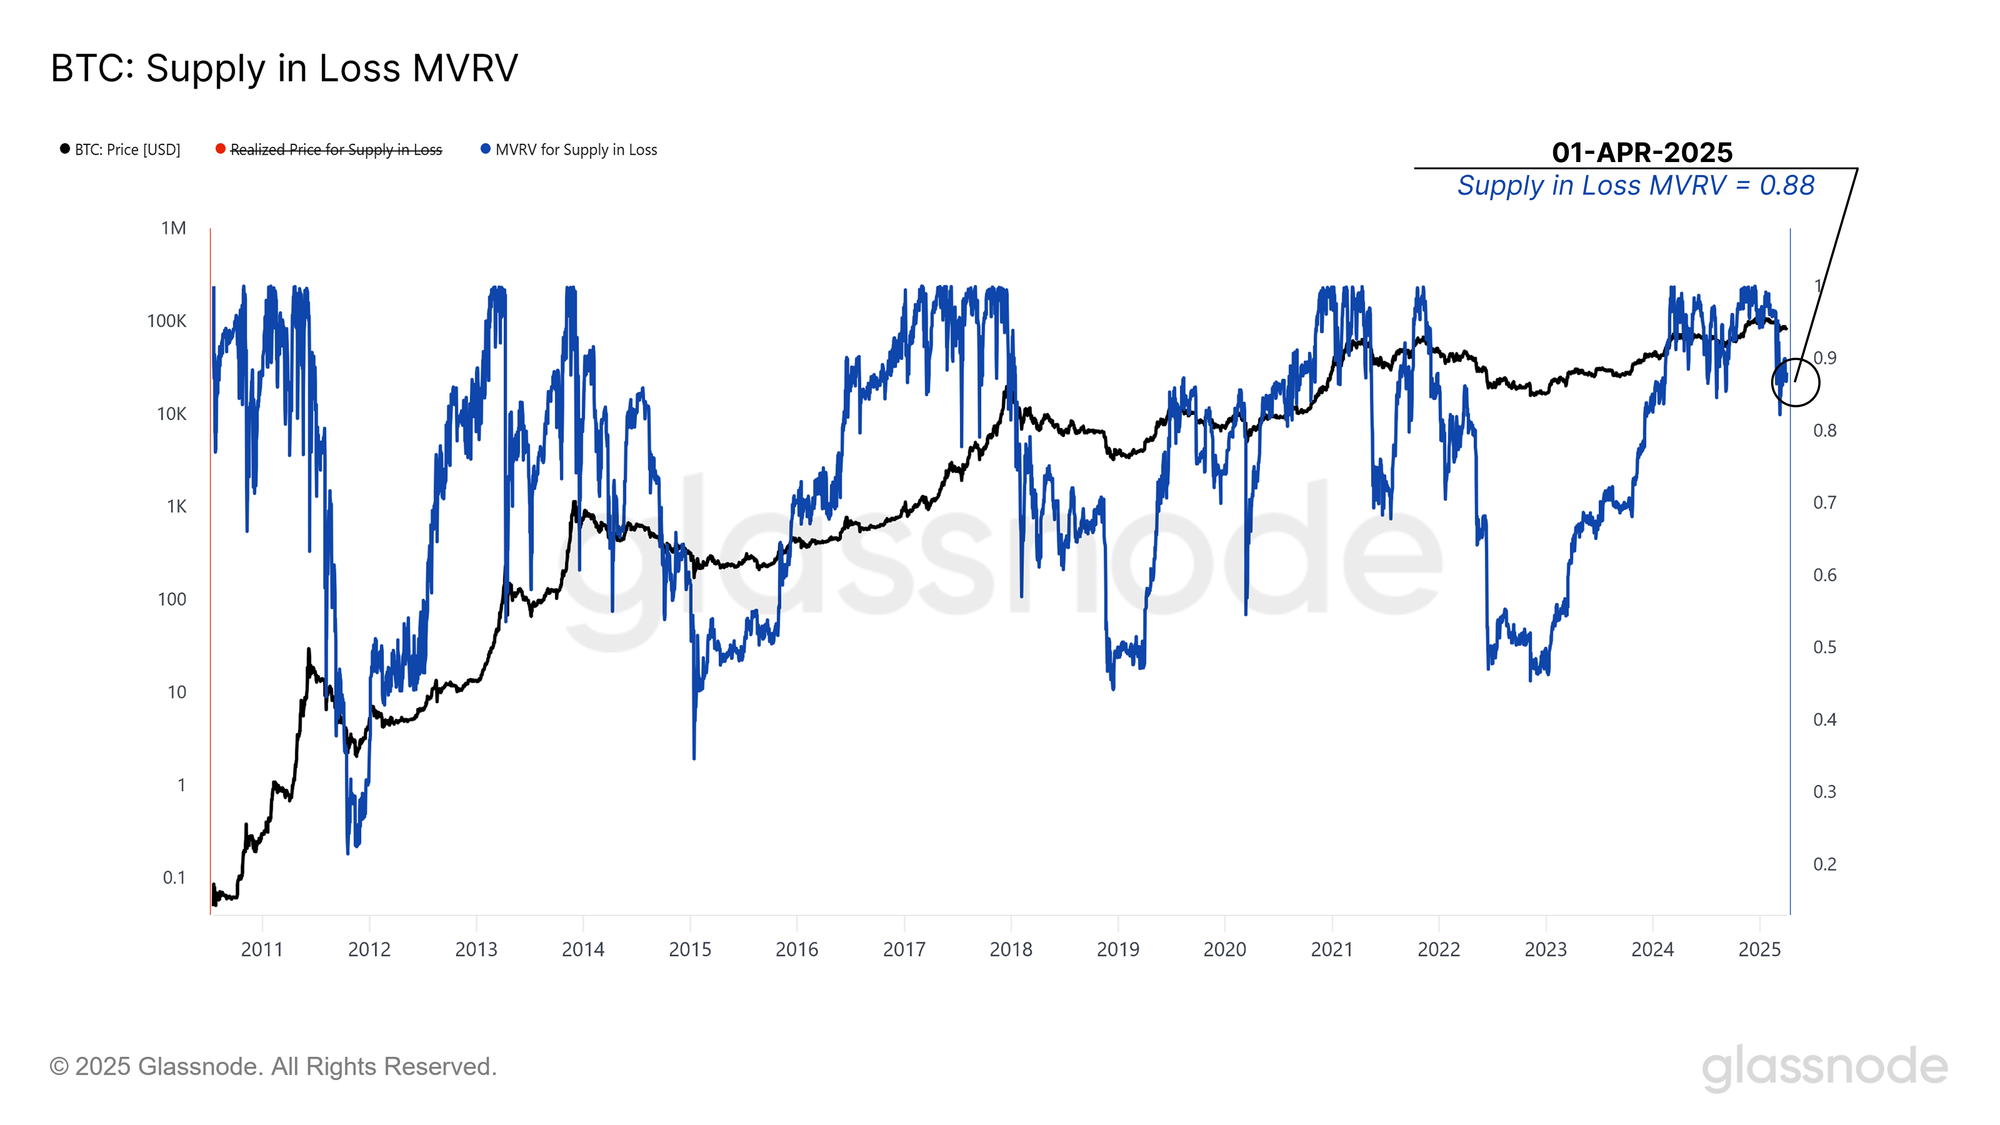
This Supply in-Loss Realized Price then serves as the denominator for constructing an MVRV ratio for these coins, creating an oscillator to compare how far underwater the average loss-holding investors are. We can then use this metric to compare across previous cycles and use this as an input for identifying how deep the investor distress is and whether there are any early signs of recovery.

The Supply in-Loss MVRV dropped sharply when the price broke below $93k and is now trading at 0.88, indicating a moderate degree of loss and stress within the market. This is one of the lowest levels of this MVRV for this cycle, although it is again not at the deeply low levels seen in prior bear markets.

Overall, there are many signs of weakness for Bitcoin investors. However, we should note that the magnitude of this weakness across several dimensions is not yet at the depth and severity of some of the more brutal downtrends Bitcoin has experienced in the past.
Live Chart

Rippling Away

As Bitcoin investors grapple with deepening losses, a contrasting trend emerges in more retail-driven corners of the market. One defining feature of this cycle has been the rise of institutional demand via U.S. spot ETFs, with a lot of retail participation and speculation pulled toward alternative digital assets.

For this cycle in particular, Ripple (XRP) has been a preferred asset for trade amongst retail investors, and studying its behavior can therefore serve as a proxy for measuring retail speculative demand.

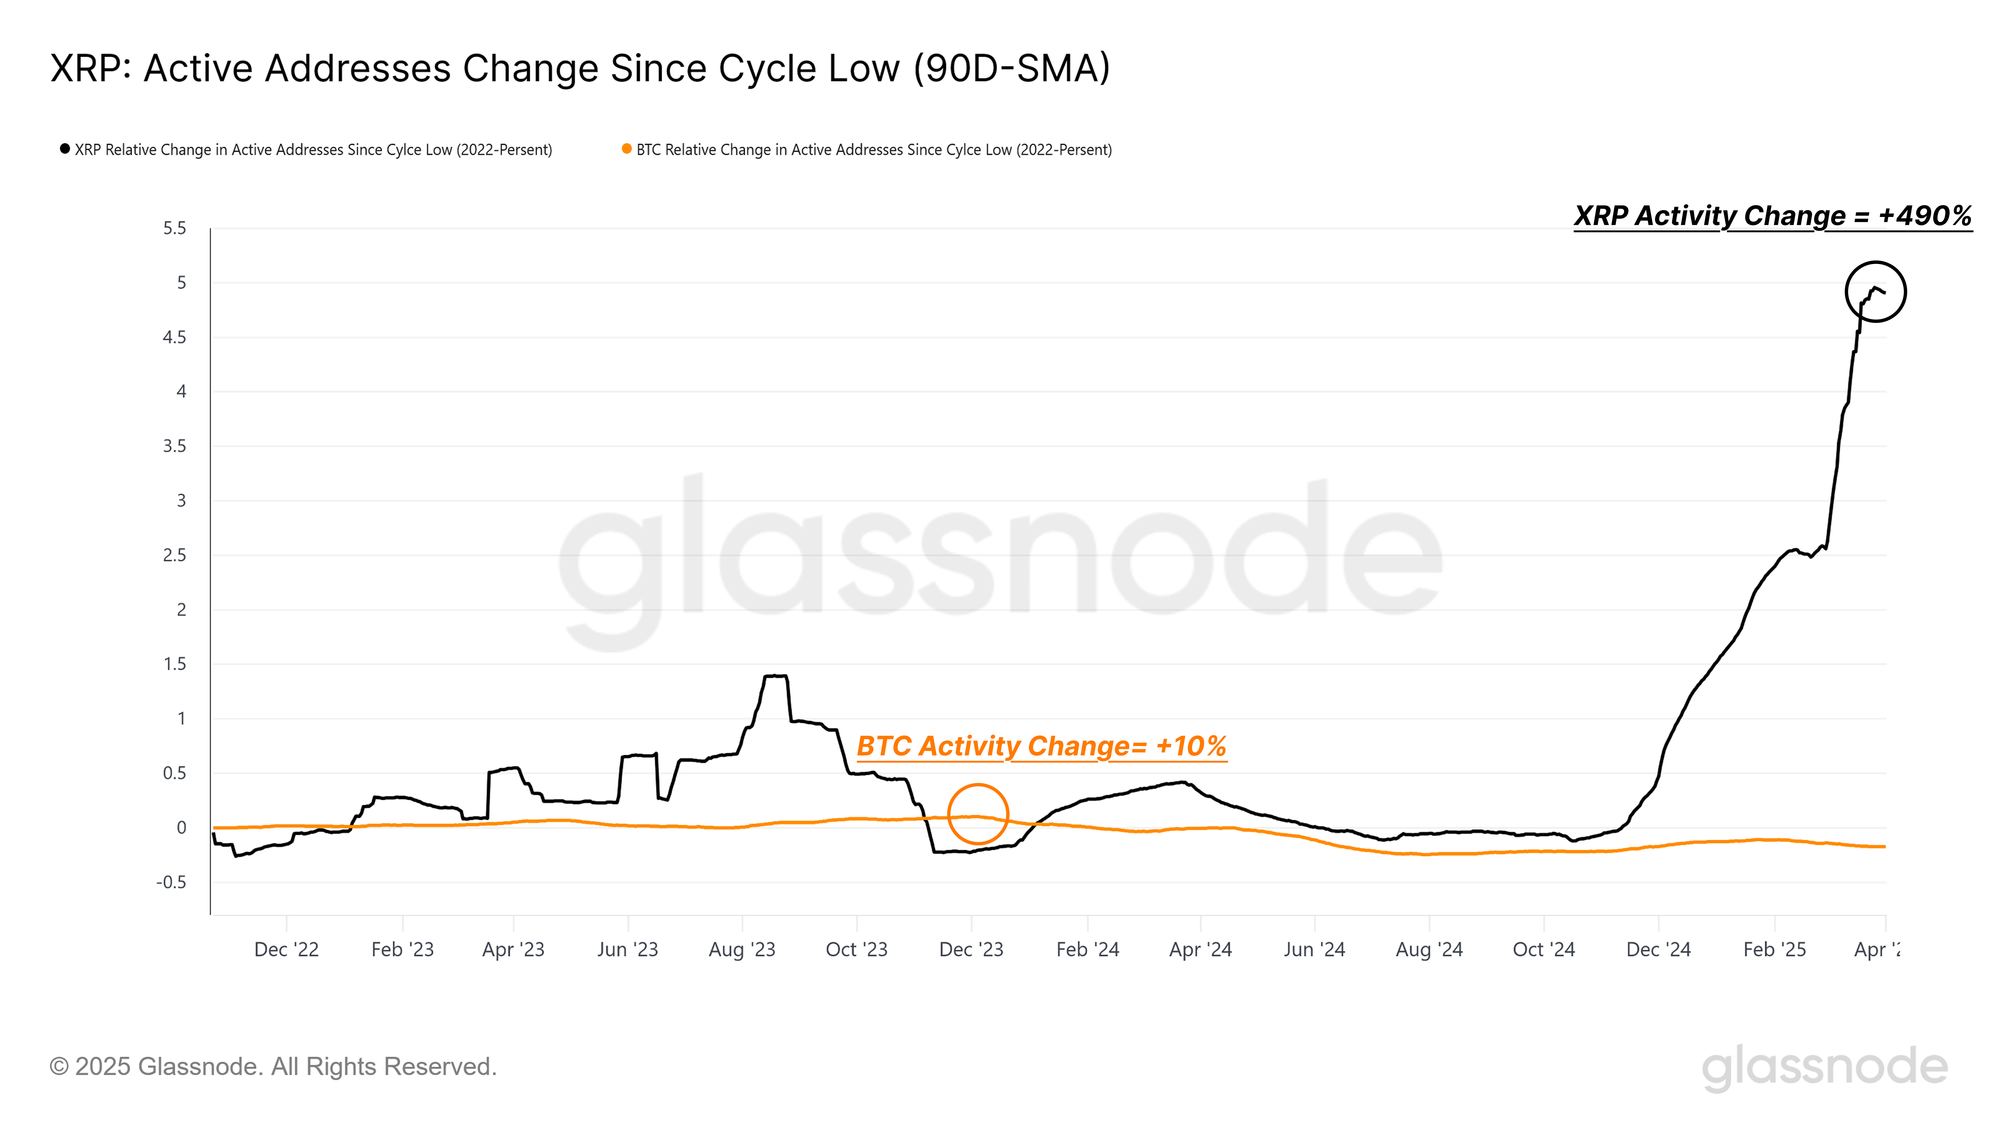
Since the 2022 cycle low, the quarterly average of daily active addresses for XRP has jumped by +490%, compared to just 10% for Bitcoin. This stark contrast suggests that retail enthusiasm has been attracted by XRP, thus providing a mirror for speculative appetite in the crypto space.
Live Chart

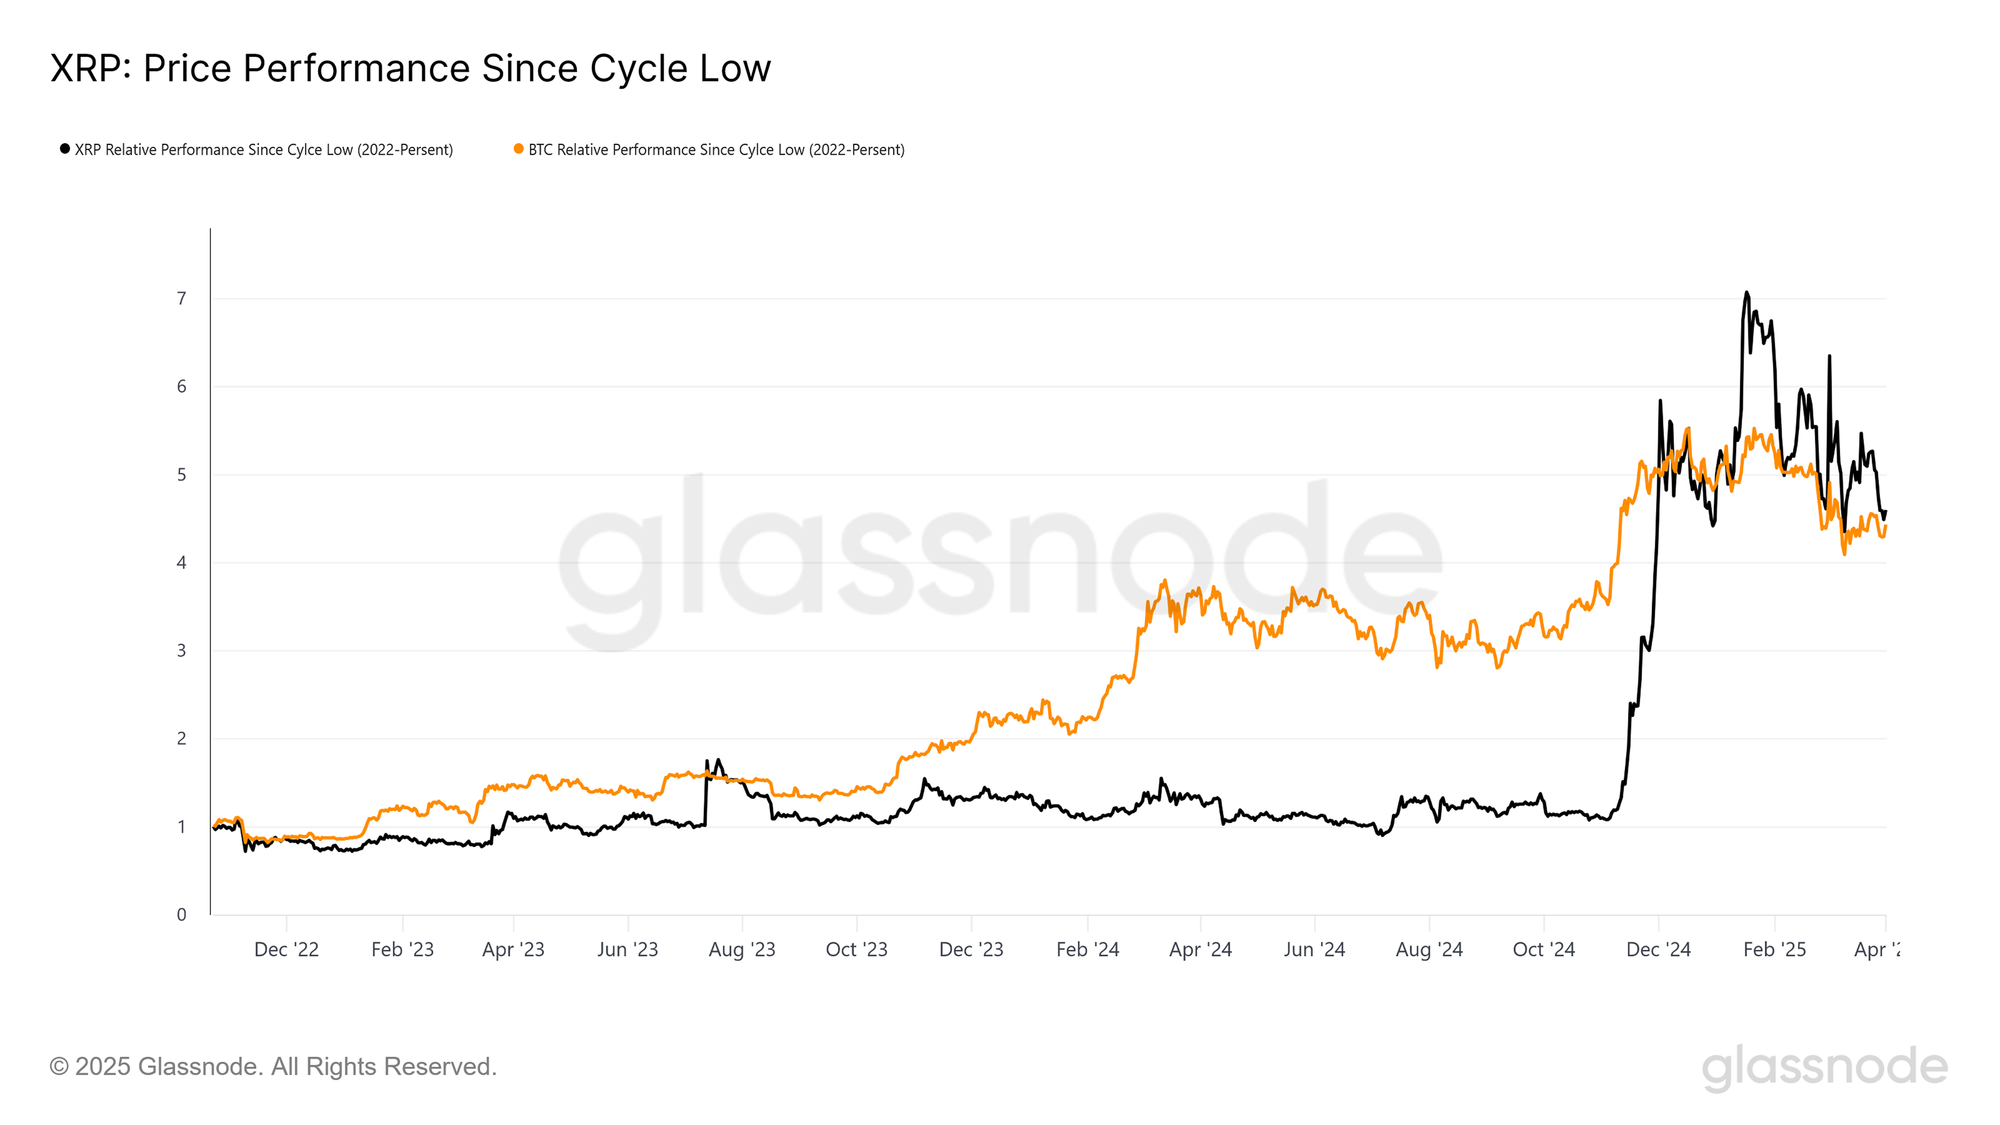
This becomes even clearer when we examine the path each asset has taken since the 2022 cycle low. While both Bitcoin and XRP have delivered a similar performance, both trading, roughly 5x to 6x off the bottom, the journey has been fundamentally different.

Bitcoin’s rally has followed a more organic and progressive trajectory, marked by steady growth and punctuated by sharp uptrends during key catalysts such as the launch of spot ETFs and developments around the U.S. elections.

In contrast, XRP traded largely sideways until December 2024 before experiencing an explosive surge higher, a price pattern more consistent with retail-driven speculation than with structured and sustained inflow of new demand.
Live Chart

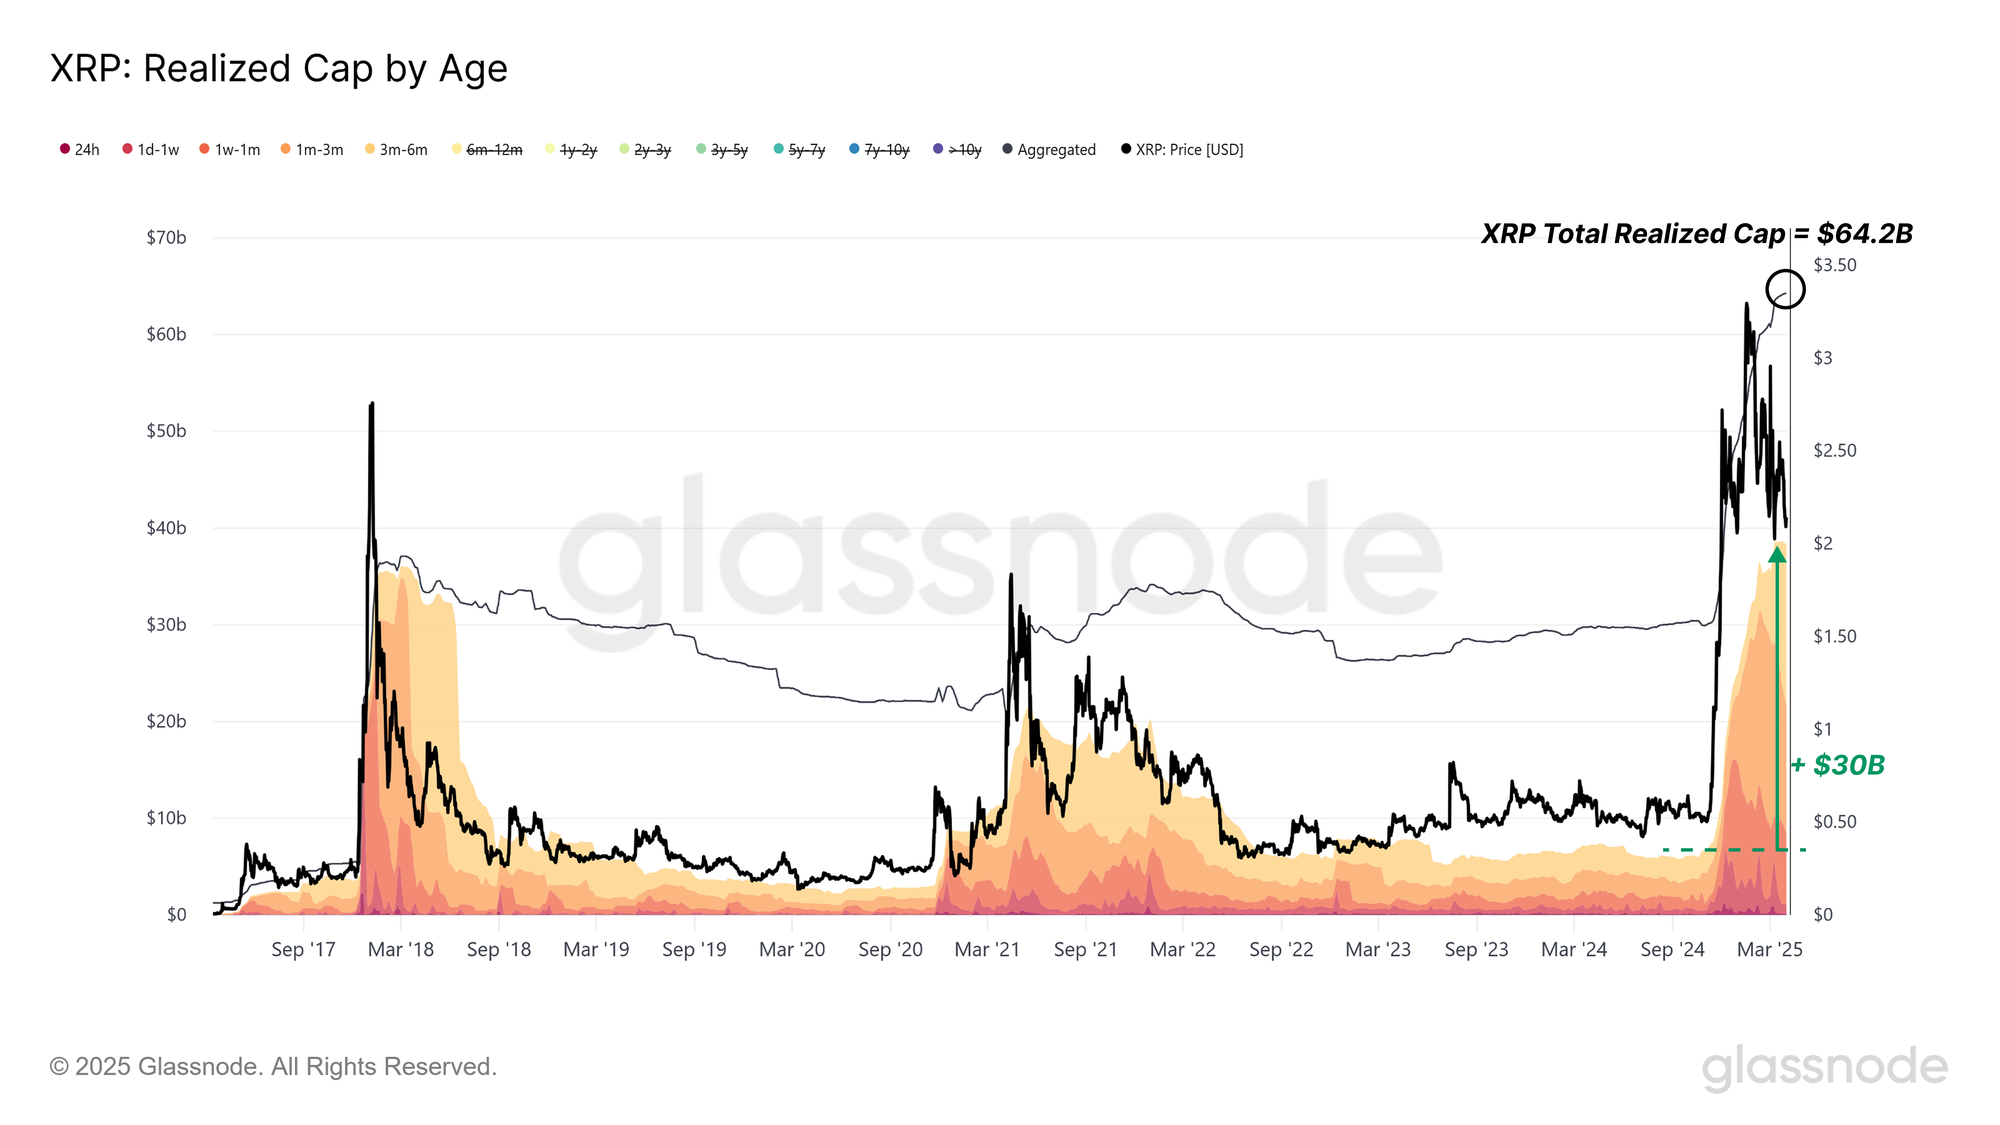
During this recent surge, XRP’s Realized Cap nearly doubled from $30.1B to $64.2B, reflecting a substantial inflow of capital. Notably, close to $30B of this increase came from investors deploying capital within the last six months, highlighting the short concentration of this retail-led rally.

However, this capital influx has started to slow down since late February 2025, signalling a potential cooling-off in speculative appetite.
Live Chart

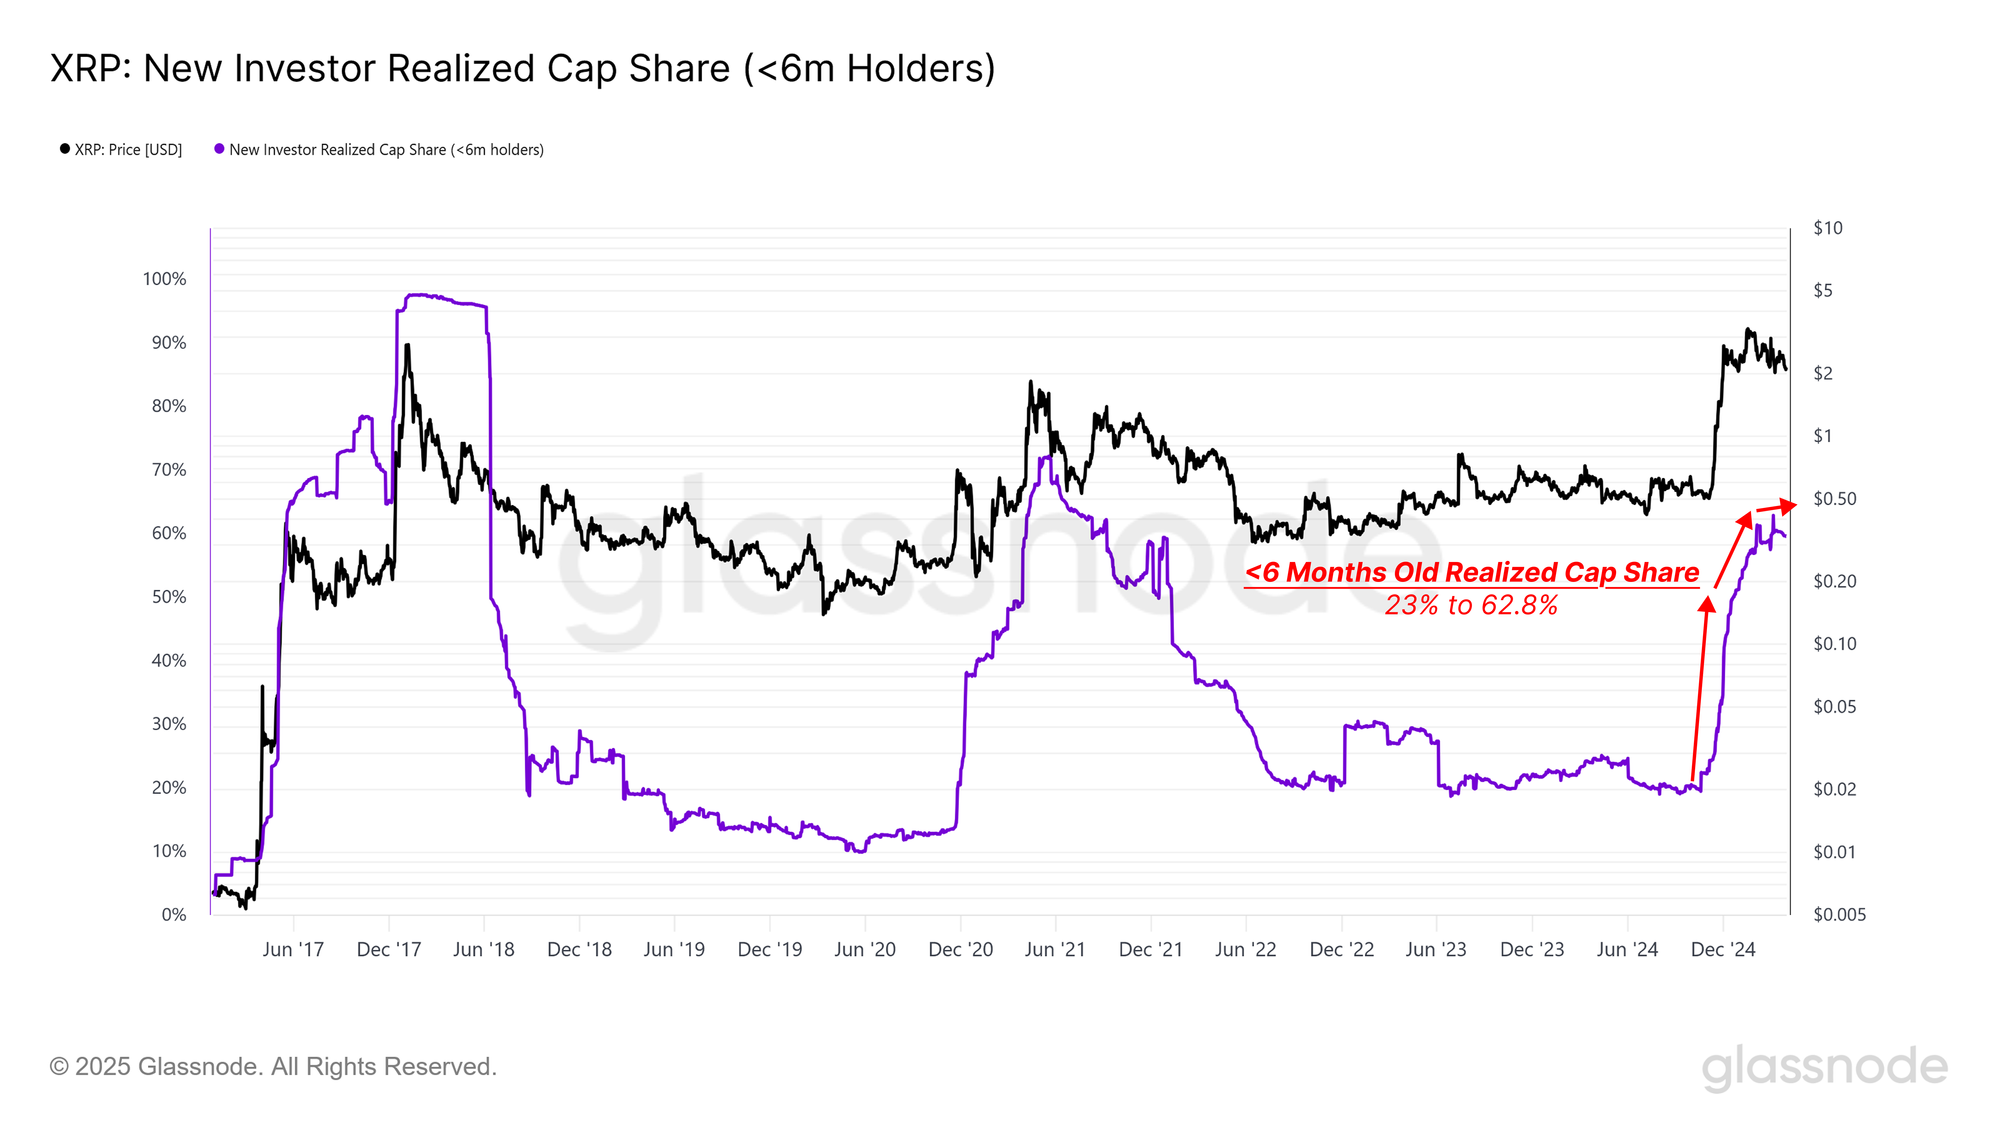
Alongside the short surge in capital flows, there’s been a rapid concentration of wealth in the hands of new investors, with the share of XRP’s realized cap, which is younger than 6 months, rising from 23% to 62.8% in just a short period of time.

When viewed together with the heavy retail participation, this sharp uplift in new holders raises caution signs, where many investors are likely to be vulnerable to downside volatility, given their now elevated cost basis.
Live Chart

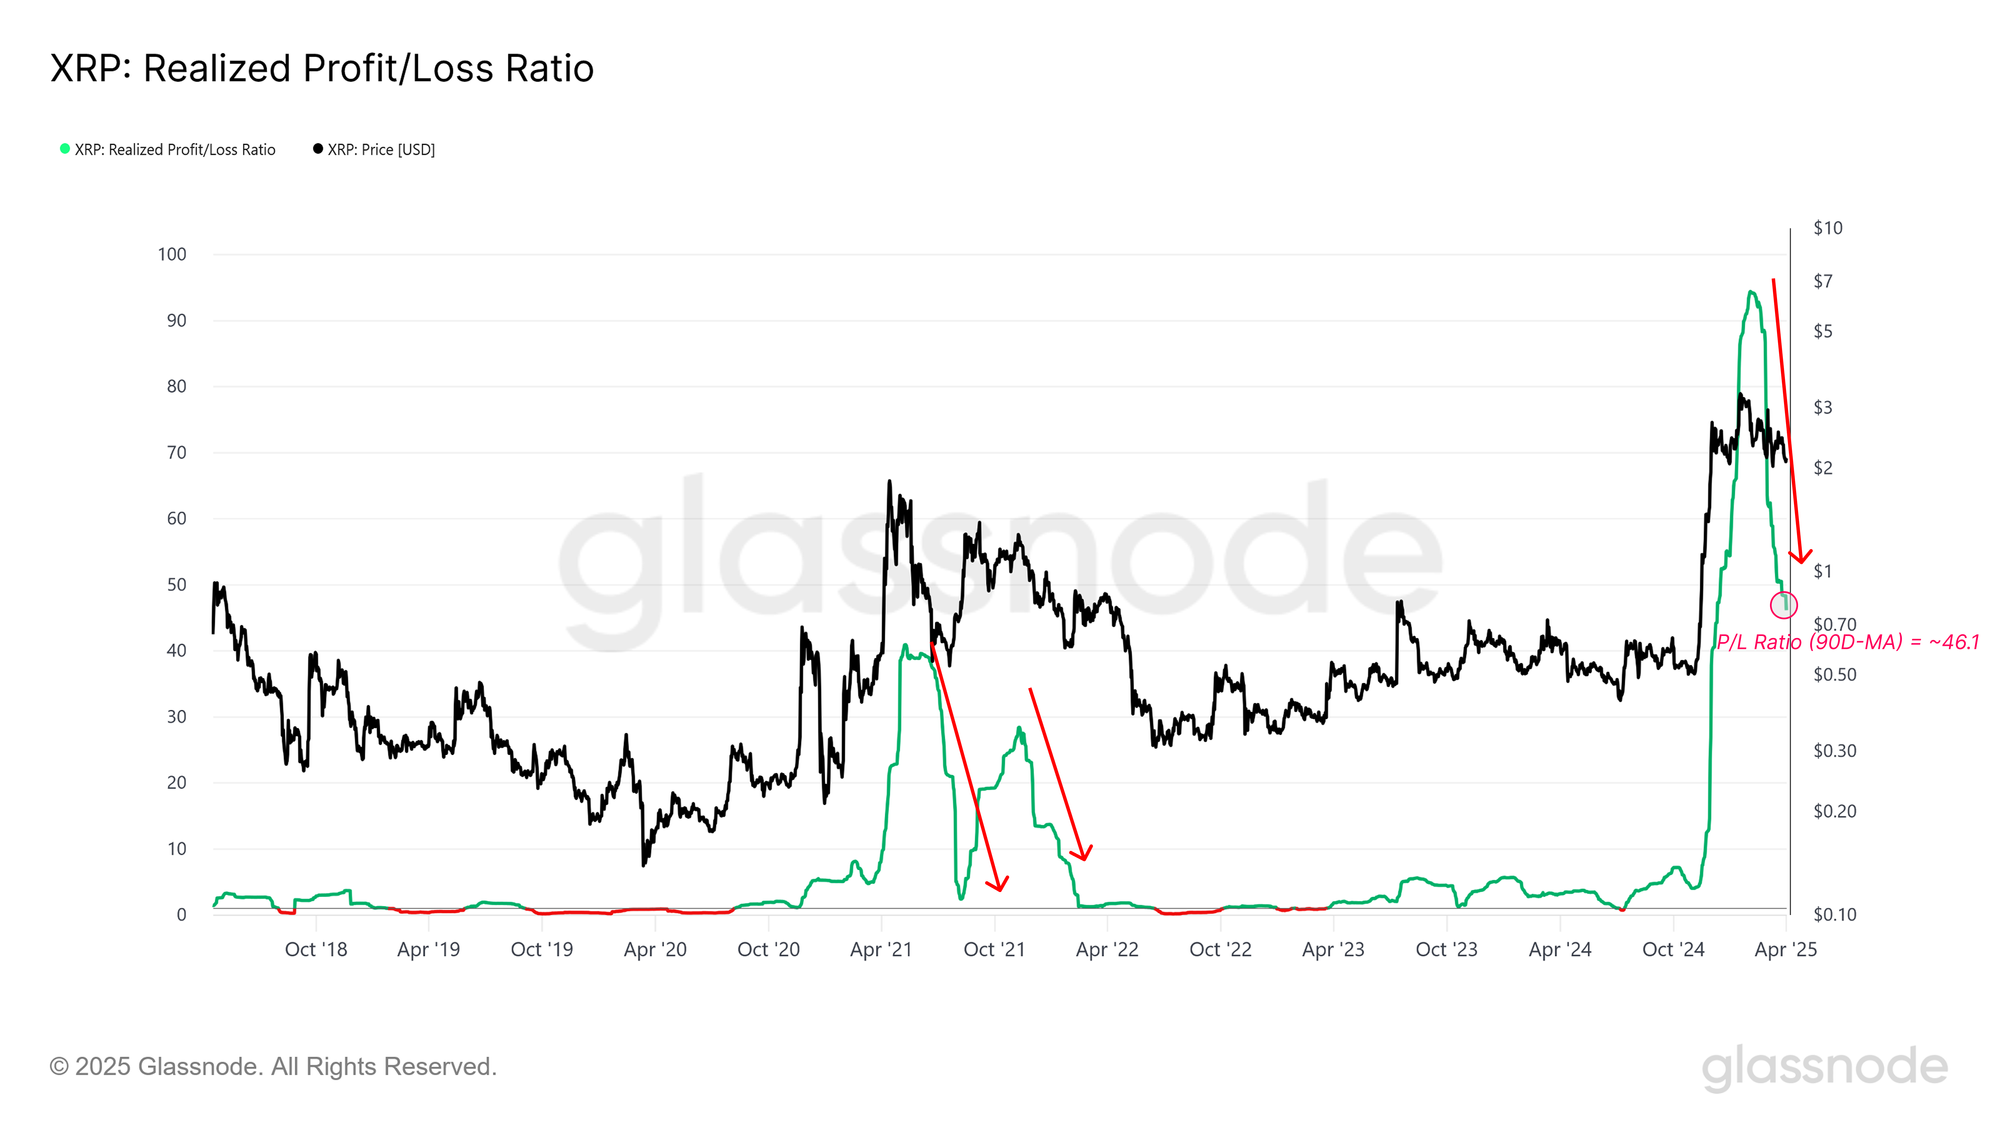
This resembles a top-heavy cost basis structure, which becomes even more concerning when we observe the Realized Loss/Profit Ratio for XRP. This metric has been in steady decline since January 2025, suggesting that investors are realizing fewer profits, and increasingly large losses.

These conditions are a common signal of waning confidence and a general move towards more fragile, higher-risk conditions. Given the retail-dominated inflows, and largely concentrated wealth in relatively new hands, this alludes to a condition where retail investor confidence may be slipping, both in XRP, but may also be extended across the broader market.
Live Chart

Summary and Conclusions

The Bitcoin market continues to digest the correction after the $109k ATH, with signs of increasing losses held, and locked in by investors. Although the price has stabilized above an area of demand around $76k–$80k, several on-chain momentum indicators suggest these may be relief rallies within a broader downtrend rather than the beginning of a sustainable reversal.

Analysis of XRP network trends also offers a proxy view for the magnitude of the risk appetite of retail investors. The asset has seen a dramatic uptick in address activity, capital inflows, and realized cap growth over the last 6-months. However, this enthusiasm appears to have reached a saturation point as profit-taking wanes, and losses have started to accelerate. The XRP market is showing signs of a top-heavy structure, with many investors caught on a relatively high-cost basis.

Altogether, this data reinforces a case where Bitcoin's correction is meaningful in scale but has not yet reached the severity of previous bear markets. For more speculative assets like XRP, demand may have already peaked, suggesting caution may be warranted until signs of a robust recovery start to emerge.


Disclaimer: This report does not provide any investment advice. All data is provided for information and educational purposes only. No investment decision shall be based on the information provided here and you are solely responsible for your own investment decisions.

Exchange balances presented are derived from Glassnode’s comprehensive database of address labels, which are amassed through both officially published exchange information and proprietary clustering algorithms. While we strive to ensure the utmost accuracy in representing exchange balances, it is important to note that these figures might not always encapsulate the entirety of an exchange’s reserves, particularly when exchanges refrain from disclosing their official addresses. We urge users to exercise caution and discretion when utilizing these metrics. Glassnode shall not be held responsible for any discrepancies or potential inaccuracies. Please read our Transparency Notice when using exchange data.


Lecturas Relacionadas

Retail Investors' 'Lead Brother' Serenity vs. Newly Minted Stock God Leopold: How Are the Two Top Hunters Mining AI's 'Physical Limits'?

The article profiles two prominent figures, Serenity and Leopold Aschenbrenner, who are gaining attention for their unconventional investment strategies focused on the physical constraints of the AI boom, moving beyond mainstream software narratives. Serenity, an anonymous online trader, advocates a "shiso leaf" theory. He targets small-cap companies with monopolies on critical, overlooked components in the AI hardware supply chain, such as specific semiconductor materials. His deep, technical analysis of bottlenecks in areas like co-packaged optics (CPO) has reportedly yielded massive returns, though his anonymity and focus on illiquid micro-cap stocks pose significant risks for followers. Leopold Aschenbrenner, a former OpenAI researcher, founded a multi-billion dollar hedge fund. His macro thesis argues that physical infrastructure—power grids, land, data centers—is the true bottleneck for AI growth, lagging far behind chip production. Consequently, his fund employs an infrastructure arbitrage strategy: heavily investing in storage and compute infrastructure companies while placing massive bearish bets (put options) against major semiconductor stocks, betting their valuations will correct as physical constraints become apparent. While their methods differ—Serenity drills into microscopic supply chain details, while Leopold takes a macroscopic, infrastructure-focused view—both share a core belief: the real power and investment alpha in the AI era lie in controlling scarce physical resources, not just software. The article concludes by noting the inherent risks in both approaches, such as liquidity issues for micro-caps and timing risks for macro bets, but suggests they signal a broader market re-evaluation of AI's foundational assets.

marsbitHace 3 hora(s)

Retail Investors' 'Lead Brother' Serenity vs. Newly Minted Stock God Leopold: How Are the Two Top Hunters Mining AI's 'Physical Limits'?

marsbitHace 3 hora(s)

Who Will Make Money in the Age of Agents?

In the Agents era of blockchain, traditional value capture theories face challenges. The "Fat Protocol" theory, dominant since 2016, suggested protocols capture most value as their tokens are essential for network use. However, the proliferation of interchangeable L1s, L2s, and modular layers has eroded protocol scarcity and pricing power. Conversely, the "Fat App" theory posits that applications capturing user relationships (like wallets and exchanges) become the primary value layer by controlling distribution and transaction flows. This aligns with the current "Great Repricing" cycle. Agents disrupt this logic. As software users, they lack brand loyalty, prioritize cost and efficiency, and switch between platforms seamlessly. This undermines the front-end UX moats that "Fat Apps" rely on. The article explores several potential futures: 1. **Headless Applications:** Current leading apps could strip their front-ends and become backend API infrastructure for Agents, preserving their role. 2. **Protocol Resurgence:** If integration becomes trivial, Agents might bypass aggregators and interact directly with protocols, reviving "Fat Protocol" dynamics. 3. **Pricing Power Collapse:** Agents' rational, frictionless routing could commoditize the entire stack, compressing margins toward cost and leaving little profit for intermediaries. 4. **Unprecedented Activity:** Agents may enable new, high-frequency, machine-to-machine economic activities, expanding the total value pie even if margins are thin. 5. **A New, Unnamed Model:** Historically, major tech shifts (like the internet's attention economy) create unforeseen business models. The Agents era may spawn entirely new ways to capture value. The most likely outcome is a coexistence where "Fat Apps" continue to serve human users valuing UX, while a separate, Agent-driven economy emerges governed by different rules—where loyalty is based on factors like liquidity, latency, and settlement guarantees rather than brand.

marsbitHace 4 hora(s)

Who Will Make Money in the Age of Agents?

marsbitHace 4 hora(s)

Trading

Spot
Futuros

Artículos destacados

Qué es BITCOIN

Entendiendo HarryPotterObamaSonic10Inu (ERC-20) y Su Posición en el Espacio Cripto En los últimos años, el mercado de criptomonedas ha sido testigo de un aumento en la popularidad de las monedas meme, capturando el interés no solo de los comerciantes, sino también de aquellos que buscan compromiso comunitario y valor de entretenimiento. Entre estos tokens únicos se encuentra HarryPotterObamaSonic10Inu (ERC-20), un proyecto intrigante que mezcla referencias culturales en el tejido de las criptomonedas. Este artículo profundiza en los aspectos clave de HarryPotterObamaSonic10Inu, explorando sus mecanismos, ethos impulsado por la comunidad y su relación con el paisaje cripto más amplio. ¿Qué es HarryPotterObamaSonic10Inu (ERC-20)? Como su nombre sugiere, HarryPotterObamaSonic10Inu es una moneda meme construida sobre la blockchain de Ethereum, clasificada bajo el estándar ERC-20. A diferencia de las criptomonedas tradicionales que pueden enfatizar la utilidad práctica o el potencial de inversión, este token prospera en el valor de entretenimiento y la fuerza de su comunidad. El proyecto tiene como objetivo fomentar un entorno donde los usuarios comprometidos puedan reunirse, compartir ideas y participar en actividades inspiradas por diversos fenómenos culturales. Una característica notable de HarryPotterObamaSonic10Inu es su cero impuestos en las transacciones. Este atractivo elemento tiene como objetivo incentivar el comercio y la participación comunitaria, sin cargos adicionales que puedan disuadir a los comerciantes de pequeña escala. El suministro total de la moneda está establecido en mil millones de tokens, una cifra que marca su intención de mantener una circulación sustancial dentro de la comunidad. Creador de HarryPotterObamaSonic10Inu (ERC-20) Los orígenes de HarryPotterObamaSonic10Inu están algo envueltos en misterio; los detalles sobre el creador siguen siendo desconocidos. El desarrollo de este token carece de un equipo identificable o de un plan explícito, lo cual no es inusual dentro del sector de monedas meme. En cambio, el proyecto ha surgido de manera orgánica, con su progreso muy dependiente del entusiasmo y la participación de su comunidad. Inversores de HarryPotterObamaSonic10Inu (ERC-20) En cuanto a inversiones externas y respaldo, HarryPotterObamaSonic10Inu también sigue siendo ambiguo. El token no lista ninguna fundación de inversión conocida o apoyo organizacional significativo. En cambio, la savia del proyecto es su comunidad de base, que informa su crecimiento y sostenibilidad a través de la acción colectiva y el compromiso en el espacio cripto. ¿Cómo Funciona HarryPotterObamaSonic10Inu (ERC-20)? Como una moneda meme, HarryPotterObamaSonic10Inu opera principalmente fuera de los marcos tradicionales que a menudo rigen el valor de los activos. Hay varios aspectos distintivos que definen cómo funciona el proyecto: Transacciones Sin Impuestos: Sin tarifas impositivas en las transacciones, los usuarios pueden comprar y vender el token libremente sin preocuparse por costos ocultos. Compromiso Comunitario: El proyecto prospera en la interacción comunitaria, aprovechando plataformas de redes sociales para crear entusiasmo y facilitar la participación. Las discusiones, el intercambio de contenido y el compromiso son elementos cruciales que ayudan a expandir su alcance y fomentar la lealtad entre los seguidores. Sin Utilidad Práctica: Cabe señalar que HarryPotterObamaSonic10Inu no ofrece utilidad concreta dentro del ecosistema financiero. Más bien, se clasifica como un token principalmente para actividades de entretenimiento y comunitarias. Referencia Cultural: El token incorpora astutamente elementos de la cultura popular para atraer interés, conectando con entusiastas de los memes y seguidores de las criptomonedas por igual. HarryPotterObamaSonic10Inu ejemplifica cómo las monedas meme operan de manera diferente a los proyectos de criptomonedas más tradicionales, ingresando al mercado como construcciones sociales innovadoras en lugar de activos utilitarios. Cronología de HarryPotterObamaSonic10Inu (ERC-20) La historia de HarryPotterObamaSonic10Inu está marcada por varios hitos notables: Creación: El token surgió de un meme viral, capturando la imaginación de muchos entusiastas de las criptomonedas. Las fechas específicas de creación no están disponibles, subrayando su ascenso orgánico. Listado en Exchanges: HarryPotterObamaSonic10Inu ha llegado a varios exchanges, permitiendo un acceso y comercio más fácil por parte de la comunidad. Iniciativas de Compromiso Comunitario: Actividades continuas destinadas a mejorar la interacción comunitaria, incluyendo concursos, campañas en redes sociales y generación de contenido por parte de fanáticos y defensores. Planes de Expansión Futuros: La hoja de ruta del proyecto incluye el lanzamiento de una colección de NFT, mercancía y un sitio de comercio electrónico relacionado con sus temas culturales, involucrando aún más a la comunidad e intentando añadir más dimensiones a su ecosistema. Puntos Clave Sobre HarryPotterObamaSonic10Inu (ERC-20) Naturaleza Impulsada por la Comunidad: El proyecto prioriza la participación colectiva y la creatividad, asegurando que la involucración de los usuarios esté a la vanguardia de su desarrollo. Clasificación como Moneda Meme: Representa la epítome de las criptomonedas basadas en el entretenimiento, diferenciándose de los vehículos de inversión tradicionales. Sin Afiliación Directa con Bitcoin: A pesar de la similitud en el nombre del ticker, HarryPotterObamaSonic10Inu es distinto y no tiene relación con Bitcoin u otras criptomonedas establecidas. Enfoque en la Colaboración: HarryPotterObamaSonic10Inu está diseñado para crear un espacio para la colaboración y el intercambio de historias entre sus poseedores, proporcionando una vía para la creatividad y el vínculo comunitario. Perspectivas Futuras: La ambición de expandirse más allá de su premisa inicial hacia NFTs y mercancías describe un camino para que el proyecto potencialmente ingrese a avenidas más tradicionales dentro de la cultura digital. A medida que las monedas meme continúan capturando la imaginación de la comunidad de criptomonedas, HarryPotterObamaSonic10Inu (ERC-20) se destaca debido a sus lazos culturales y su enfoque centrado en la comunidad. Si bien puede no encajar en el molde típico de un token impulsado por la utilidad, su esencia radica en la alegría y la camaradería fomentadas entre sus seguidores, destacando la naturaleza en evolución de las criptomonedas en una era cada vez más digital. A medida que el proyecto continúa desarrollándose, será importante observar cómo las dinámicas comunitarias influyen en su trayectoria en el cambiante paisaje de la tecnología blockchain.

1.5k Vistas totalesPublicado en 2024.04.01Actualizado en 2024.12.03

Qué es BITCOIN

Cómo comprar BTC

¡Bienvenido a HTX.com! Hemos hecho que comprar Bitcoin (BTC) sea simple y conveniente. Sigue nuestra guía paso a paso para iniciar tu viaje de criptos.Paso 1: crea tu cuenta HTXUtiliza tu correo electrónico o número de teléfono para registrarte y obtener una cuenta gratuita en HTX. Experimenta un proceso de registro sin complicaciones y desbloquea todas las funciones.Obtener mi cuentaPaso 2: ve a Comprar cripto y elige tu método de pagoTarjeta de crédito/débito: usa tu Visa o Mastercard para comprar Bitcoin (BTC) al instante.Saldo: utiliza fondos del saldo de tu cuenta HTX para tradear sin problemas.Terceros: hemos agregado métodos de pago populares como Google Pay y Apple Pay para mejorar la comodidad.P2P: tradear directamente con otros usuarios en HTX.Over-the-Counter (OTC): ofrecemos servicios personalizados y tipos de cambio competitivos para los traders.Paso 3: guarda tu Bitcoin (BTC)Después de comprar tu Bitcoin (BTC), guárdalo en tu cuenta HTX. Alternativamente, puedes enviarlo a otro lugar mediante transferencia blockchain o utilizarlo para tradear otras criptomonedas.Paso 4: tradear Bitcoin (BTC)Tradear fácilmente con Bitcoin (BTC) en HTX's mercado spot. Simplemente accede a tu cuenta, selecciona tu par de trading, ejecuta tus trades y monitorea en tiempo real. Ofrecemos una experiencia fácil de usar tanto para principiantes como para traders experimentados.

4.9k Vistas totalesPublicado en 2024.12.12Actualizado en 2025.03.21

Cómo comprar BTC

Qué es $BITCOIN

ORO DIGITAL ($BITCOIN): Un Análisis Integral Introducción al ORO DIGITAL ($BITCOIN) ORO DIGITAL ($BITCOIN) es un proyecto basado en blockchain que opera en la red Solana, cuyo objetivo es combinar las características de los metales preciosos tradicionales con la innovación de las tecnologías descentralizadas. Aunque comparte un nombre con Bitcoin, a menudo referido como “oro digital” debido a su percepción como un refugio de valor, ORO DIGITAL es un token separado diseñado para crear un ecosistema único dentro del paisaje Web3. Su meta es posicionarse como un activo digital alternativo viable, aunque los detalles sobre sus aplicaciones y funcionalidades aún están en desarrollo. ¿Qué es ORO DIGITAL ($BITCOIN)? ORO DIGITAL ($BITCOIN) es un token de criptomoneda diseñado explícitamente para su uso en la blockchain de Solana. A diferencia de Bitcoin, que proporciona un papel de almacenamiento de valor ampliamente reconocido, este token parece centrarse en aplicaciones y características más amplias. Aspectos notables incluyen: Infraestructura Blockchain: El token está construido sobre la blockchain de Solana, conocida por su capacidad para manejar transacciones de alta velocidad y bajo costo. Dinámicas de Suministro: ORO DIGITAL tiene un suministro máximo limitado a 100 cuatrillones de tokens (100P $BITCOIN), aunque los detalles sobre su suministro circulante no se han divulgado actualmente. Utilidad: Si bien las funcionalidades precisas no están delineadas explícitamente, hay indicios de que el token podría ser utilizado para diversas aplicaciones, potencialmente involucrando aplicaciones descentralizadas (dApps) o estrategias de tokenización de activos. ¿Quién es el Creador de ORO DIGITAL ($BITCOIN)? En la actualidad, la identidad de los creadores y el equipo de desarrollo detrás de ORO DIGITAL ($BITCOIN) sigue siendo desconocida. Esta situación es típica entre muchos proyectos innovadores dentro del espacio blockchain, particularmente aquellos alineados con las finanzas descentralizadas y fenómenos de monedas meme. Si bien tal anonimato puede fomentar una cultura impulsada por la comunidad, intensifica las preocupaciones sobre la gobernanza y la responsabilidad. ¿Quiénes son los Inversores de ORO DIGITAL ($BITCOIN)? La información disponible indica que ORO DIGITAL ($BITCOIN) no tiene patrocinadores institucionales conocidos ni inversiones destacadas de capital de riesgo. El proyecto parece operar en un modelo de peer-to-peer centrado en el apoyo y la adopción de la comunidad en lugar de rutas de financiamiento tradicionales. Su actividad y liquidez se sitúan principalmente en intercambios descentralizados (DEX), como PumpSwap, en lugar de plataformas de trading centralizadas establecidas, lo que resalta aún más su enfoque de base. Cómo Funciona ORO DIGITAL ($BITCOIN) Los mecanismos operativos de ORO DIGITAL ($BITCOIN) pueden elaborarse en función de su diseño blockchain y atributos de red: Mecanismo de Consenso: Al aprovechar el único proof-of-history (PoH) de Solana combinado con un modelo de proof-of-stake (PoS), el proyecto asegura una validación de transacciones eficiente que contribuye al alto rendimiento de la red. Tokenómica: Si bien los mecanismos deflacionarios específicos no se han detallado extensamente, el vasto suministro máximo de tokens implica que podría atender microtransacciones o casos de uso nicho que aún están por definirse. Interoperabilidad: Existe el potencial de integración con el ecosistema más amplio de Solana, incluyendo varias plataformas de finanzas descentralizadas (DeFi). Sin embargo, los detalles sobre integraciones específicas permanecen no especificados. Cronología de Eventos Clave Aquí hay una cronología que destaca hitos significativos relacionados con ORO DIGITAL ($BITCOIN): 2023: El despliegue inicial del token ocurre en la blockchain de Solana, marcado por su dirección de contrato. 2024: ORO DIGITAL gana visibilidad al estar disponible para trading en intercambios descentralizados como PumpSwap, permitiendo a los usuarios comerciar contra SOL. 2025: El proyecto presencia actividad de trading esporádica y potencial interés en compromisos liderados por la comunidad, aunque no se han documentado asociaciones notables o avances técnicos hasta el momento. Análisis Crítico Fortalezas Escalabilidad: La infraestructura subyacente de Solana soporta altos volúmenes de transacciones, lo que podría mejorar la utilidad de $BITCOIN en varios escenarios de transacción. Accesibilidad: El potencial bajo precio de trading por token podría atraer a inversores minoristas, facilitando una participación más amplia debido a oportunidades de propiedad fraccionada. Riesgos Falta de Transparencia: La ausencia de patrocinadores, desarrolladores o un proceso de auditoría conocidos públicamente puede generar escepticismo sobre la sostenibilidad y confiabilidad del proyecto. Volatilidad del Mercado: La actividad de trading depende en gran medida del comportamiento especulativo, lo que puede resultar en una volatilidad de precios significativa y en incertidumbre para los inversores. Conclusión ORO DIGITAL ($BITCOIN) surge como un proyecto intrigante pero ambiguo dentro del ecosistema de Solana en rápida evolución. Si bien intenta aprovechar la narrativa del “oro digital”, su alejamiento del papel establecido de Bitcoin como refugio de valor subraya la necesidad de una diferenciación más clara de su utilidad y estructura de gobernanza previstas. La aceptación y adopción futura dependerán probablemente de abordar la actual opacidad y de definir sus estrategias operativas y económicas de manera más explícita. Nota: Este informe abarca información sintetizada disponible hasta octubre de 2023, y pueden haber ocurrido desarrollos más allá del período de investigación.

83 Vistas totalesPublicado en 2025.05.13Actualizado en 2025.05.13

Qué es $BITCOIN

Discusiones

Bienvenido a la comunidad de HTX. Aquí puedes mantenerte informado sobre los últimos desarrollos de la plataforma y acceder a análisis profesionales del mercado. A continuación se presentan las opiniones de los usuarios sobre el precio de BTC (BTC).

活动图片