This Bitcoin price fractal from 2018 could trap bulls, sink BTC price to $25K — analyst

CointelegraphPublicado a 2022-02-15Actualizado a 2022-02-16

Resumen

The eerie fractal risks sending Bitcoin's price to $25,000 despite its sharp recovery in the previous weeks.

A recent price recovery in the Bitcoin (BTC) market risks getting erased due to an eerie fractal from 2018.

Bitcoin price cycle similarities

First spotted by CryptoBullet, an independent market analyst, the fractal shows Bitcoin recreating an inverse head-and-shoulders (IH&S) pattern that preceded its price decline toward $3,100 later in December 2018. As a result, anticipations that BTC's price will undergo similar declines in 2022 might grow.

That is primarily because of the strikingly similar price trends between the pric downtrends in 2018 and 2021-2022. For instance, Bitcoin formed two higher highs in April and May 2018 around $10,000 before plunging below $6,000 in July while constructing the IH&S pattern.

BTC/USD daily price chart featuring IH&S fractal from 2018. Source: TradingView

Interestingly, in October 2021-February 2022, Bitcoin underwent an identical price trajectory, forming two higher highs — near $65,000 in April and $69,000 in November. Later, the price corrected to below $33,000 in early February while forming another IH&S pattern.

With IH&S being a bullish reversal pattern, BTC now awaits a breakout move towards or above $50,000. A similar technical setup shared by market analyst Lark Davis projects Bitcoin above $60,000.

2018 BTC price fractal risks trapping bulls

But a climb to $50,000 — or even $60,000 — may not absolve Bitcoin from its prevailing bearish bias. If the 2018 fractal repeats itself religiously in 2022, BTC's likelihood of falling toward $25,000 appears higher, as explained in the chart below.
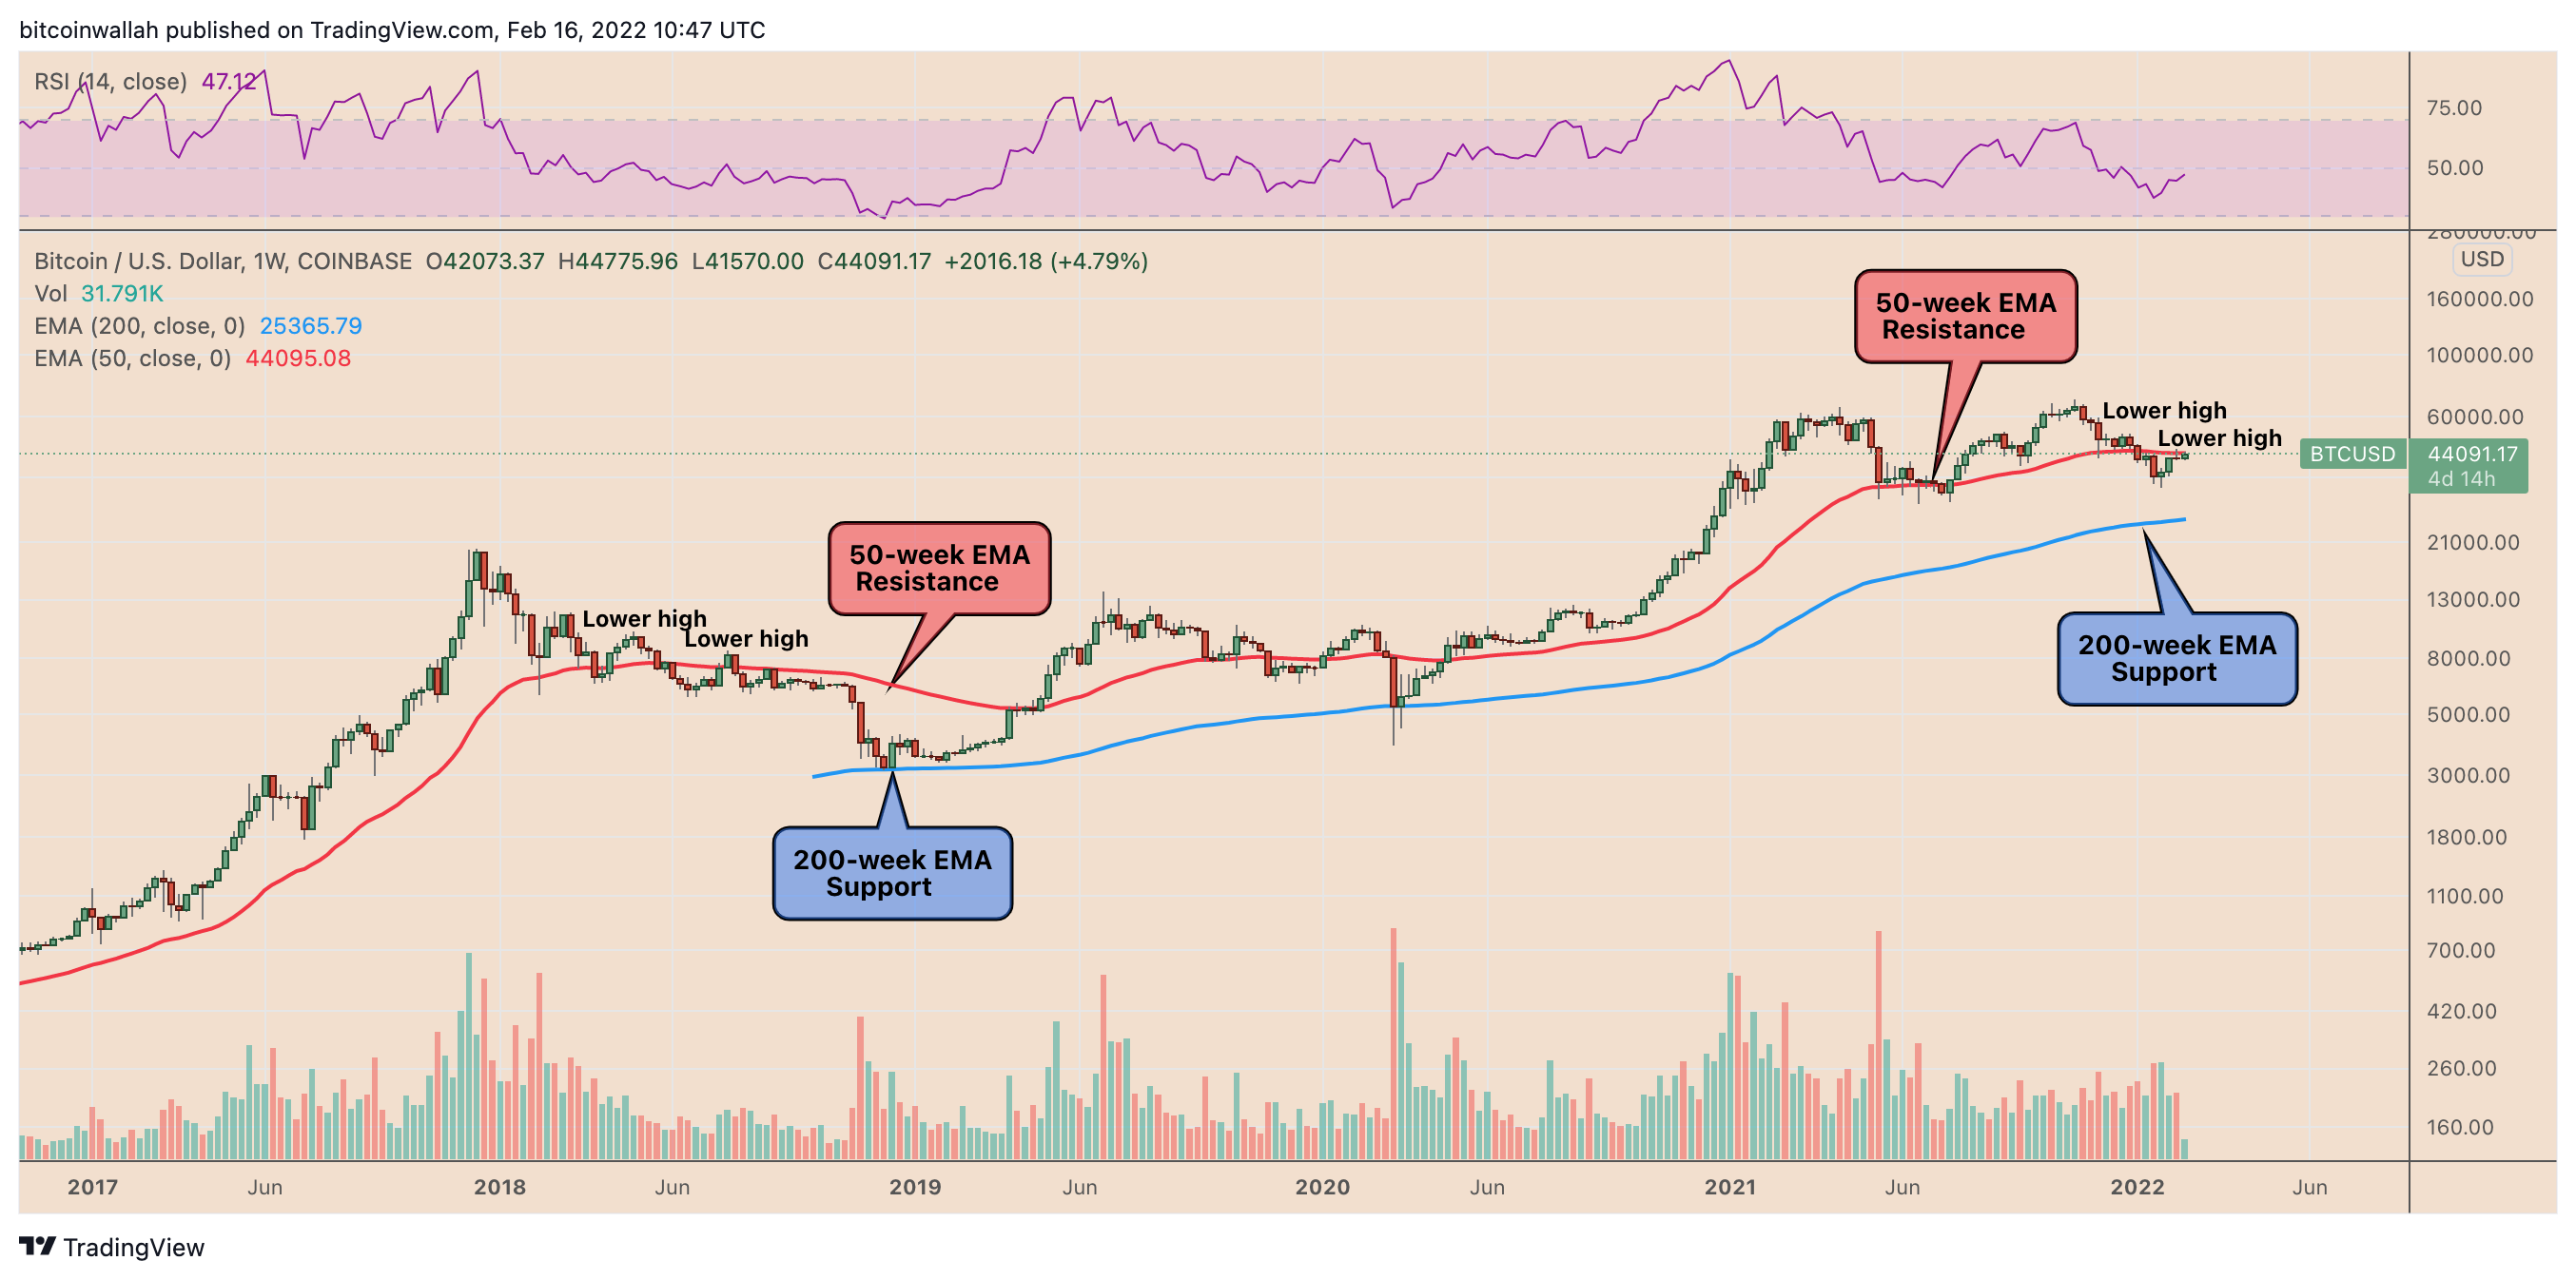
BTC/USD weekly price chart. Source: TradingView

Notably, the 2018 price action saw Bitcoin breaking out to the upside after its IH&S formation, reaching almost $10,000.

In doing so, BTC's price briefly reclaimed its 50-week exponential moving average (50-week EMA; the red wave) as support, only to break below it later. As it did, the price further declined towards the 200-week EMA (the blue wave) near $3,000, where it bottomed out in December 2018.

Applying the same fractal to the ongoing price action, Bitcoin might end up closing above its 50-week EMA, eventually hitting levels in the $50,000-$60,000 range. Nonetheless, it will move back below the red wave, and extend its decline towards the 200-week EMA, which sits near $25,000.

The negative outlook aligns with what Ari Rudd, an independent market analyst, shared in a Twitter thread on Feb. 14.

As Cointelegraph covered, the chartist cited Logarithmic Fractal Growth and moving average ribbon supports, suggesting that BTC's price might fall to the $24,000-$27,000 range in the coming months.

Not another 2018?

On the brighter side, Bitcoin has been treading ahead against more optimistic fundamentals than in 2018. Notably, BTC's price has rallied from under $4,000 in March 2020 to as high as $69,000 in November 2021, amid an increase in retail and institutional adoption led by macroeconomic risks such as higher inflation.

A November 2021 opinion editorial penned by Bloomberg Opinion’s John Authers points out that headline inflation, the consumer price index (CPI), rose roughly 28% in the past ten years. But denominating the same gauge in Bitcoin returned 99.99% deflation. But the mathematics came with a warning.

"If you put all your life savings into bitcoin a decade ago, well done. Should you do that now? Perhaps not," wrote Authers, adding:

"Over the last 10 years, bitcoin has delivered a lot of deflation, including 76% in the last 12 months alone, but also a couple of terrifying episodes when annual inflation ran at more than 200%."

Interestingly, the "terrifying episodes" occurred during the bearish cycles of 2015 and 2018.
Lecturas Relacionadas

To Hike or Not Tonight: Economists Unanimous on 'No', Markets Price in a 30% Chance

Federal funds futures are repricing ahead of the July FOMC decision, as traders pay a higher premium for the risk of a surprise rate hike or more hawkish signals. This contrasts with economists, where a Reuters survey of 104 analysts unanimously expects rates to remain unchanged at 3.50%-3.75%, with 78 foreseeing no change through year-end. Yet, futures markets have priced in about a 30% probability of a 25-basis-point hike. The core debate, especially under new Fed Chair Kevin Warsh, centers on how the Fed will respond to the oil price shock from Middle East tensions. The market is not necessarily predicting a hike tonight but is hedging against two tail risks: an immediate rate increase, or a hold combined with communication that seriously opens the door for a September hike. This hedging activity has driven up open interest in Fed funds futures. Analysts are divided on how to weight the oil price surge in the Fed's reaction function. Hawkish voices (e.g., BofA) worry that completely dismissing the price pressure could challenge the Fed's inflation credibility in Warsh's first major test. Dovish views (e.g., Citi) argue the shock is primarily supply-driven and that overreacting with rate hikes could unnecessarily hurt growth, unless clear signs of secondary inflation emerge. Warsh's new tenure amplifies policy path uncertainty, as markets lack a stable baseline for his communication style. This environment forces traders to price in a wider range of outcomes, explaining the divergence between unanimous economist forecasts and market hedging. The key focus will be on Warsh's post-meeting commentary. If he downplays the oil shock and stresses anchored long-term expectations, hawkish pricing may recede. If he emphasizes the risk of broader price spillovers and prioritizes returning to 2% inflation, the market will interpret this as reopening the door for a September hike. This would sustain support for the USD, keep pressure on JPY (testing intervention thresholds), and challenge risk assets like stocks and crypto through higher discount rates and weaker sentiment. The baseline remains no action in July, but the communication will determine how far this repricing extends.

marsbitHace 48 min(s)

To Hike or Not Tonight: Economists Unanimous on 'No', Markets Price in a 30% Chance

marsbitHace 48 min(s)

The Semiconductor Industry's Most Obscure Chokepoint Material: It Has Multiplied in Price Unnoticed, and China Just Banned Its Export

"Helium: The Silent Choke Point in Semiconductors" Helium, despite being the universe's second most abundant element, is critically scarce on Earth. It cannot be synthesized artificially and escapes Earth's gravity once released, making it a non-renewable resource. Yet, it is indispensable for advanced semiconductor manufacturing, requiring ultra-high purity (99.9999%) for processes like wafer etching, leak detection, and thermal management in lithography tools, with no viable substitutes. This low-profile resource, whose price has doubled unnoticed, suddenly gained attention when China imposed an export ban on July 10th. The ban is a response to a severe global shortage triggered months earlier. In March, missile attacks damaged the world's largest helium production hub in Qatar's Ras Laffan, halting a third of global supply with repairs expected to take 3-5 years. Concurrently, Russia tightened export controls, and the US sold off its federal helium reserve. Approximately 200 specialized transport containers, each worth ~$1 million, were stranded with perishable cargo. Global spot prices skyrocketed, and chipmakers like TSMC warned of potential impacts. China, which imports over 84% of its helium (primarily from Qatar and Russia), faces a severe squeeze. Despite being helium-poor, China has developed domestic extraction technology over five years, processing byproduct gases from LNG plants to produce ultra-pure helium. Domestic output, while still only covering less than 20% of demand, enabled the recent export ban aimed at securing domestic supply for its own expanding chip industry. The industry now faces "Helium Shortage 5.0." With key global sources constrained for years, this invisible gas—once wasted on party balloons—has become a critical, geopolitically charged bottleneck for chips, healthcare (MRI machines), and beyond, forcing the world to finally treat it as the finite strategic resource it is.

marsbitHace 1 hora(s)

The Semiconductor Industry's Most Obscure Chokepoint Material: It Has Multiplied in Price Unnoticed, and China Just Banned Its Export

marsbitHace 1 hora(s)

Trading

Spot
活动图片