Bitcoin Stuck In Historically Tight Range, Calm Before The Storm?

newsbtcPublicado a 2023-06-13Actualizado a 2023-06-13

Resumen

Data shows Bitcoin has been stuck in a historically tight range recently, something that could be a precursor for extreme volatility. Bitcoin 30-Day Price Range Has Compressed To Tight Values...

Data shows Bitcoin has been stuck in a historically tight range recently, something that could be a precursor for extreme volatility.
Bitcoin 30-Day Price Range Has Compressed To Tight Values
In a new tweet, the analytics firm Glassnode has looked into how volatile the asset has been recently. One way to quantify the volatility of Bitcoin is by taking the highest and lowest price points over a specific time period and calculating their percentage difference.
The timespan of interest in the context of the current discussion is the 30-day period, meaning that the volatility here is calculated by checking for the difference between the top and bottom registered during the last 30 days.
Naturally, whenever the value of this metric is high, it means that the cryptocurrency’s price has observed large fluctuations in the past month. On the other hand, low values imply that the asset has traded inside a narrow range.
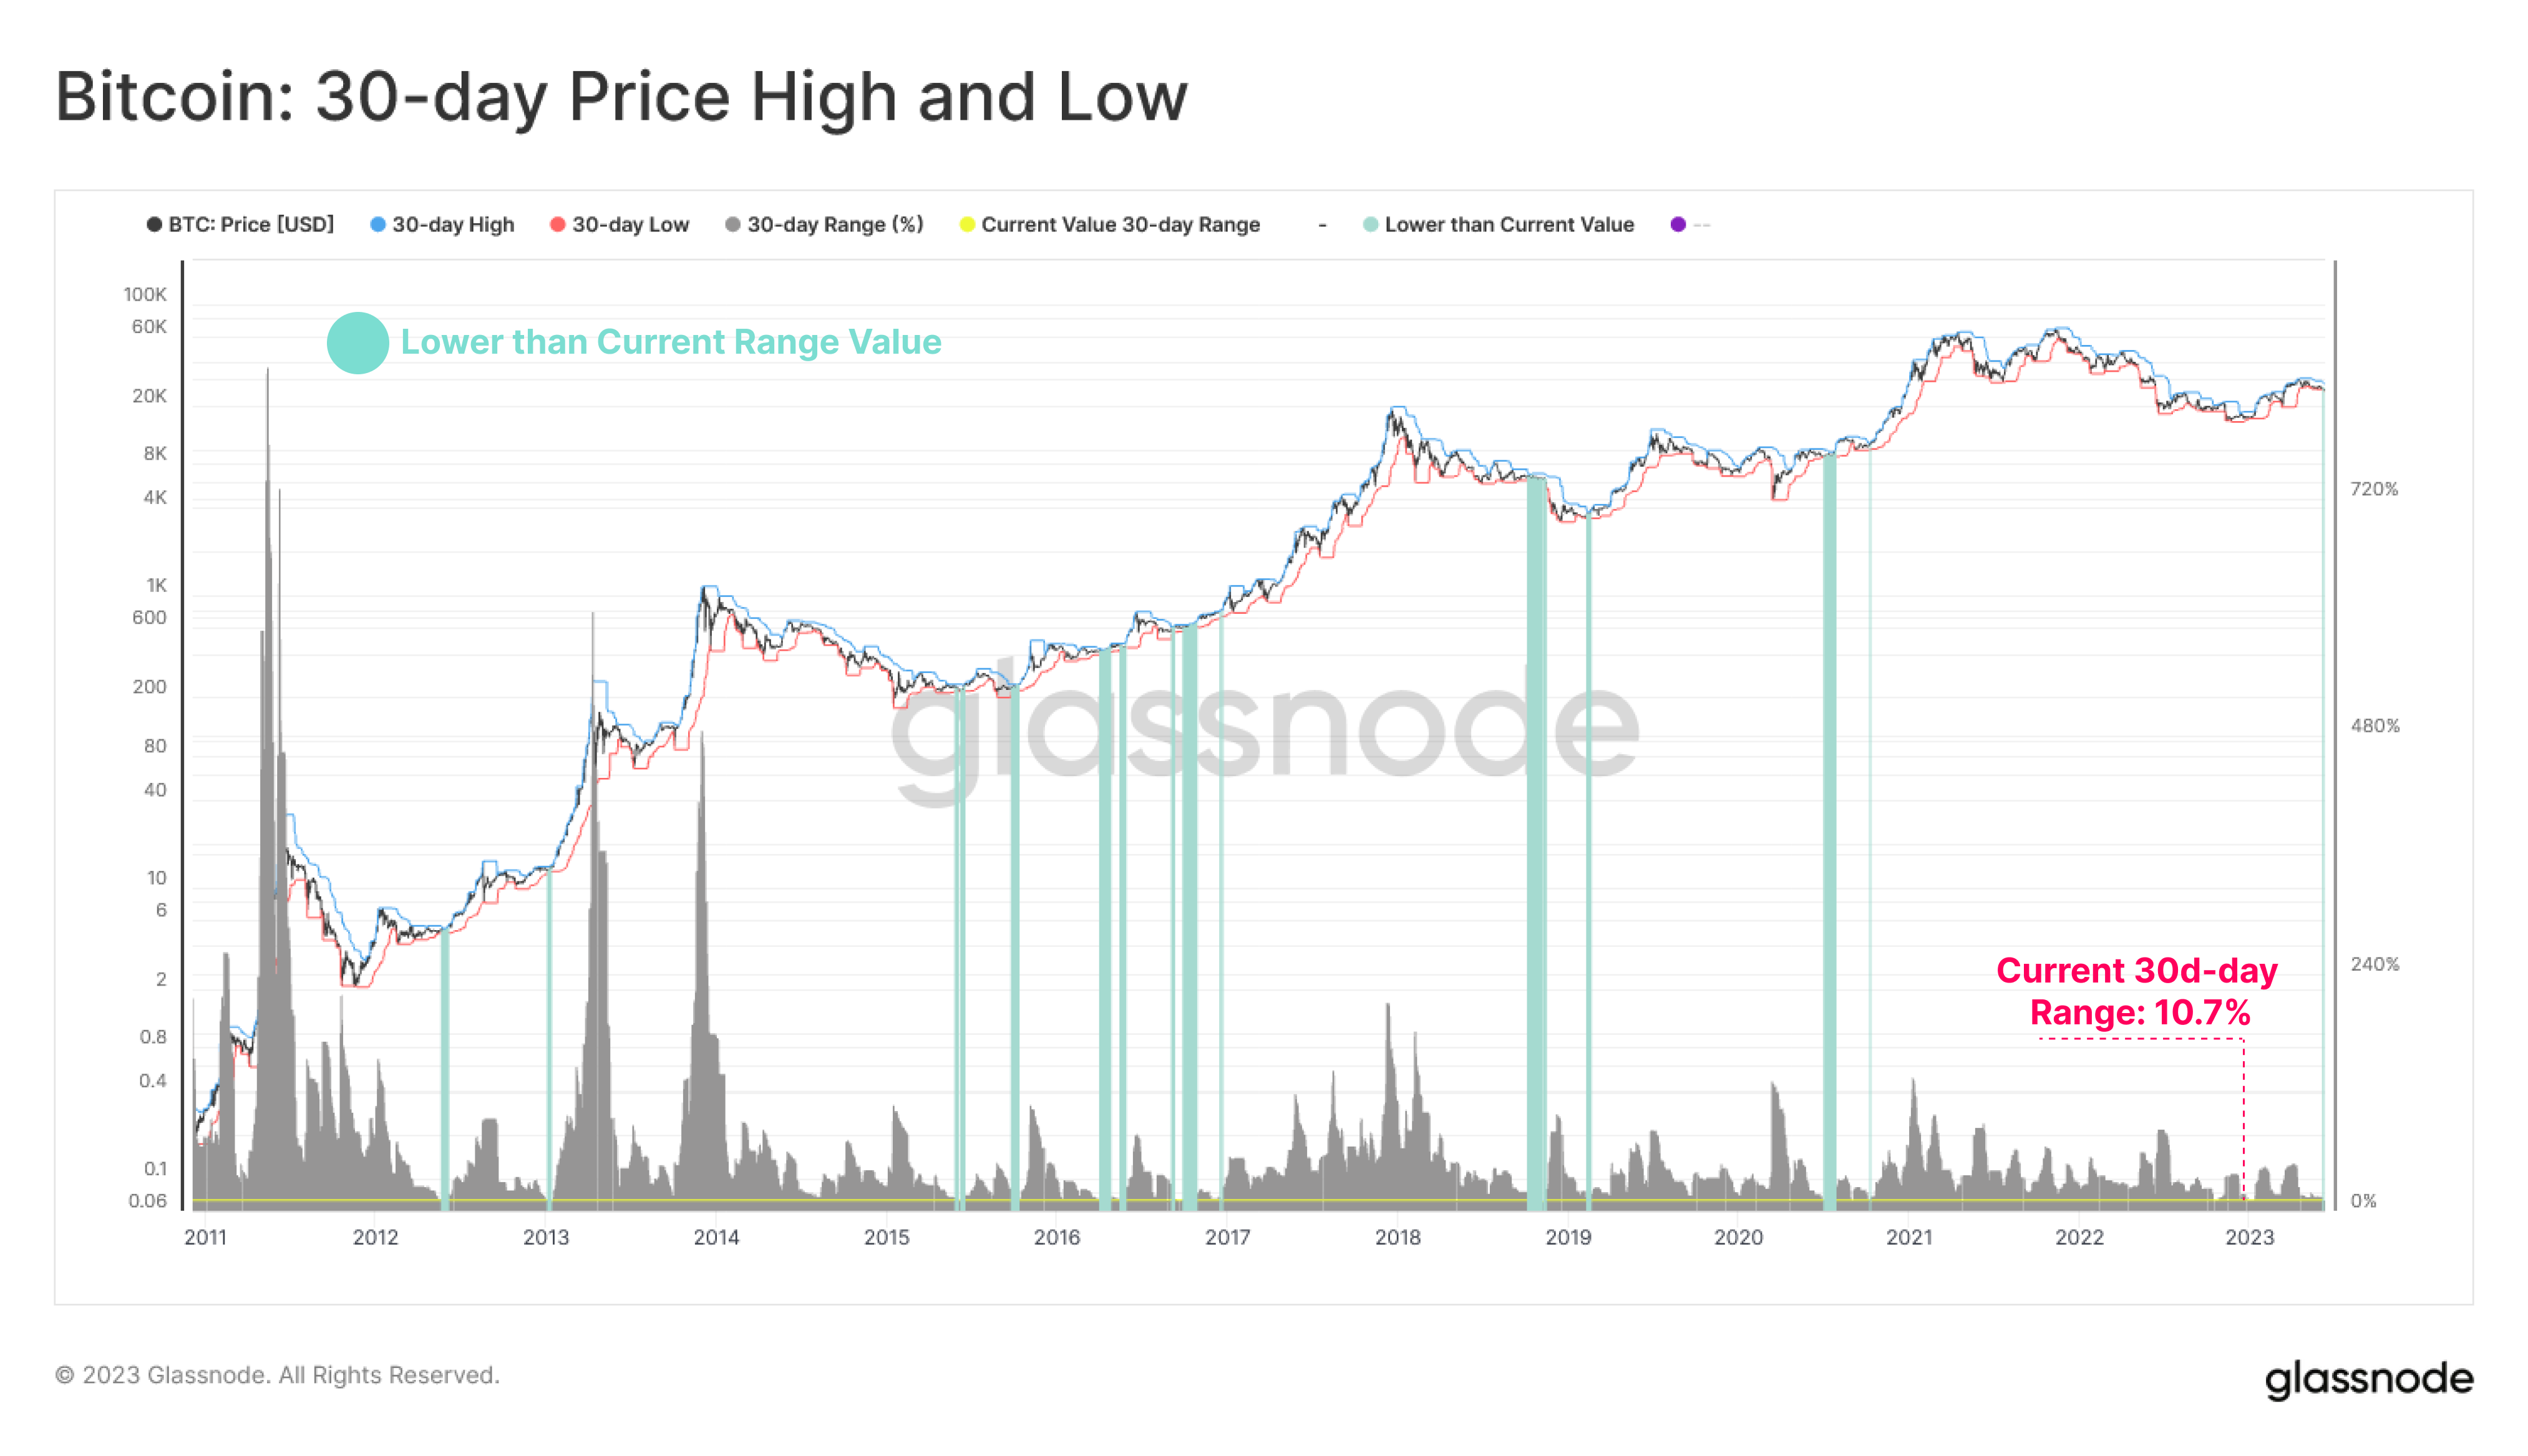
Now, here is a chart that shows the trend in the 30-day high and low, as well as the difference between the two (that is, the 30-day range), for Bitcoin over the entire history of the coin:
Bitcoin Volatility


The value of the metric seems to have been quite low in recent days | Source: Glassnode on Twitter
As displayed in the above graph, the Bitcoin 30-day range has had a value of 10.7% recently, meaning that the cryptocurrency’s price has fluctuated 10.7% between its top and bottom during the past month.
From the graph, it’s clearly visible that the current value of the indicator is very low when compared to the norm during the asset’s history. Interestingly, this is despite the fact that the BTC price has registered some fresh volatility recently due to FUD around Binance and Coinbase coming under regulatory pressure.
While the asset may have seen some short-term volatile price action following the emergence of this uncertainty in the market, Bitcoin has still overall only traded in a narrow range when looking at the grand scheme of things.

In the chart, the analytics firm has also highlighted the trading days that saw an even tighter 30-day range than the one being observed currently. As expected, it looks like there haven’t been that many instances where such a trend has taken place.
Curiously, following most of these occurrences, the Bitcoin price observed a burst of volatility as the narrow 30-day range decompressed. One prominent example of this would be the November 2018 crash, which was preceded by a period of the asset moving endlessly sideways inside a tight range. This crash occurred during the bear market of the previous cycle and lead to the formation of the cyclical bottom for it.
If the pattern followed by all these instances is anything to go by, Bitcoin may currently be approaching a narrow range that would only result in some extreme volatility for the asset in the near term.
At the time of writing, Bitcoin is trading around $25,900, down 3% in the last week.

Bitcoin Price Chart


Looks like BTC has been moving sideways since the plunge | Source: BTCUSD on TradingView
Featured image from iStock.com, charts from TradingView.com, Glassnode.com

Lecturas Relacionadas

Gold Price Achieves Strongest Rally in 46 Years, Tokenized Gold Trading Volume Already Exceeds Full-Year 2025

Gold is experiencing its strongest rally since 1979, with prices reaching a record high near $5,600 per ounce in January. This surge is driven primarily by central banks, not retail investors. In 2025, central banks net purchased 863 tonnes of gold, with a similar increase expected in 2026. Traditional gold investment methods—physical bullion and ETFs—present trade-offs like storage issues, limited access, or management fees. Tokenized gold emerges as a third option: digital tokens representing ownership of physical bars stored in professional vaults. These tokens are globally transferable in seconds, divisible, and redeemable for physical metal. The potential impact mirrors that of dollar stablecoins. Stablecoins digitized the dollar, enabling cheap, instant, global transfers and driving adoption from $27 billion in 2020 to over $3 trillion today. Similarly, tokenized gold solves gold's "form problem"—its lack of divisibility, portability, and accessibility. Adoption is accelerating. In Q1 2026, tokenized gold trading volume hit $90.7 billion, surpassing the $84.6 billion for all of 2025. Its market cap exceeded $6 billion, growing 5.5 times faster than physical gold holdings in the quarter. While concerns about counterparty risk exist, tokenized gold represents a direct claim on allocated bars, with major issuers providing regular attestation reports. Just as stablecoins placed dollars on a digital, global rail, tokenized gold now offers a more practical form for this ancient asset, potentially expanding access to billions.

marsbitHace 9 min(s)

Gold Price Achieves Strongest Rally in 46 Years, Tokenized Gold Trading Volume Already Exceeds Full-Year 2025

marsbitHace 9 min(s)

Japanese Rates Return to 1996 Levels, Can Bitcoin Withstand the September Rate Hike?

Japanese borrowing costs have hit their highest levels since 1996, with yields on 30-year bonds reaching 4.185%. This marks a significant shift for a country long reliant on negative rates. Concurrently, Bitcoin surged 22% past $80,000, seemingly decoupled from the bond market turmoil. Historically, the massive yen carry trade has fueled global risk assets, predicated on near-zero Japanese rates. This assumption is now challenged. A potential rate hike by the Bank of Japan in September could strengthen the yen, forcing carry trade unwinds and potentially triggering a global deleveraging event, as seen in August 2024 when Bitcoin fell sharply. Conversely, if the yen weakens further, Bitcoin could attract Japanese investors as a hedge against currency depreciation and the country's massive debt burden. Institutional adoption in Japan is growing, with regulatory changes paving the way for potential crypto ETFs by 2027. The key variable is the BoJ's September policy signal. If it hints at a rapid tightening cycle to combat inflation and support the yen, risk assets like Bitcoin may face selling pressure from carry trade liquidation. However, if debt sustainability concerns limit its hawkishness, leading to a weaker yen, Bitcoin could benefit. Currently, the market is betting on a slow-motion debt crisis, not a sudden collapse. While Bitcoin shows resilience, its fate remains tied to the direction of the yen and the scale of any carry trade unwind.

marsbitHace 12 min(s)

Japanese Rates Return to 1996 Levels, Can Bitcoin Withstand the September Rate Hike?

marsbitHace 12 min(s)

How Can Bitcoin Resist Quantum Computers? A Comparison of Three Lattice-Based Signature Schemes

"Bitcoin's Quantum Defense: A Comparison of Three Lattice-Based Signature Schemes" by the Blockstream Research Team explores how Bitcoin can transition to quantum-resistant digital signatures, as current schemes like Schnorr and ECDSA are vulnerable to quantum computers. The report evaluates three lattice-based signature candidates—Dilithium, Falcon, and Hawk—against criteria like on-chain cost (key/signature size), implementation complexity, deployment risks, and support for Bitcoin's key derivation standard (BIP-32). The analysis recommends a minimum Security Level 3 for Bitcoin due to its long-term security needs. Dilithium (ML-DSA) is praised for its simplicity and integer-only operations, making it easier to implement securely, but it has the largest signature size (~5.3 KB for Level 3). Falcon (FN-DSA) offers the most compact signatures (e.g., ~3.1 KB for Level 5) and the fastest verification, though its signing requires complex floating-point sampling—a solvable engineering challenge. Hawk, despite its small size, was withdrawn from NIST standardization after a security vulnerability was discovered, highlighting the importance of conservative security margins. Currently, neither Dilithium nor Falcon has a fully viable, production-ready BIP-32 key derivation method. The report concludes that if a lattice-based scheme had to be chosen now, Falcon-1024 would be the preferred option for its balance of size, speed, and mature security assumptions. However, the short-term recommendation remains hash-based signatures (like SPHINCS+) for their lower risk, with a potential future hybrid or full transition to Falcon once its standard (FN-DSA) is finalized and well-supported.

marsbitHace 14 min(s)

How Can Bitcoin Resist Quantum Computers? A Comparison of Three Lattice-Based Signature Schemes

marsbitHace 14 min(s)

Trading

Spot
活动图片