Bitcoin Out of Oversold Zone – What's Next?

Tap Chi BitcoinPublicado a 2023-05-29Actualizado a 2023-05-29

Resumen

This move means that BTC has exited the oversold zone, even if the price is not near the upper band. At press time, the relative strength index (RSI) is 43.02 — up from 38.36 on May 24.

In 7 days, the value of Bitcoin dropped 7.14% while consolidating around the $26,700 region. However, the days of sighing of relief may be near, based on a tweet issued by Gert van Lagen. It seems that this prediction is correct as the price has increased by almost 2% today and is trading at $27,189.

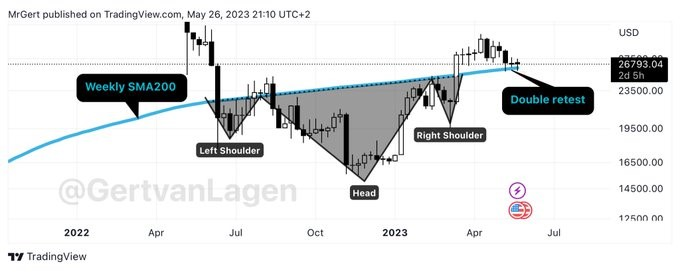
According to the technical analyst, BTC has formed a “perfect” head and shoulders pattern bottom below the 200-day Simple Moving Average (SMA). This leads to a bear trap bottom preparing for a bullish crossover.
Source: Gert van Lagen

Used by traders to identify price reversals, the bearish head and shoulders pattern has three peaks, with the top in the middle being higher than the rest. In a case like this, BTC could reverse the uptrend.

But according to Lagen's chart, this pattern depicts a trend from down to up. This is because the vertex in the middle drops extremely low relative to the edges. This signals the end of the downtrend.

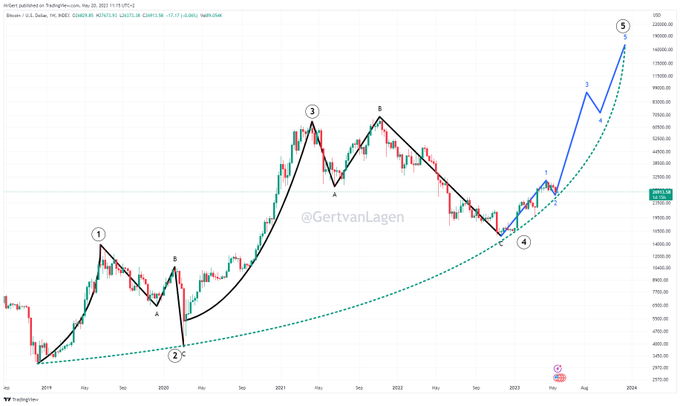
Before his latest observation, the analyst pointed out the trend of impulse, correction and historic recession peak. He noted that that is the current situation for BTC.

On May 20, he said that Bitcoin could match a large degree of bullish movement, as described by the Elliotwave impulse.
Source: Gert van Lagen

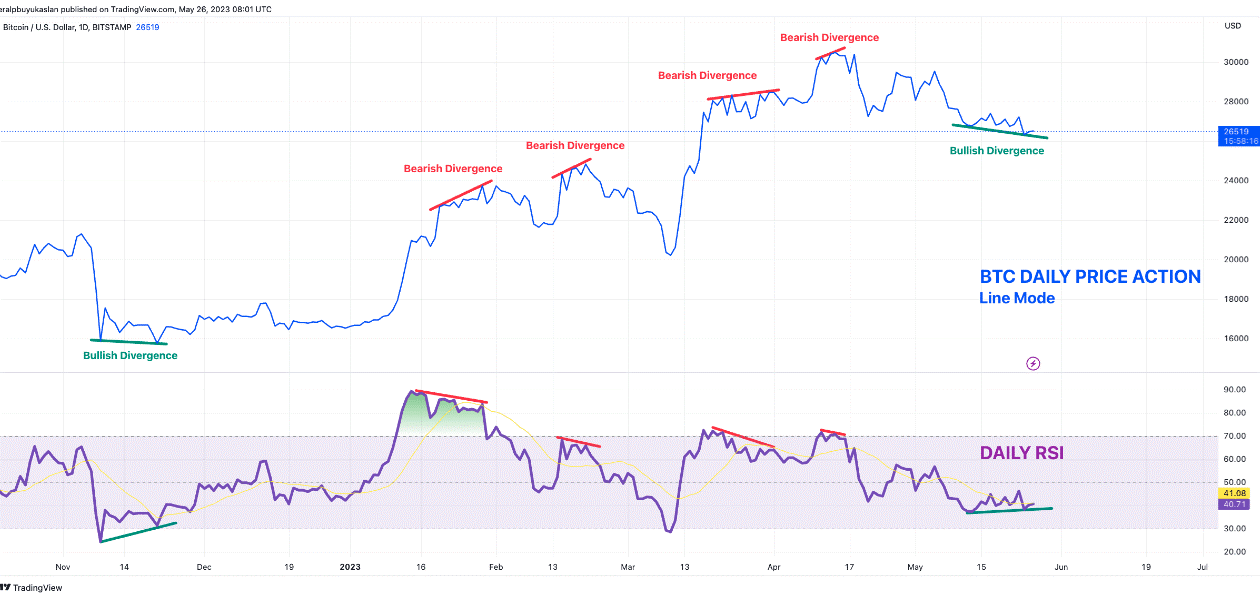
Interestingly, Lagen isn't the only one who shares the optimism. In a May 26 publication on CryptoQuant, BTC is forming a bullish divergence similar to the exit point from the bearish peak of November 2022.
Source: CryptoQuant

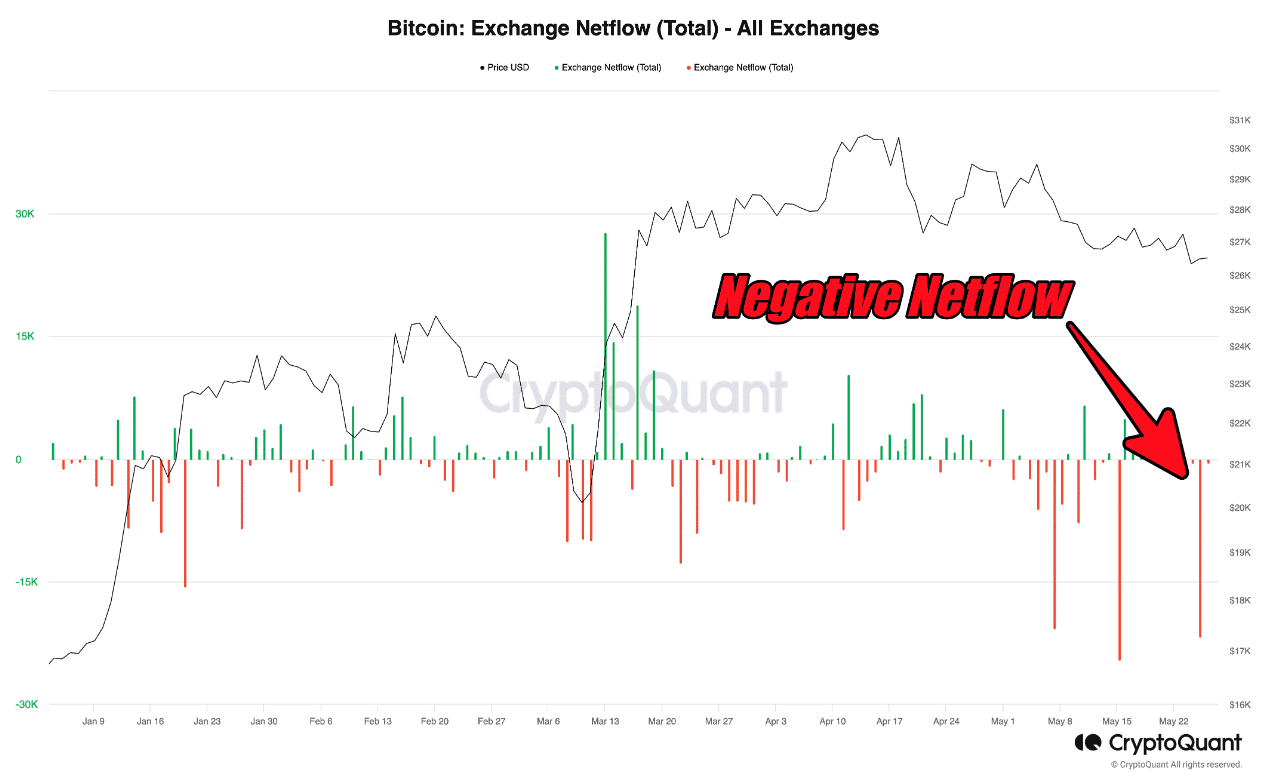
Investors and analysts also point to the exchange's negative net flow as another reason for the short-term bullish move. When the indicator is negative, it means that the outflow is overwhelming the inflow.

Therefore, when this persists, it could be a sign of accumulation and turning into an uptrend in the asset's price.
Source: CryptoQuant

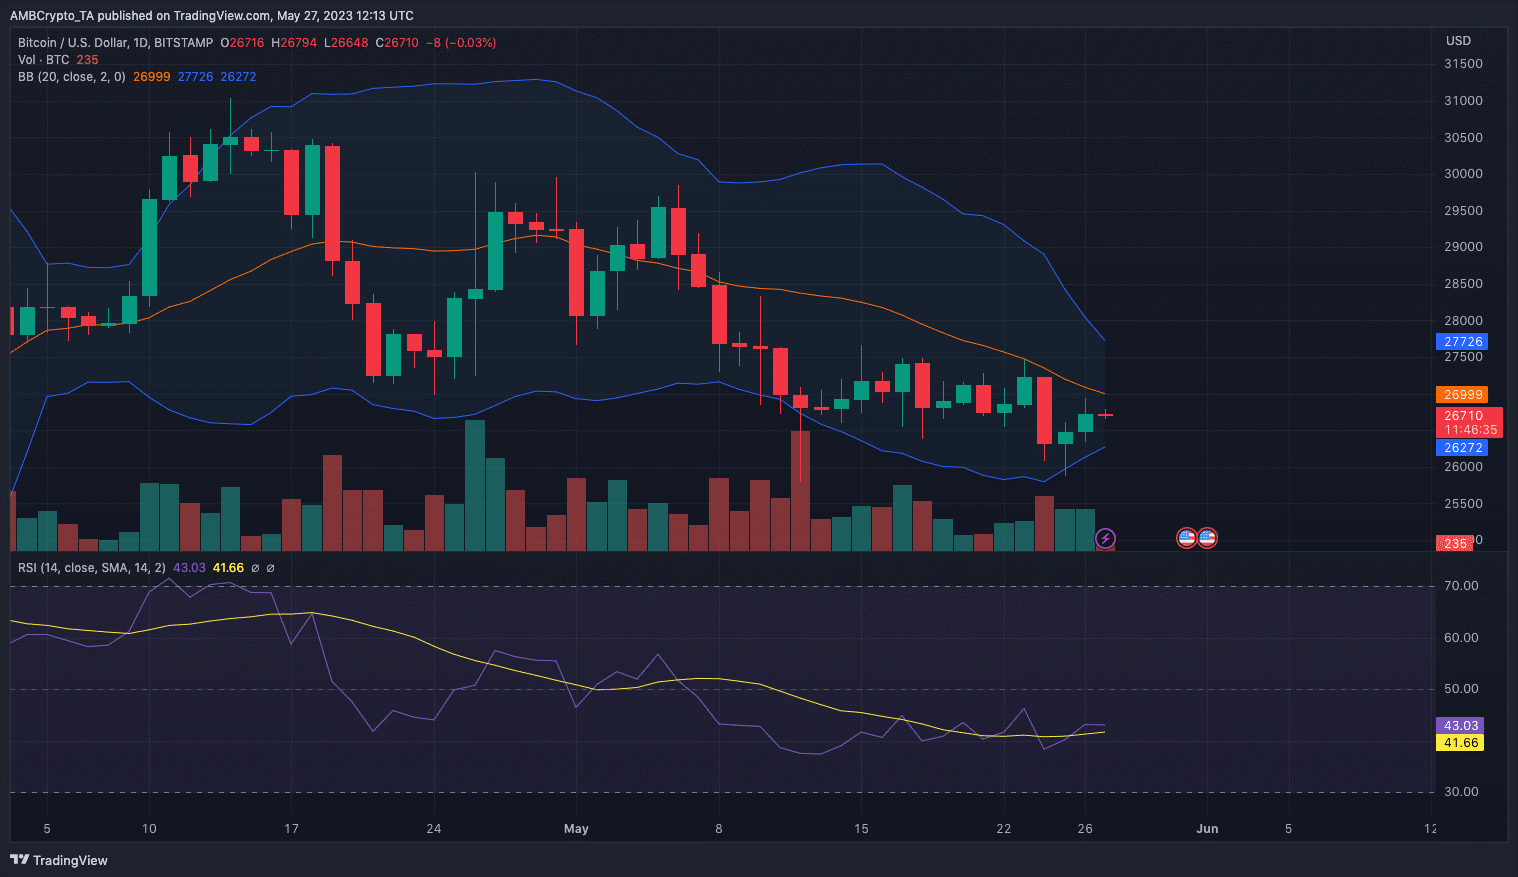
From a technical point of view, Bitcoin's volatility appears to be shrinking. Recently, especially on May 25, the price left the area where it touched the lower part of Bollinger Bands (BB).

This move means that BTC has exited the oversold zone, even if the price is not near the upper band. At press time, the relative strength index (RSI) is 43.02 — up from 38.36 on May 24.

While the slight uptick represents movement away from the downside, the buyers need to neutralize the seller's dominance to reinforce a potential uptrend.
Source: TradingView

Lecturas Relacionadas

Solana Proposals Could Lead to Reduction in Staking Yields to 2.25% and Cut Emissions by $1.5 Billion

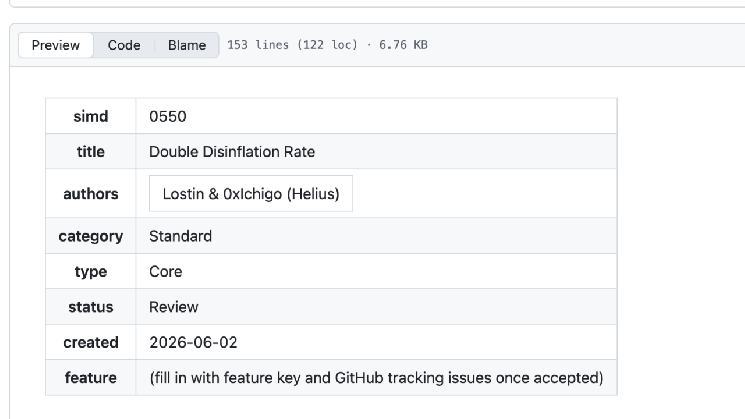
Solana is moving towards a stricter monetary model that could lead to a SOL deficit and significantly reduce staking rewards for holders. Two governance proposals drive these changes. SIMD-550, currently under vote, would double Solana's annual disinflation rate from 15% to 30%, accelerating the timeline to reach a final inflation rate of ~1.5% to the first half of 2029. The second, SIMD-553 (already approved), introduces additional token burning tied to computational units used on the network. Together, these measures could reduce SOL emission by an estimated $1.4-$1.5 billion over six years. The immediate impact would be lower staking yields, potentially falling from the current ~5.25% to approximately 4.34% in year one, 3% in year two, and 2.25% by year three. Analyst Matt Mena from 21Shares suggests inflation should be tied to economic metrics to help offset this decline. The changes also raise concerns for validator economics, with some potentially becoming unprofitable as inflation rewards decrease and voting costs may rise. However, the lower passive yield might push a significant portion of the 67.9% staked SOL into Solana's DeFi ecosystem for activities like lending and trading. This shift could boost network fee revenue to compensate for lower inflation rewards. The proposals aim to trade lower yield today for less dilution tomorrow, betting that network growth and usage will make this a worthwhile trade-off for SOL holders.

cryptonews.ruHace 24 min(s)

Solana Proposals Could Lead to Reduction in Staking Yields to 2.25% and Cut Emissions by $1.5 Billion

cryptonews.ruHace 24 min(s)

Bitcoin 'Basically Hopped' to $80K. What Will Happen to the Price in Autumn?

Bitcoin surged close to $80,000 in August, marking its fastest growth since 2024. Experts anticipate continued volatility for the autumn season, with price forecasts heavily dependent on macroeconomic conditions and regulatory developments in the US. Key drivers for the recent rise include a weakening US dollar, renewed capital inflows into spot Bitcoin ETFs, and liquidations of trading positions. The US Treasury's decision to increase long-term bond purchases has helped stabilize debt markets but pressured the dollar, leading investors to seek assets like Bitcoin as a hedge. Looking ahead, experts outline two primary scenarios for Bitcoin's price. A positive outcome, supported by favorable macroeconomics and the potential passage of the CLARITY Act regulating crypto in the US, could push Bitcoin toward $85,000-$100,000. Conversely, a negative scenario involving hawkish signals from the US Federal Reserve or regulatory setbacks could trigger a correction, potentially driving the price back down to the $62,000-$75,000 range. Institutional demand, reflected in consistent ETF inflows, is seen as a crucial stabilizing factor, gradually outweighing the influence of Bitcoin's traditional four-year cycles. Meanwhile, a broad rally in altcoins is not widely expected, as capital is likely to flow selectively into the most liquid projects. The central question for autumn is whether institutional buying can transform August's rapid surge into a sustainable upward trend.

cryptonews.ruHace 28 min(s)

Bitcoin 'Basically Hopped' to $80K. What Will Happen to the Price in Autumn?

cryptonews.ruHace 28 min(s)

Trading

Spot
活动图片