多重宏观利空打击市场,比特币短时跌破26000美元

比推Publicado a 2023-05-26Actualizado a 2023-05-26

Resumen

在经历了近半个月的萎靡盘整之后,受英国通胀数据、最新的联邦公开市场委员会(FOMC) 会议纪要、以及美财长耶伦对美国债务上限僵局的最新警告影响,加密市场进一步回撤。比推终端数据显示,截至发稿时,比特币交易价格跌破26,400 美元,在过去24 小时内下跌约3%,接近5 月12 日以来的最低水平。

在经历了近半个月的萎靡盘整之后,受英国通胀数据、最新的联邦公开市场委员会(FOMC) 会议纪要、以及美财长耶伦对美国债务上限僵局的最新警告影响,加密市场进一步回撤。比推终端数据显示,截至发稿时,比特币交易价格跌破26,400 美元,在过去24 小时内下跌约3%,接近5 月12 日以来的最低水平。

多方面的宏观不确定性

周三早些时候,在英国最新的4 月份消费者价格指数(CPI) 升至6.8%,高于预期的6.2% ,达到1992 年以来的最高点后,加密市场暴跌,令人失望的CPI 意味着英国央行将不得不继续近期的加息政策,这通常会打击加密市场。

最新的联邦公开市场委员会(FOMC) 会议纪要显示,美国央行官员在继续加息问题上存在分歧,这也对提振市场信心毫无帮助。

周三,美国众议院议长Kevin McCarthy表示,债务上限谈判仍悬而未决——距离美国面临违约风险还有八天。他还表示,他相信谈判小组可以在周三取得进展。

5月初至今,市场一直在权衡美国政府债务上限谈判以及持续的加密货币监管和宏观经济不确定性, BTC在低交易量和波动中挣扎,交易价格一直保持在26,500 美元至27,500 美元的范围内。

金融科技平台YouHodler 市场主管Ruslan Lienkha 在其博客文章中表示,“金融市场紧张局势加剧”对股票和数字资产造成了冲击。

Lienkha 写道:“由于对美国可能违约的担忧加剧,美国股指面临抛售压力:当局距离达成某种协议仅剩不到10 天,我们尚未看到这些谈判取得任何进展。所有这些不确定性迫使金融机构重组资产并为可能的违约做准备,这给金融市场的参与者带来了额外的压力。”

加密市场走势跟随美股,Enclave Markets 首席执行官David Wells 对CNBC表示:“尽管加密货币是一个全球市场,但在美国交易时段交易量大幅回升,因此有时大的加密波动是在宏观驱动的大股票波动之后发生的。”

部分分析人士认为,即使美国政府能够在6 月1 日截止日期之前提高债务上限,股票和加密货币等风险资产也可能受到影响,因为新美国国债的发行将耗尽市场的流动性。

例如,据路透社报道,由于投资者将注意力转向短期债务证券,本周美国货币市场基金资产创下5.8 万亿美元的新纪录。固定收益共同基金是企业和市政资金的主要来源,今年迄今已面临6150 亿美元的净流入。

Deribit :隐含交易量仍处于最低水平

加密期货和期权交易所Deribit 首席商务官Luuk Strijers 发推称,价值36 亿美元的比特币和以太坊期权合约将于本周五在Deribit 到期,但由于市场正处于全年最低波动水平之一,因此影响可能微乎其微。

Strijers 表示,看跌期权比率为0.38,未完成的看涨期权可能比看跌期权多两倍半以上。即将到期的期权金额相当可观,但这并不意味着市场有理由恐慌。
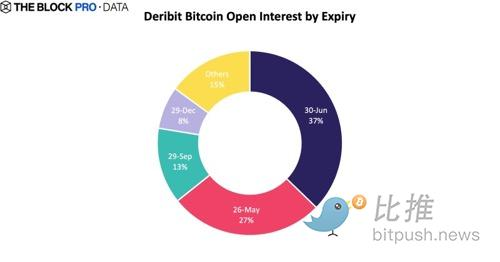
他说:“隐含交易量仍处于最低水平,比特币和以太坊的DVOL(Deribit 比特币波动率指数)为50,而短期交易量甚至更低,但略有攀升,比特币和以太坊的水平相同,这在历史上是罕见的。我们在今年1 月看到了类似的最低隐含波动率( IV )情况,随后出现了大幅飙升”。

BTC 24小时价格图暗示下跌趋势

加密分析师Ann Mugoiri追踪的24小时价格图显示,看跌势头不断增加,比特币价格已经稳步下降。空头成功控制了市场,将BTC/USD 推低至26,106 美元的低点。
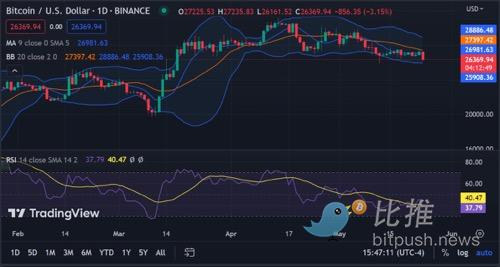
此外, BTC的相对强弱指数(RSI) 值为37.79 并且最近跌破其信号线表明BTC目前处于看跌市场,对于希望利用当前市场状况的投资者来说,这是一个潜在的获利买入机会。布林带也在收窄,表明波动性正在下降并在一定范围内盘整。布林带上轨位于28,886 美元大关,下轨位于25,908 美元。移动平均线指标(MA) 也显示出看跌情绪,因为50 日均线穿过了100 日均线下方。

24 小时比特币价格分析图显示,比特币处于强劲的下跌趋势中,空头主导市场。 BTC/USD已形成一系列较低的高点和较低的低点,表明卖压正在加剧。 Ann Mugoiri认为,如果进一步下跌,则可能会测试26,000 美元的水平,市场继续处于空头控制之中,任何复苏迹象都还有很长的路要走。


Lecturas Relacionadas

After R&D Investment Catches Up with the U.S., Is the Sino-U.S. Chip Competition Still Just About Money?

The article examines the significance of recent data showing China's total R&D expenditure, measured by purchasing power parity (PPP), catching up to or slightly surpassing that of the United States in 2024. It argues that while this milestone reflects China's immense capacity to mobilize research resources, the competition in semiconductors now extends far beyond sheer financial input. The analysis highlights key differences: China's R&D is heavily skewed towards experimental development (over 80%), focusing on product engineering and industrialization, whereas the U.S. allocates a proportionally larger share (about 15%) to basic research. Furthermore, leading U.S. semiconductor firms reinvest a significant portion of their substantial global sales revenue into R&D, creating a sustainable commercial innovation cycle that is difficult to replicate. The article emphasizes that semiconductor progress depends on converting R&D into commercially viable products that pass rigorous customer validation and achieve repeat orders, not just on spending levels. It concludes that as China enters the top tier of R&D spenders, the critical challenges shift to improving resource allocation efficiency, fostering long-term basic research, and building effective mechanisms to bridge the gap between laboratory discoveries and reliable, market-ready industrial capabilities.

marsbitHace 18 min(s)

After R&D Investment Catches Up with the U.S., Is the Sino-U.S. Chip Competition Still Just About Money?

marsbitHace 18 min(s)

Top 10% of American Households Capture 88% of Wealth, How Is the AI Era Cake Divided?

AI Worsens Wealth Inequality as Top 10% of US Families Garner 88% of Stock Gains (2019-2026) A report from the China Finance 40 Forum highlights that the AI boom is significantly widening wealth inequality in the United States. From 2019 to Q1 2026, wealth from directly held stocks by US households nearly doubled from $29 trillion to approximately $55 trillion, with rapid growth concentrated post-2023, coinciding with the AI-driven stock market surge. The distribution of these gains has been starkly uneven. Between 2022 and Q1 2026, the wealth increase of about $21 trillion was captured almost entirely by the wealthiest families: the top 10% secured roughly 88% ($18.5 trillion), while the bottom 50% received only about 1% ($0.2 trillion). This has contributed to a growing disparity in disposable income shares. The report, referencing economic historian Robert Allen, draws parallels to historical technological shifts like the "Engels' Pause" during the First Industrial Revolution, where worker wages stagnated despite productivity gains. It suggests AI could induce a similar period where capital收益 outpace labor income, exacerbating inequality. Huang Yiping of Peking University identifies four mechanisms through which AI impacts income distribution: capital-bias (reducing labor's income share), task polarization (hollowing out middle-skill jobs), skill-based digital divides, and wealth amplification through assets. He warns that if this trend continues, strong supply growth driven by AI could be undermined by persistently weak consumer demand, threatening sustainable economic growth. To address these challenges, the report proposes a three-pronged strategy: 1) Defensive measures like strengthening social safety nets and antitrust enforcement; 2) Empowering workers through education reform and lifelong learning to collaborate with AI; and 3) Rebalancing via policies such as potential taxes on AI超额收益 and mechanisms for broader sharing of technology's benefits, ensuring AI's红利 are more equitably distributed.

marsbitHace 23 min(s)

Top 10% of American Households Capture 88% of Wealth, How Is the AI Era Cake Divided?

marsbitHace 23 min(s)

Trading

Spot
活动图片