Author: Artemis
Compiled by: Deep Tide TechFlow
This report provides an empirical analysis of stablecoin payment usage, covering person-to-person (P2P), business-to-business (B2B), and person-to-business/business-to-person (P2B/B2P) transactions.
This report empirically analyzes the usage of stablecoins for payments, examining transaction patterns for person-to-person (P2P), business-to-business (B2B), and person-to-business/business-to-person (P2B/B2P) transactions. We utilize the Artemis dataset, which provides metadata for wallet addresses, including estimated geographic location, institutional ownership labels, and smart contract identifiers. By characterizing the features of sender and receiver wallets, we classify transactions. The analysis focuses on the Ethereum network, which hosts approximately 52% of the global stablecoin supply.
We primarily study two major stablecoins: USDT and USDC, which together account for 88% of the market share. Although stablecoin adoption and regulatory attention have increased significantly over the past year, a key question remains unanswered: How does the actual use of stablecoins for payments compare to other activities? This report aims to uncover the main drivers of stablecoin payment adoption and provide insights for predicting future trends.
1. Background
In recent years, stablecoin adoption has grown significantly, with the supply reaching $2 trillion, and the current monthly raw transfer volume exceeding $4 trillion. Although blockchain networks provide fully transparent transaction records and all transactions can be analyzed, conducting transaction and user analysis remains challenging due to the anonymity of these networks and the lack of information about the purpose of transactions (e.g., domestic payments, cross-border payments, trading, etc.).
Furthermore, the use of smart contracts and automated transactions on networks like Ethereum adds further complexity to the analysis, as a single transaction may involve interactions with multiple smart contracts and tokens. Therefore, a key unresolved question is how to assess the current proportion of stablecoin usage for payments compared to other activities (such as trading). Although many researchers are working to address this complex issue, this report aims to provide additional methods for assessing stablecoin usage, particularly for payment purposes.
Overall, there are two main methods for assessing stablecoin usage, especially for payments.
The first method is the filtering approach, which uses raw blockchain transaction data and employs filtering techniques to remove noise, thereby providing a more accurate estimate of stablecoin payment usage.
The second method involves surveying major stablecoin payment providers and estimating stablecoin activity based on their disclosed payment data.
The Visa Onchain Analytics Dashboard, developed by Visa in collaboration with Allium Labs, employs the first method. They use filtering techniques to reduce noise in the raw data, thereby providing clearer information on stablecoin activity. Research shows that after filtering the raw data, the overall monthly stablecoin transaction volume drops from approximately $5 trillion (total volume) to $1 trillion (adjusted volume). If only retail transaction volume (transactions with amounts less than $250) is considered, the volume is only $6 billion. We use a filtering method similar to the Visa Onchain Analytics Dashboard, but our approach is more focused on explicitly labeling transactions for payment purposes.
The second method, based on company survey data, has been applied in the "Fireblocks 2025 State of Stablecoins Report" and the "Stablecoin Payments from the Ground Up Report." These two reports use disclosure information from major companies in the blockchain payment market to estimate the direct use of stablecoins in payments. In particular, the "Stablecoin Payments from the Ground Up Report" provides an overall estimate of stablecoin payment transaction volume and categorizes these payments into B2B (business-to-business), B2C (business-to-consumer), P2P (person-to-person), etc. The report shows that as of February 2025, the annual settlement volume was approximately $72.3 billion, with the majority being B2B transactions.
The main contribution of this study is the application of data filtering methods to estimate the use of stablecoins in on-chain payments. The findings reveal stablecoin usage and provide more accurate estimates. Additionally, we provide guidance for researchers on using data filtering methods to process raw blockchain data, reduce noise, and improve estimates.
2. Data
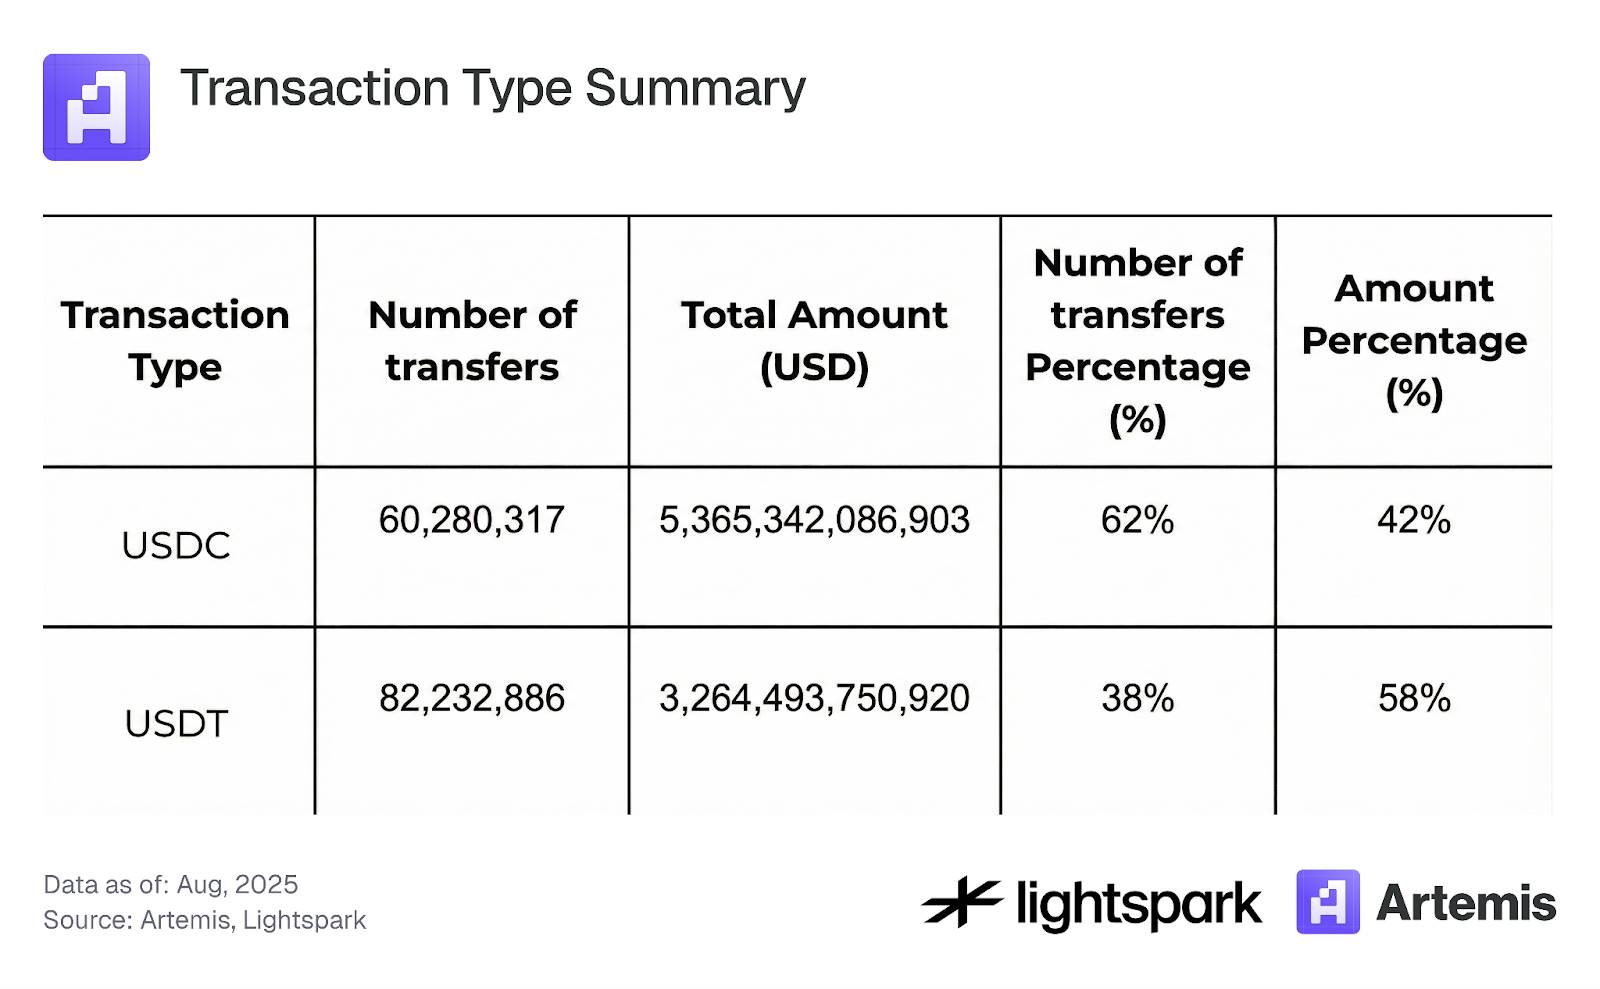
Our dataset covers all stablecoin transactions on the Ethereum blockchain between August 2024 and August 2025. The analysis focuses on transactions involving the two major stablecoins, USDC and USDT. These two were chosen due to their high market share and strong price stability, which reduces noise during analysis. We focus only on transfer transactions, excluding mint, burn, or bridge transactions. Table 1 summarizes the overall situation of the dataset used for our analysis.
Table 1: Summary of Transaction Types
3. Method and Results
In this section, we detail the methods used to analyze stablecoin usage, with a focus on payment transactions. First, we filter the data by distinguishing between transactions involving interactions with smart contracts and transactions representing transfers between EOAs (Externally Owned Accounts), classifying the latter as payment transactions. This process is detailed in Section 3.1. Subsequently, Section 3.2 explains how to use the EOA account label data provided by Artemis to further classify payment transactions into P2P, B2B, B2P, P2B, and internal B transactions. Finally, Section 3.3 analyzes the concentration of stablecoin transactions.
3.1 Stablecoin Payments (EOA) vs. Smart Contract Transactions
In decentralized finance (DeFi), many transactions involve interactions with smart contracts and combine multiple financial operations within the same transaction, such as swapping one token for another through multiple liquidity pools. This complexity makes it more difficult to analyze stablecoin usage solely for payment purposes.
To simplify the analysis and improve the ability to label stablecoin blockchain transactions for payments, we define a stablecoin payment as any ERC-20 stablecoin transfer transaction from one EOA address to another EOA address (excluding mint and burn transactions). Any transaction not labeled as a payment is classified as a smart contract transaction, including all transactions involving interactions with smart contracts (e.g., primarily DeFi transactions).
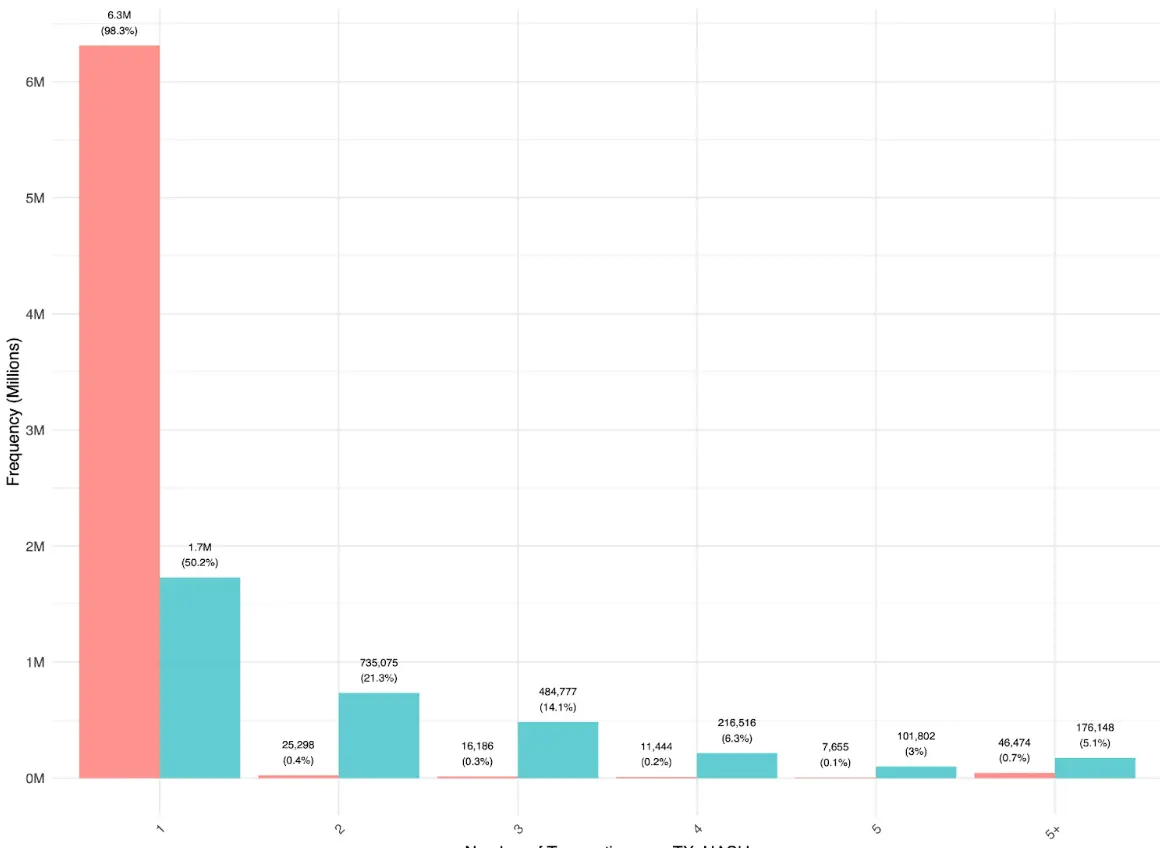
Figure 1 shows that most payments between users (EOA-EOA) are done directly, with each transaction hash corresponding to only one transfer. Some multi-EOA-EOA transfers within the same transaction hash are mainly done through aggregators, indicating that the use of aggregators for simple transfers is still relatively low. In contrast, the distribution of smart contract transactions is different, containing more multi-transfer transactions. This suggests that in DeFi operations, stablecoins often flow between different applications and routers before eventually returning to EOA accounts.
Figure 1:
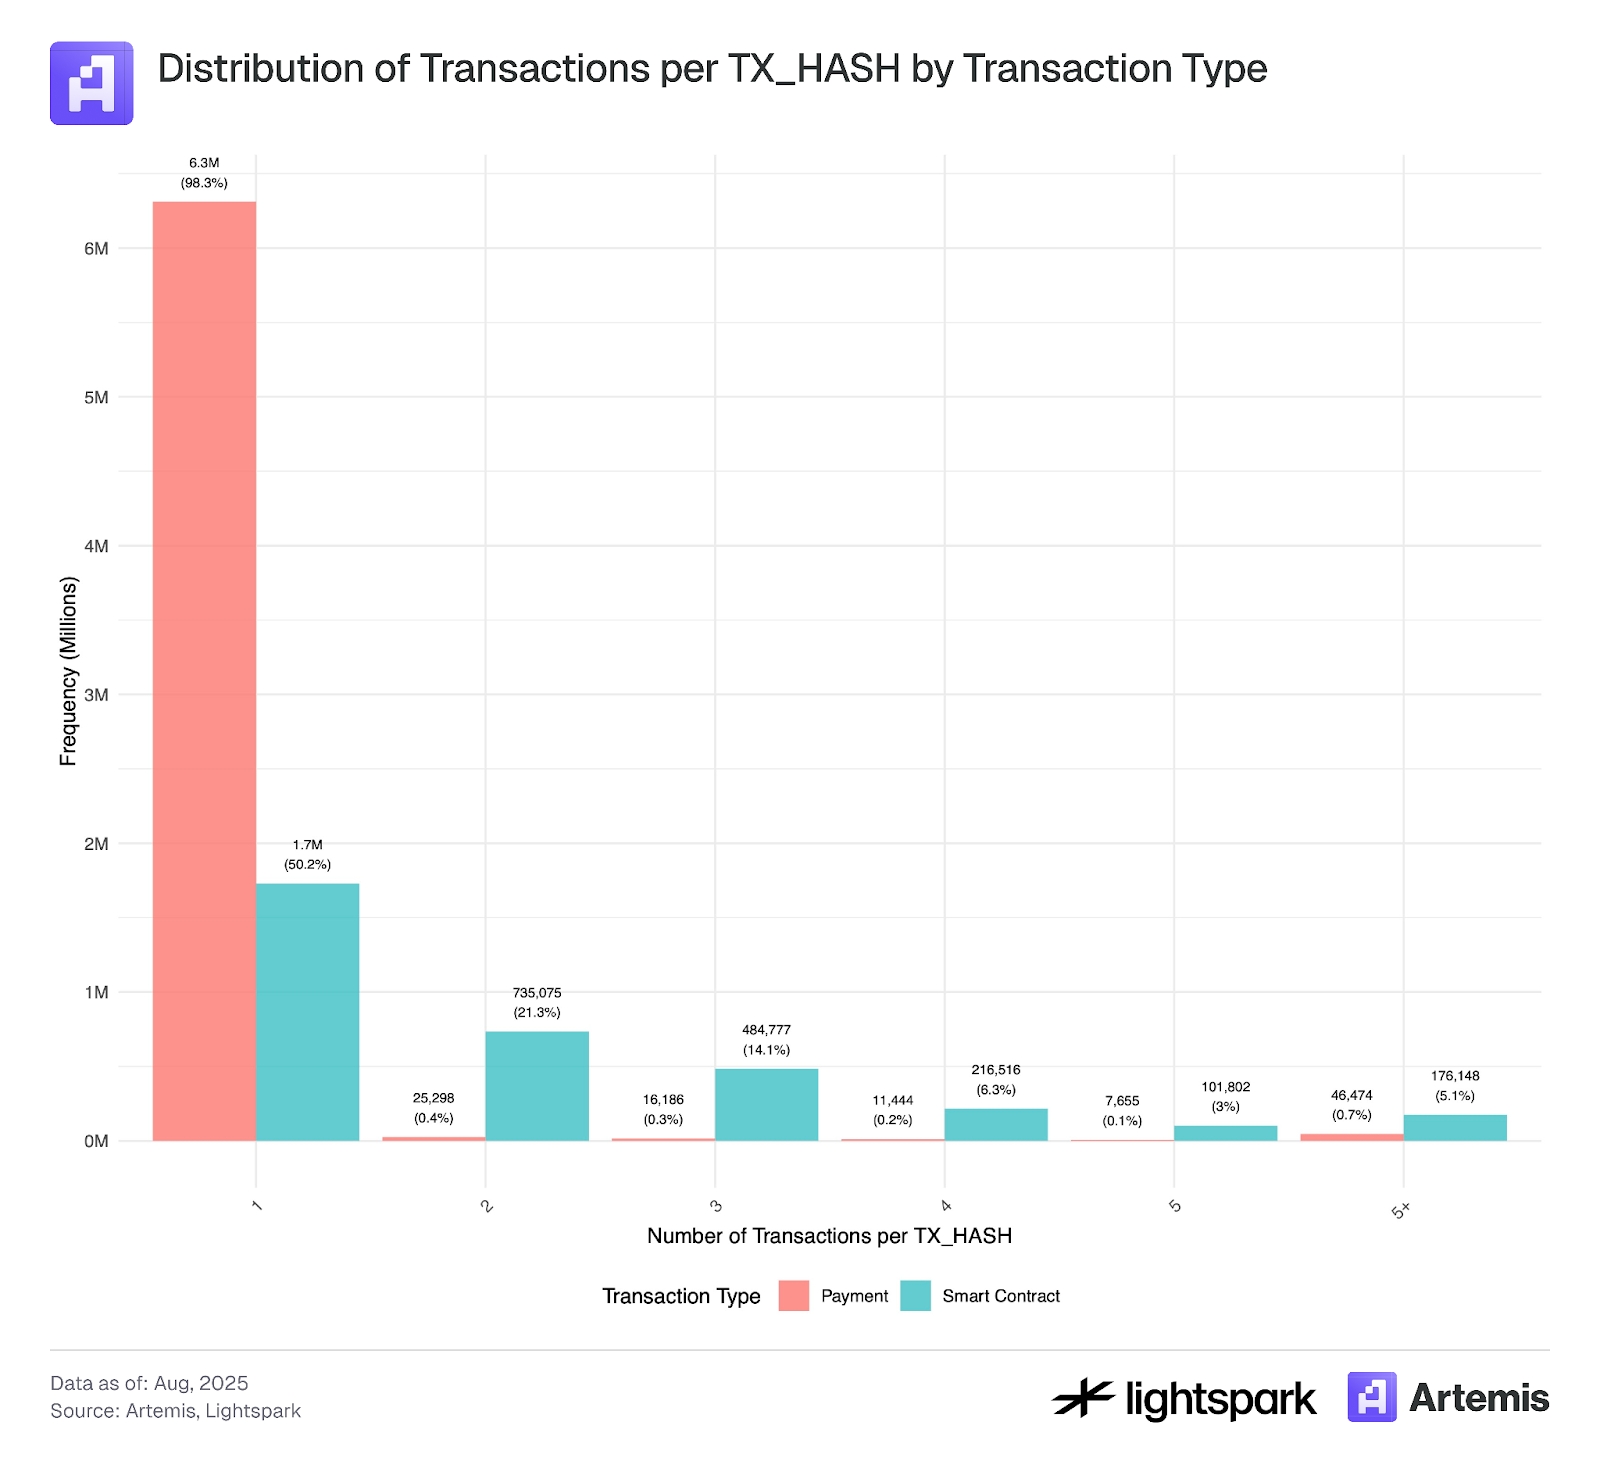
*The sample data for this analysis covers transactions from July 4, 2025, to July 31, 2025.
Table 2 and Figure 2 show that, in terms of the number of transactions, the ratio of payments (EOA-EOA) to smart contract transactions (DeFi) is approximately 50:50, with smart contract transactions accounting for 53.2% of the transaction volume. However, Figure 2 shows that transaction volume (total transfer amount) is more volatile than the number of transactions, suggesting that large EOA-EOA transfers, primarily by institutions, are driving these fluctuations.
Table 2: Summary of Transaction Types
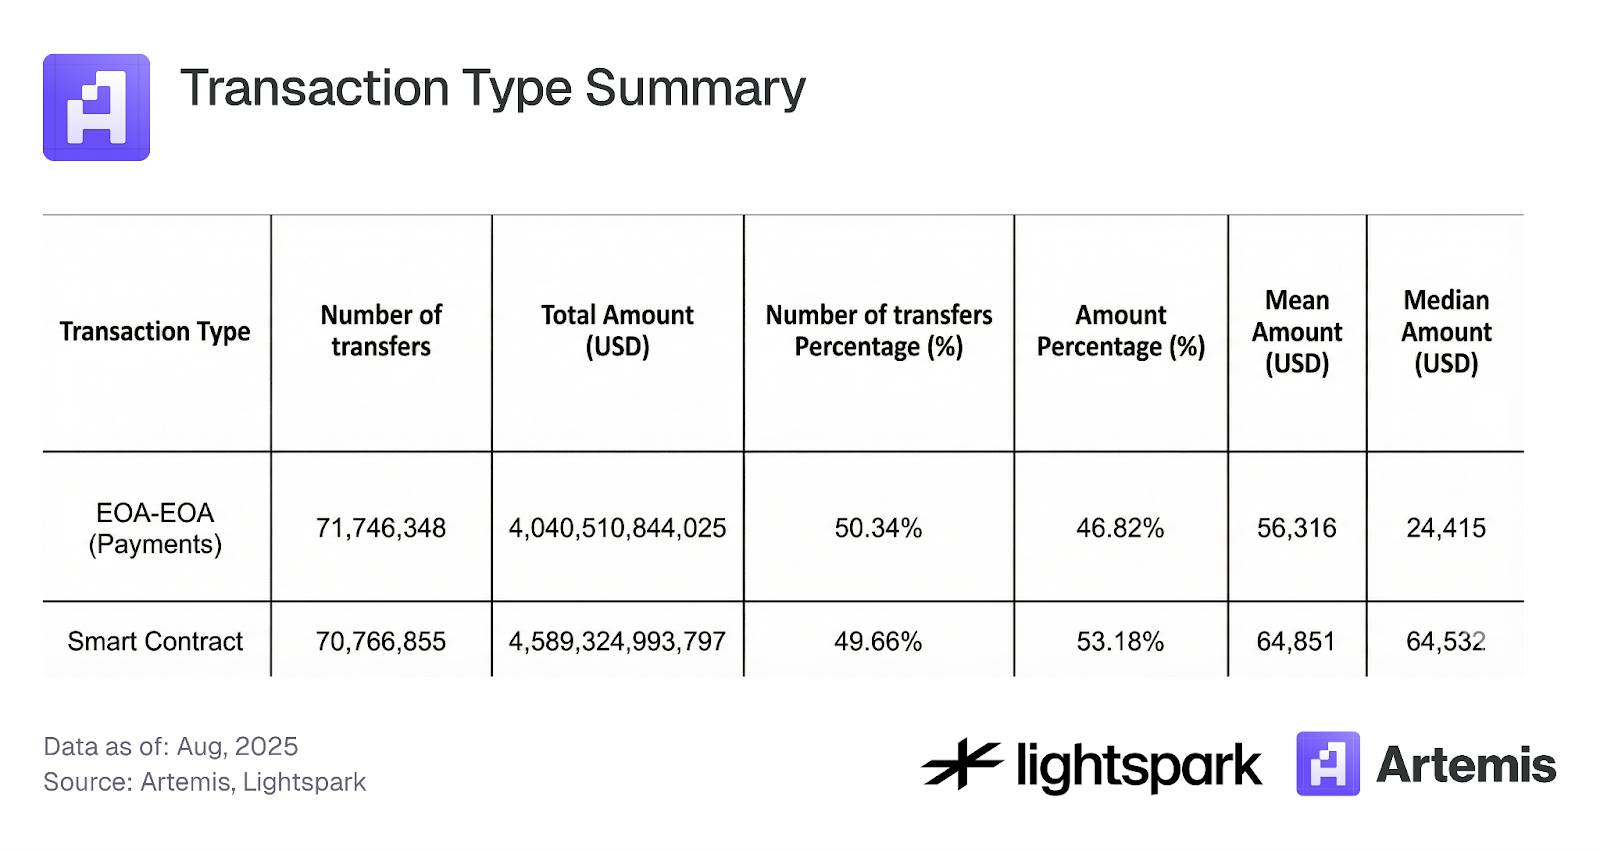
Figure 2:
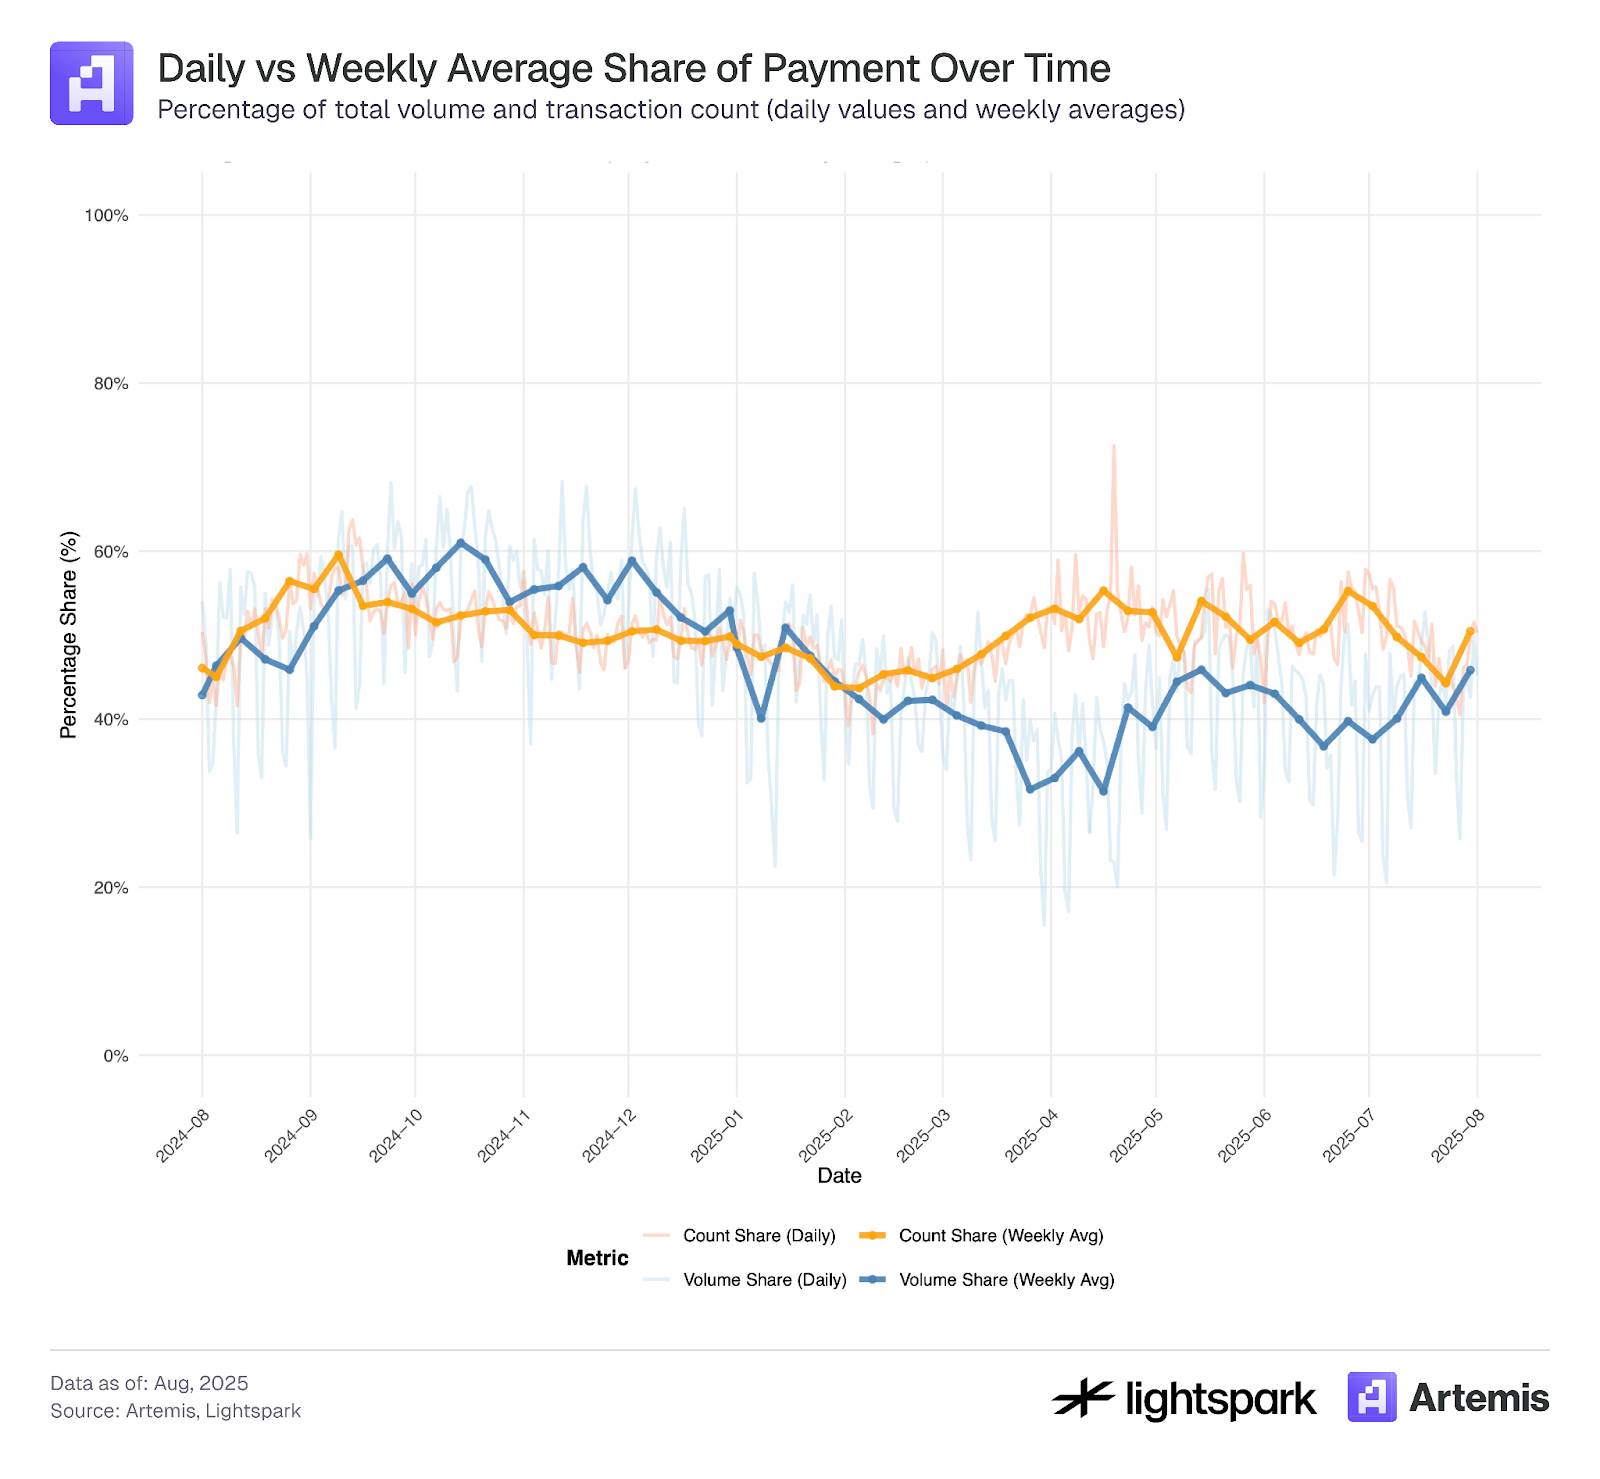
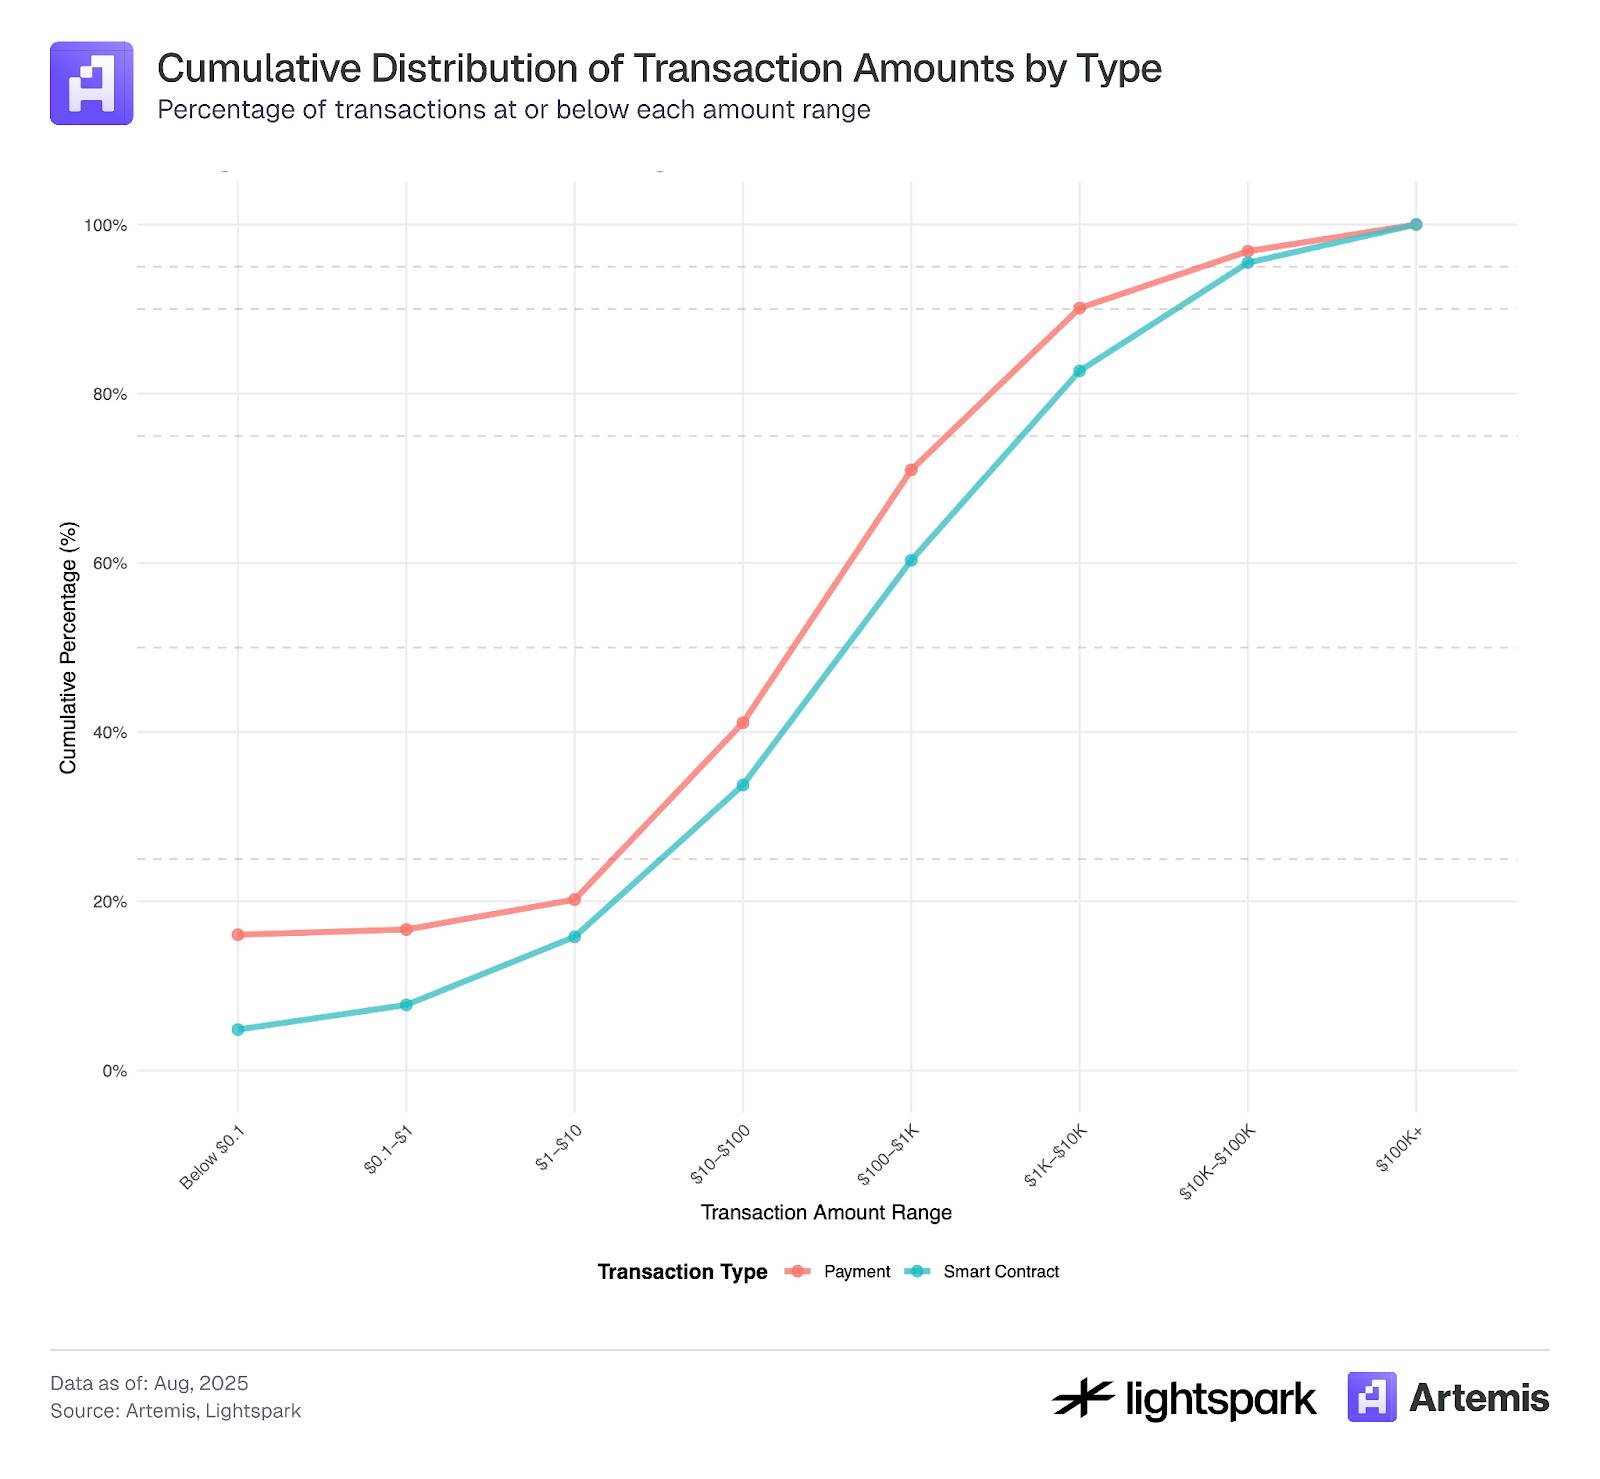
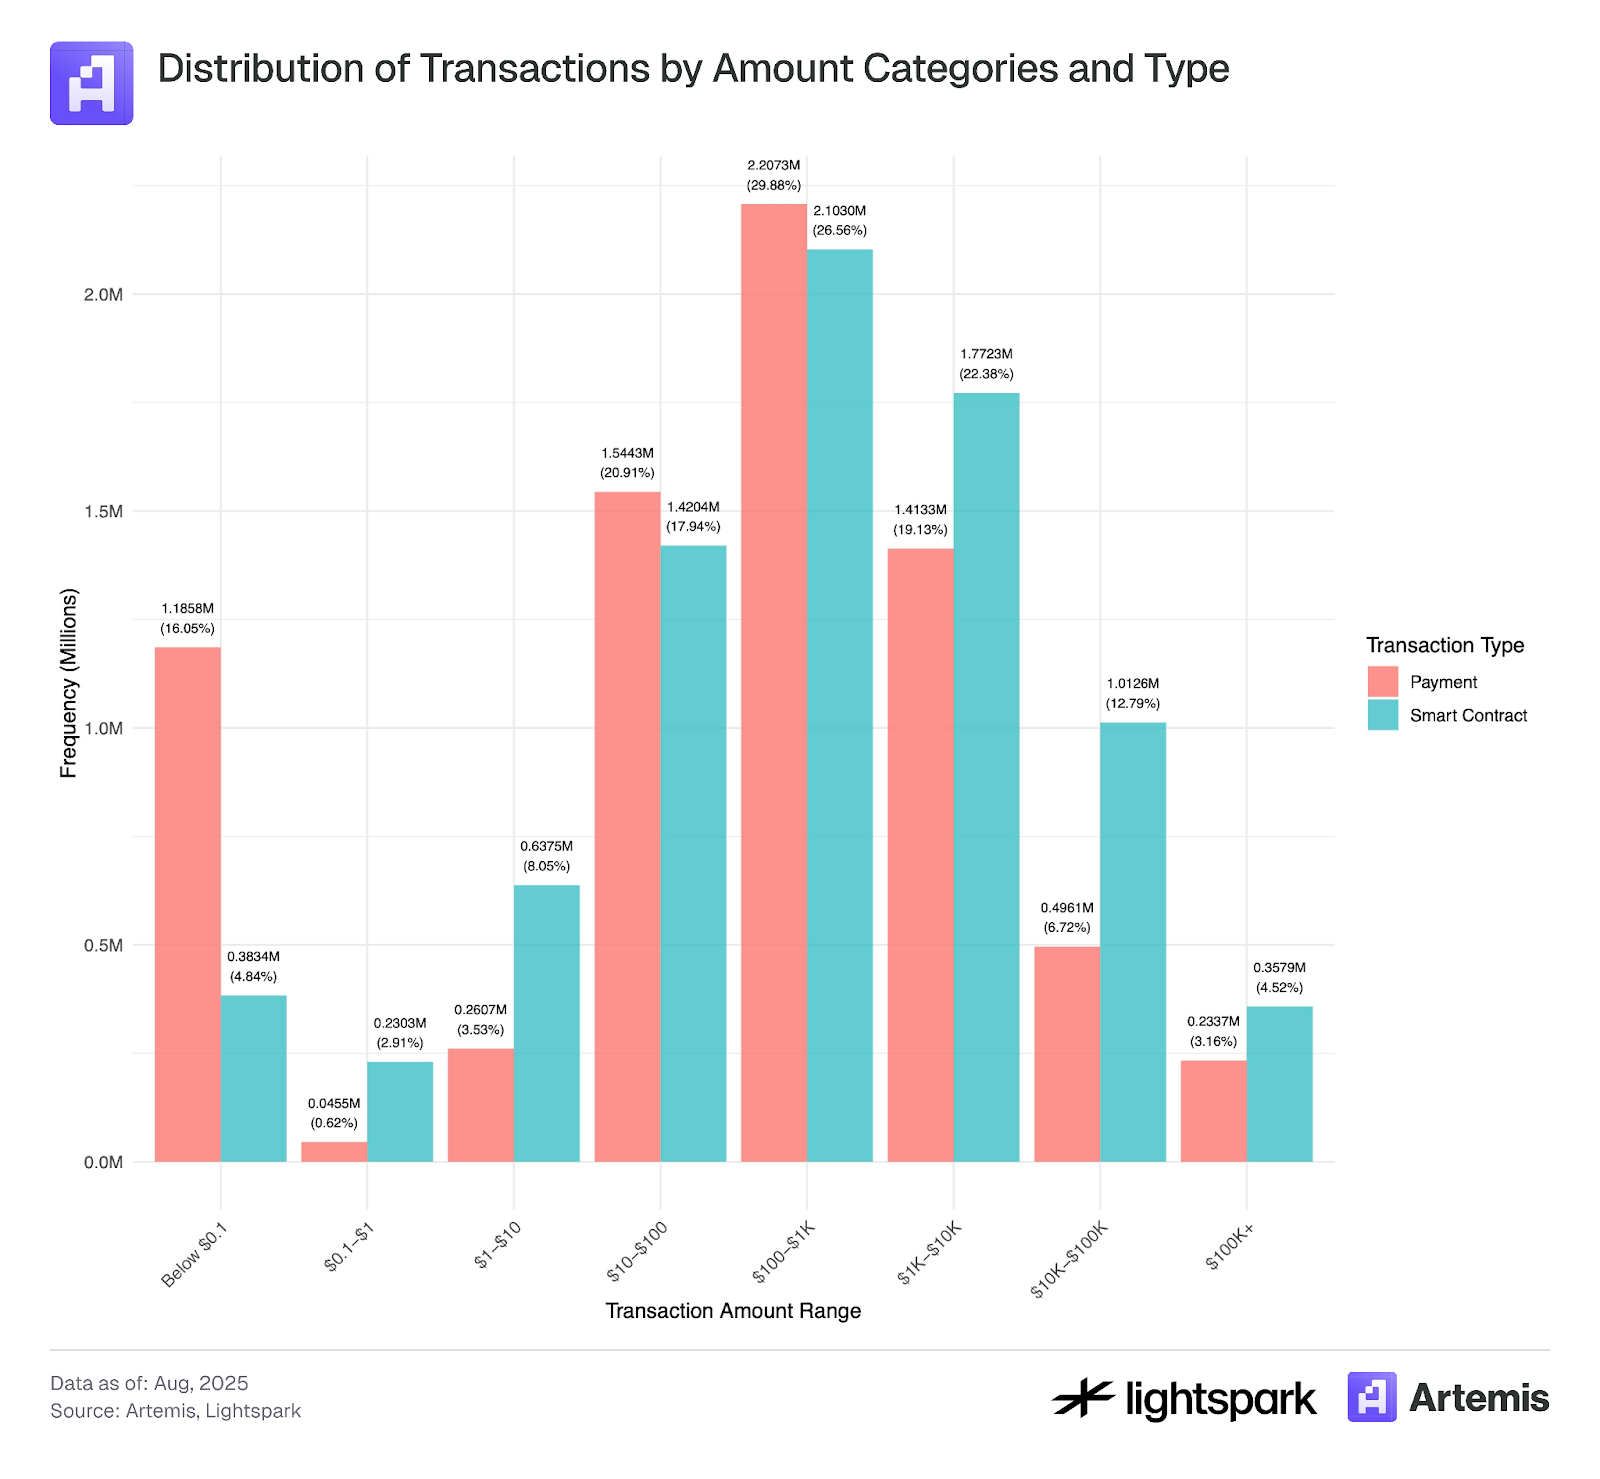
Figure 3 explores the distribution of transaction amounts for payments (EOA-EOA) versus smart contract transactions. The amount distributions for both payment transactions and smart contract transactions resemble a heavy-tailed normal distribution, with an average around $100 to $1,000.
However, there is a significant peak for transactions with amounts below $0.1, which may indicate bot activity or transaction manipulation associated with fake transaction activity and wash trading, as described by Halaburda et al. (2025) and Cong et al. (2023).
Since Ethereum gas fees typically exceed $0.1, transactions below this threshold require further careful examination and may be excluded from the analysis.
Figure 3:
The sample data used for this analysis covers transaction records from July 4, 2025, to July 31, 2025.
3.2 Payment Types
By using the label information provided by Artemis, payments between two EOAs can be further analyzed. Artemis provides label information for many Ethereum wallet addresses, enabling the identification of wallets owned by institutions (e.g., Coinbase). We categorize payment transactions into five types: P2P, B2B, B2P, P2B, and internal B. A detailed description of each category follows.
P2P Payments:
P2P (person-to-person) blockchain payments refer to transactions that transfer funds directly from one user to another through a blockchain network. In account-based blockchains like Ethereum, such P2P transactions are defined as the process of transferring digital assets from a user's wallet (EOA account) to another user's EOA wallet. All transactions are recorded and verified on the blockchain without the involvement of intermediaries.
Main Challenges:
A primary challenge is identifying whether a transaction between two wallets in an account system actually occurs between two independent entities (i.e., individuals, not companies) and correctly classifying it as a P2P transaction. For example, transfers between a user's own accounts (i.e., Sybil accounts) should not be counted as P2P transactions. However, if we simply define all transactions between EOAs as P2P, such transfers might be misclassified.
Another issue is that when an EOA account is owned by a company, such as a centralized exchange (CEX, like Coinbase), that EOA wallet is not actually owned by a real individual. In our dataset, we are able to label many institutional and corporate EOA wallets; however, since the label information is not complete, some EOA wallets owned by companies but not recorded in our dataset might be incorrectly marked as individual wallets.
Finally, this method cannot capture blockchain P2P payments made through intermediaries—also known as the "stablecoin sandwich" model. In this model, funds are transferred between users through intermediaries that utilize the blockchain for settlement. Specifically, fiat currency is first sent to an intermediary, which converts it to cryptocurrency; the funds are then transferred via the blockchain network, and finally, the recipient's intermediary (which could be the same or a different one) converts it back to fiat. The blockchain transfer is the "middle layer" of the "sandwich," while the fiat conversion constitutes the "outer layers." The main challenge in identifying these transactions is that they are executed by intermediaries, who may bundle multiple transactions together to reduce gas fees. Therefore, key data (such as the exact transaction amount and the number of users involved) is only available on the intermediary's platform.
B2B Payments:
Business-to-business (B2B) transactions refer to electronic transfers from one business to another through a blockchain network. In our dataset, a stablecoin payment is a transfer between two known institutional EOA wallets, for example, from Coinbase to Binance.
Internal B Payments:
Transactions between two EOA wallets of the same institution are marked as internal B transactions.
P2B (or B2P) Payments:
Person-to-business (P2B) or business-to-person (B2P) transactions refer to electronic transfers between an individual and a business, which can be in either direction.
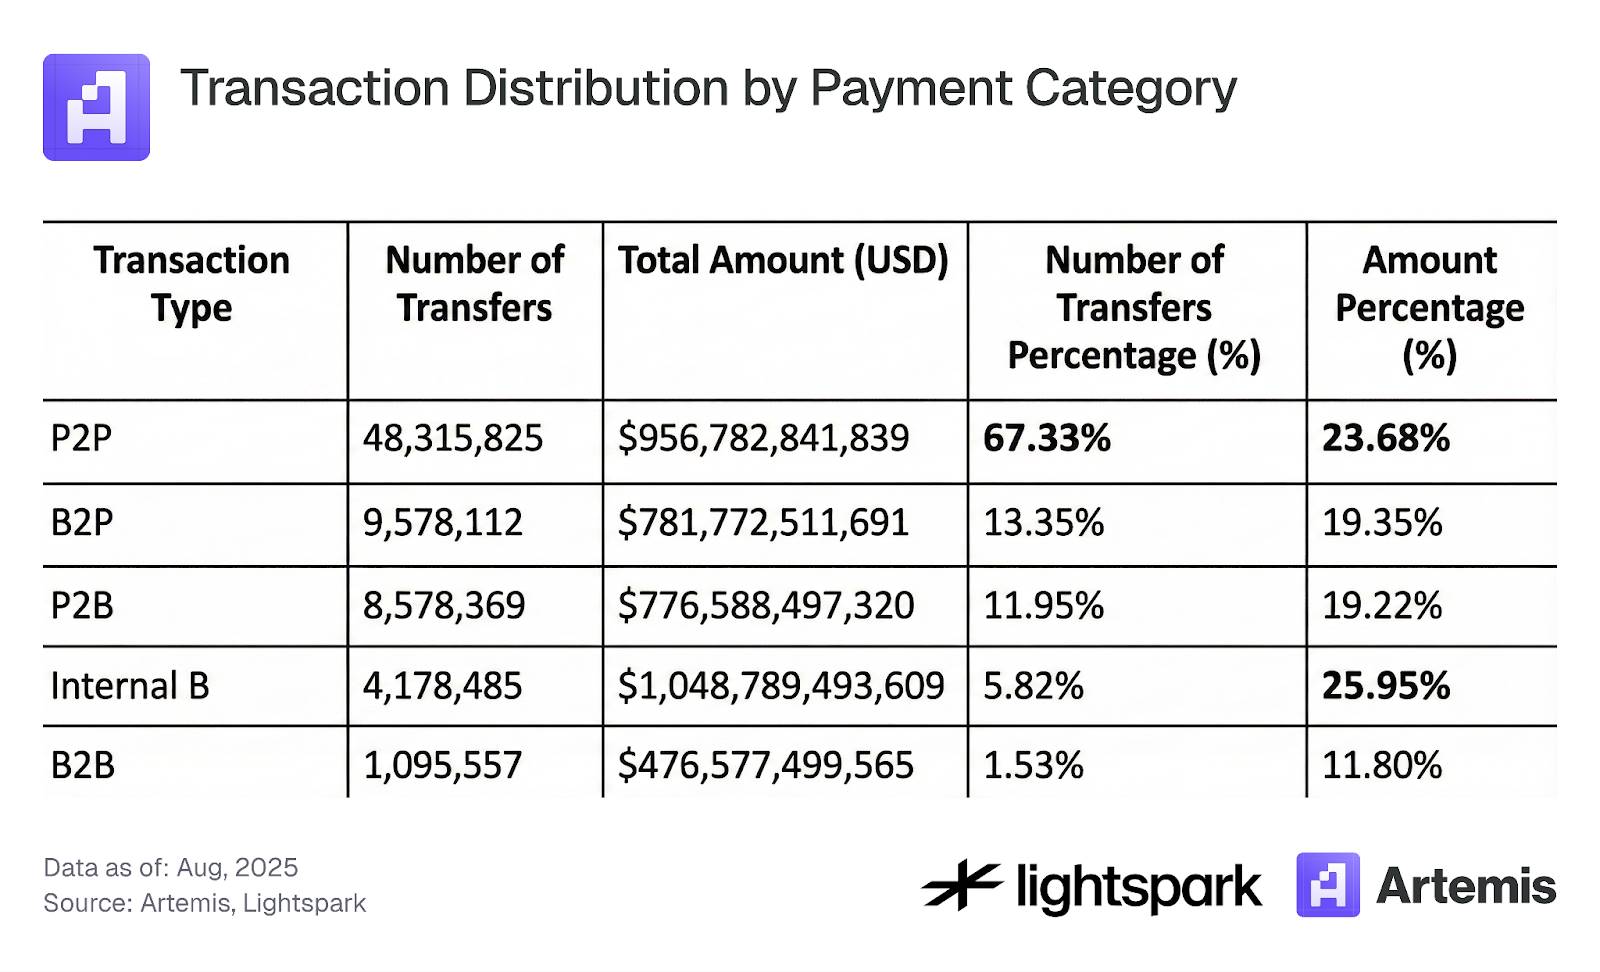
Using this labeling method, we analyzed the payment data (EOA-EOA transfers only), and the main results are summarized in Table 3. The data shows that 67% of EOA-EOA transactions are of the P2P type, but they account for only 24% of the total payment volume. This result further indicates that P2P users transfer lower amounts compared to institutions. Furthermore, one of the categories with the highest payment transaction volume is internal B, meaning transfers within the same organization account for a significant proportion. Exploring the specific meaning of internal B transactions and how to count them in payment activity analysis remains an interesting question for research.
Table 3: Transaction Distribution by Payment Category
Finally, Figure 4 shows the cumulative distribution function (CDF) of transaction amounts for each payment category. The CDF clearly shows distinct differences in the distribution of transaction amounts across categories. Most transactions with amounts below $0.1 in EOA-EOA accounts are of the P2P type, further proving that these transactions are likely driven more by bots and manipulated wallets than by institutions labeled in our dataset. Additionally, the CDF for P2P transactions further supports the view that most transaction amounts are small, while transactions labeled as B2B and internal B show significantly higher transaction amounts in their CDF. Finally, the CDF for P2B and B2P transactions falls between that of P2P and B2B.
Figure 4:
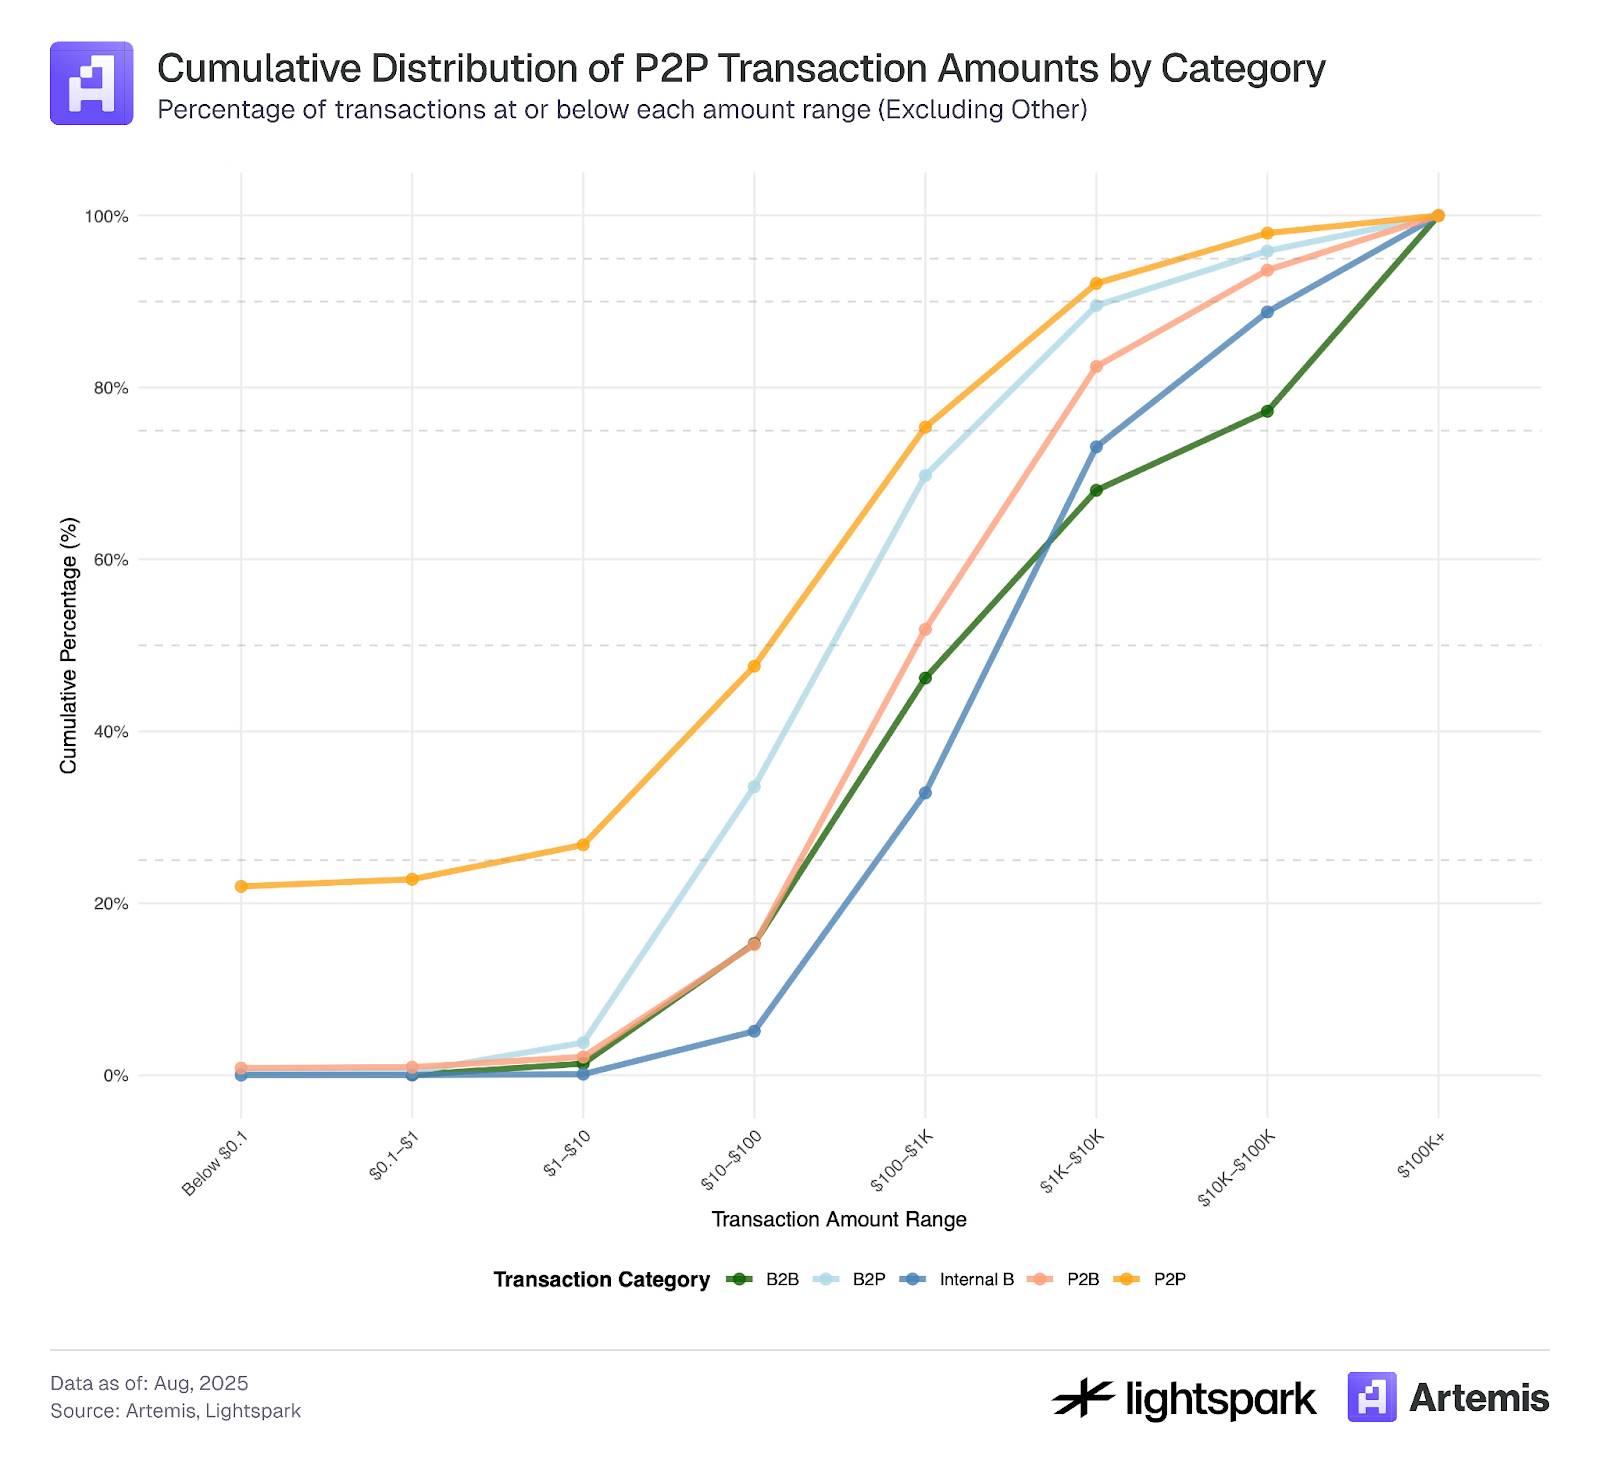
The sample data for this analysis covers transaction records from July 4, 2025, to July 31, 2025.
Figures 5 and 6 show the trends over time for each payment category.
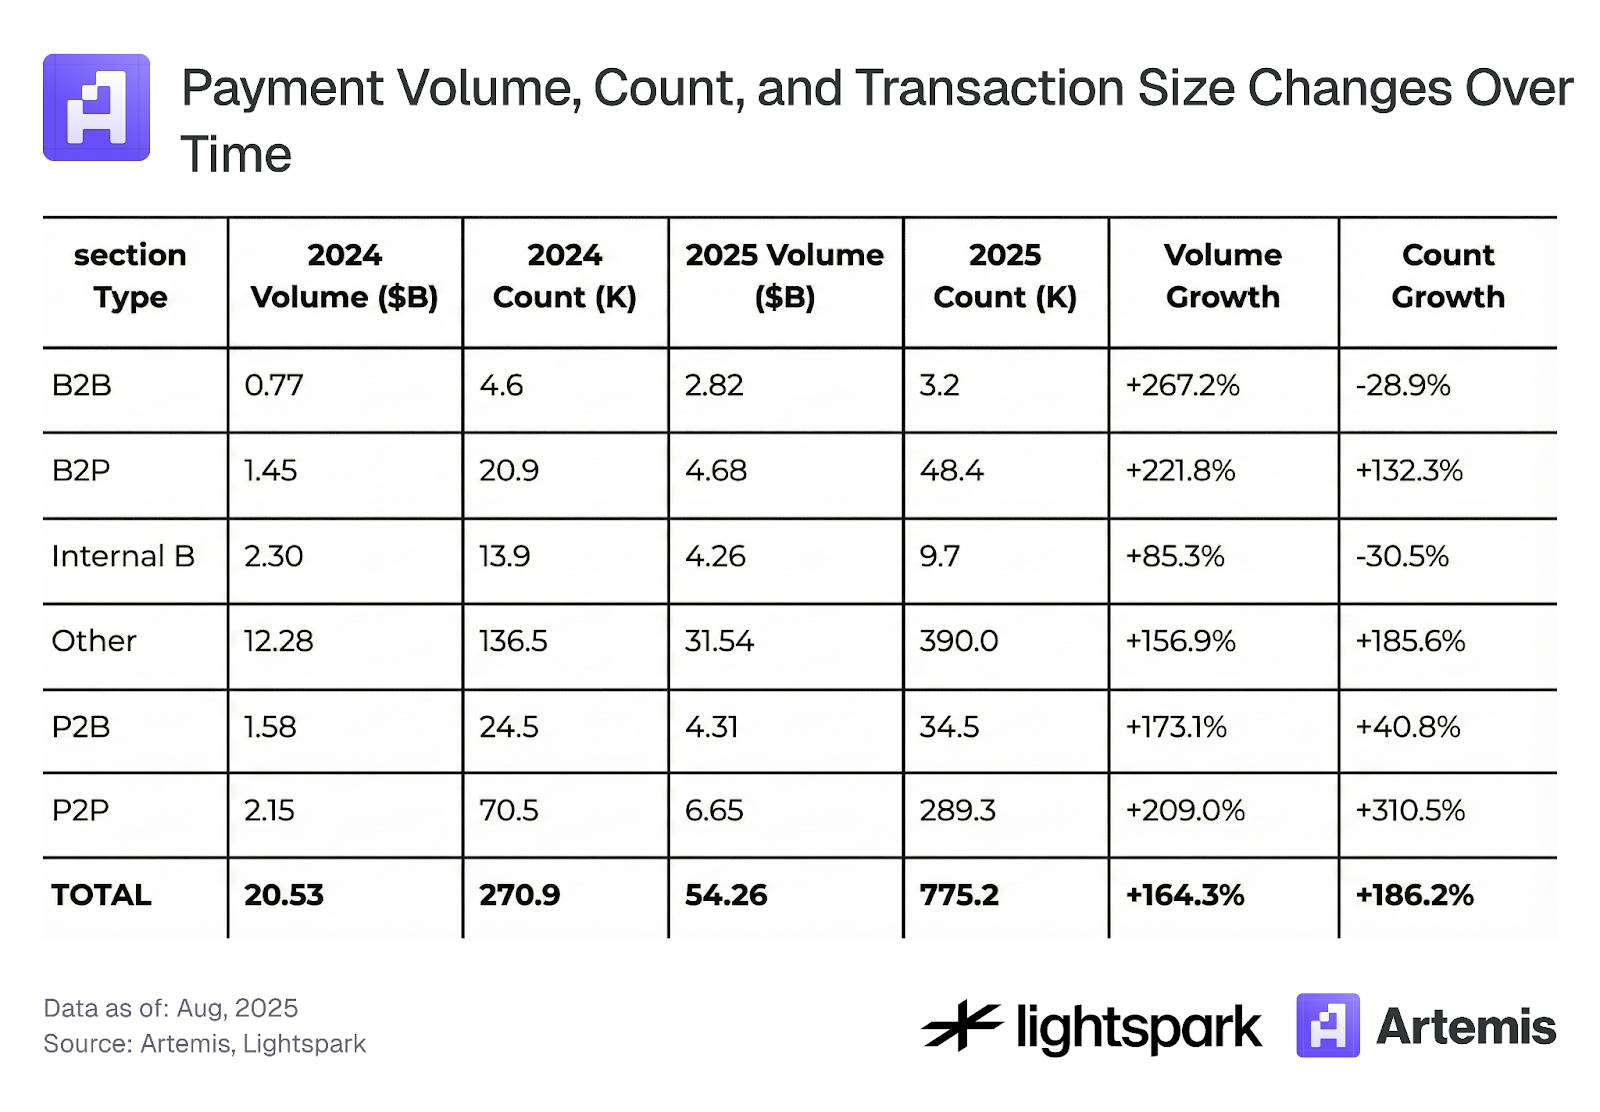
Figure 5, focusing on weekly changes, shows a consistent adoption trend and growth in weekly transaction volume across all categories. Table 4 further summarizes the overall changes from August 2024 to August 2025.
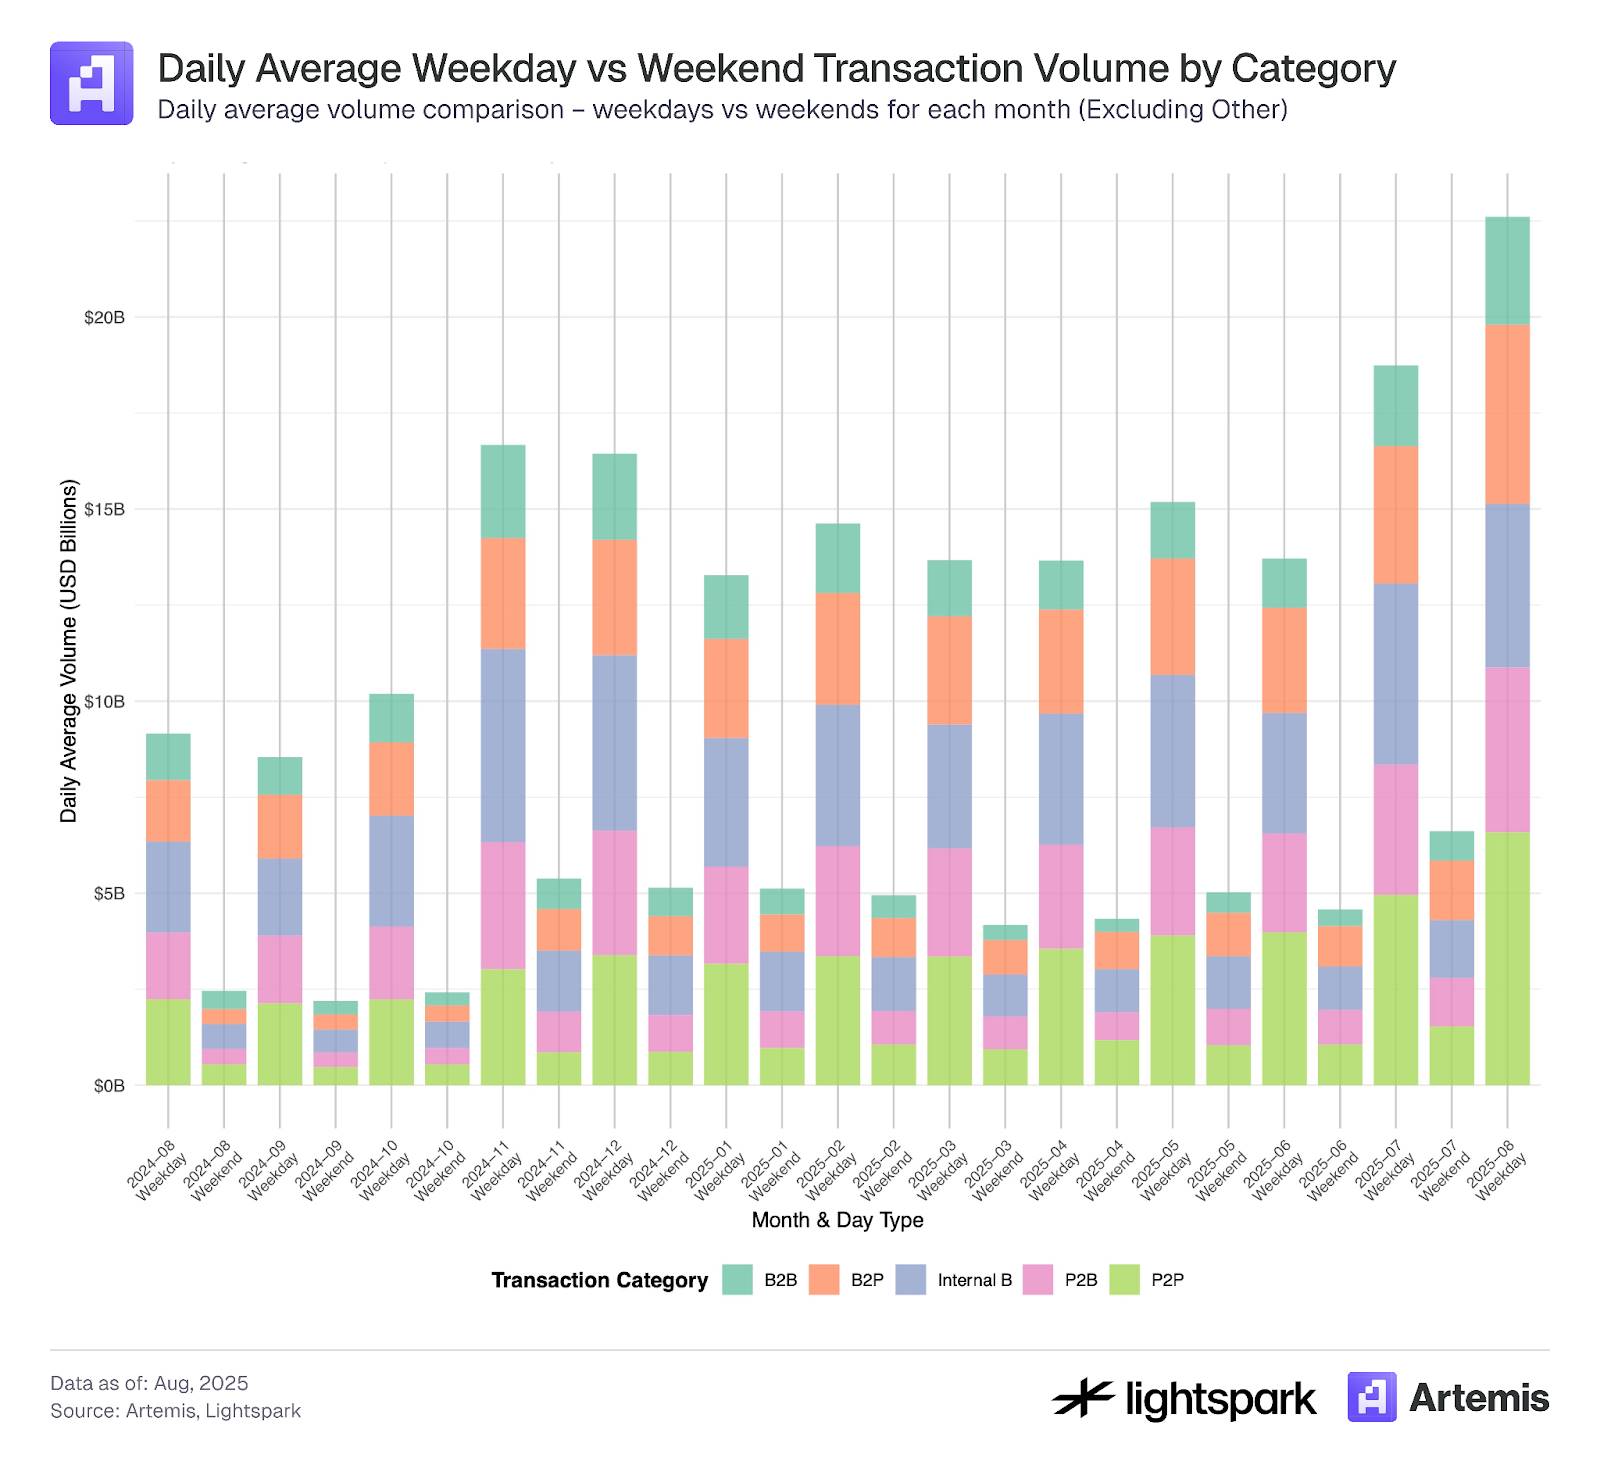
Additionally, Figure 6 shows the difference in payments between weekdays and weekends, where a clear reduction in payment transaction volume on weekends can be seen. Overall, the usage of payments across all categories shows a growing trend over time, both on weekdays and weekends.
Figure 5:

Figure 6: