B3bit
10/12 05:25
BONK Price Analysis
BONK Price Analysis
On March 5, 2024, BONK achieved an all-time high of $0.00003771, reflecting an impressive nearly 400% increase from its February low.
This surge was followed by a significant 75% decline, bringing the price down to $0.000012 by April 13.
After a rebound to $0.000044 on May 29, the price fell again to $0.000020 by June 24. It reached a lower high of $0.000034 on July 21 before dropping to a new low of $0.000015 on Aug. 5.
The price then consolidated, retesting its August low on Sept. 6 and 18. A subsequent increase led to a high of $0.000026 on Oct. 1.
However, the Relative Strength Index (RSI) indicated overbought conditions, suggesting a possible rejection near the descending channel resistance established in March.Following this, BONK encountered resistance, resulting in a price decline to $0.000019 on Oct. 3.
Since then, it has recovered about 20% and fell again to retest its prior low levels before another 10% recovery.
This price action from Oct. 1 formed a descending triangle whose breakout to the upside could now be seen.
BONK most likely finished its WXY correction, with the rise from Sept. 6 being its first uptrend in a bullish phase. However, the strongest confirmation will come if BONK surpasses the descending resistance.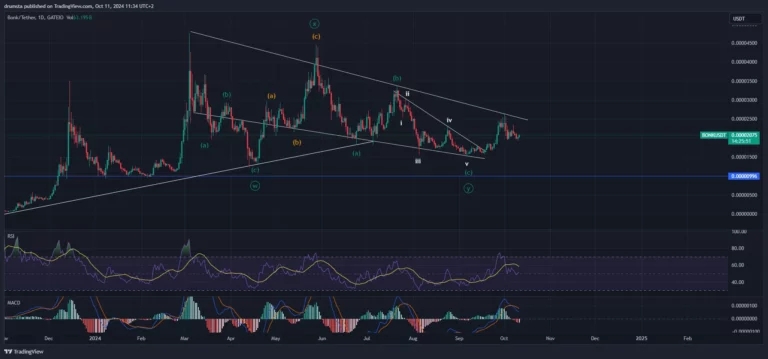
Todos los comentarios0Lo más recientePopular