This week, Bitcoin continued the rebound structure initiated from the July 1st low. On the daily chart, it has completed a seven-segment rise and the construction of the first central pivot (Central Pivot A). Following the confirmation of "Endpoint 5," the market has entered a phase of adjustment and renewed rebound. Quantitative model top signals and overbought characteristics suggest a high probability of entering a 2-3 week consolidation within a high-level range, gathering momentum for the subsequent construction of the second rising central pivot (Central Pivot B). Mid-term positions should remain unallocated (on the sidelines) pending confirmation of trend validity. For short-term trades, relying on support/resistance zones, using the resonance between Chan theory structure and proprietary quantitative model signals as a basis, flexibly execute two sets of tentative long and short plans, A and B.
Regarding HYPE, on the 4-hour chart, the rise starting from the August 2nd low has extended into the departing segment of the second central pivot (Central Pivot B). The key to the subsequent price action lies in the momentum comparison between this departing segment and the entering segment—whether momentum divergence appears will determine if this uptrend will conclude. Technical indicators already show overbought signs, warranting caution when chasing highs.
Additionally, last week, a short-term BTC long trade was successfully executed according to plan, achieving approximately 4.45% profit. This validates the effectiveness in live trading of the resonance signals from the "Spread Trading Model" and the "Momentum Quantitative Model." Relevant trade details and review are provided at the end of the article.
Summary of This Week's Core Trading Views:
• BTC Daily Price Action Structure Analysis (Details in Part 1)
• BTC Market Forecast and Mid-/Short-term Trading Strategies for This Week (Details in Part 2)
• HYPE Hourly Chart Structure Analysis (Details in Part 3)
• HYPE Market Forecast and Short-term Trading Strategies for This Week (Details in Part 4)
Market Verification of Last Week's Trading Strategy:
• BTC Short-term Trade Result: Last week, we completed one short-term long trade (1x leverage) as per the plan, successfully achieving ~4.45% profit. (Details in Part 5)
I. Bitcoin Daily Chart Structure Analysis
Last week's analysis introduced the Chan theory framework, systematically deconstructing and positioning central pivots for BTC's rebound structure starting from the July 1st low of $57,820. This week's analysis continues within this system, providing further in-depth analysis of the internal structure of this rebound from perspectives of price action structure, central pivot evolution, and momentum divergence.
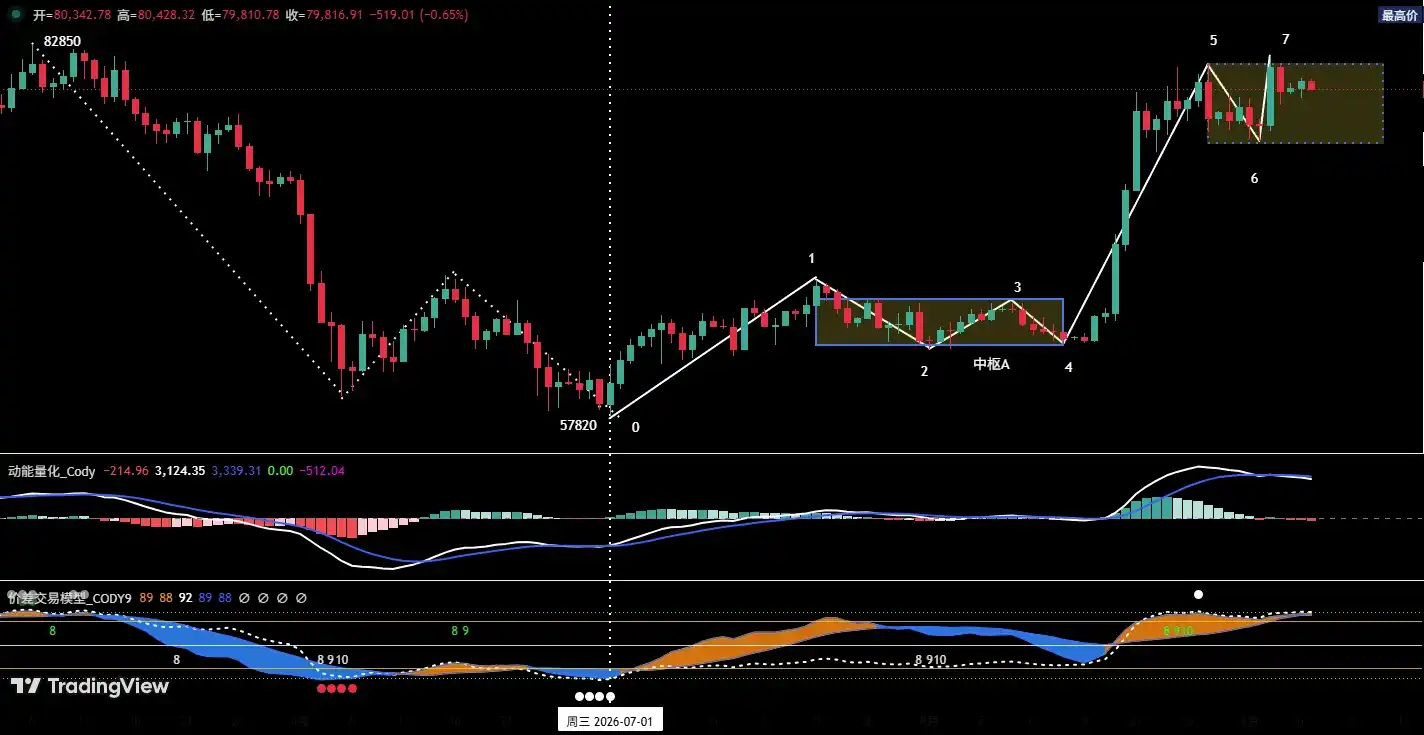
Figure 1: Bitcoin Daily Candlestick Chart
1. As shown in (Figure 1): Since the rebound from the July 1st low, a clear seven-segment rising structure from (0-1) to (6-7) has emerged. Among them, segments (1-2), (2-3), and (3-4) overlap, jointly forming the first rising central pivot (Central Pivot A) of this rebound. Its upward departing segment (4-5) was confirmed to have ended around the $81,500 level.
2. Structural Analysis Based on Central Pivot A:
1. The departing segment (4-5) rebound momentum was significantly stronger than the entering segment (0-1), with no momentum divergence observed between the two.
2. According to proprietary quantitative model monitoring: The dual signal lines of the "Momentum Quantitative Model" formed a death cross, while the "Spread Trading Model" simultaneously triggered a top warning signal (white dots in the chart). The resonance of both indicates the market has entered an overbought zone.
3. After the confirmation of "Endpoint 5," the market has shown an adjustment segment (5-6) and the currently developing rebound segment (6-7).
3. High-Level Range Consolidation, Constructing a Second Rising Central Pivot is Highly Probable
Integrating the above three points: Starting from "Endpoint 5," the market is highly likely to enter a high-level range consolidation pattern lasting 2-3 weeks. The long side uses wide fluctuations to wash out profit-taking pressure accumulated during the rapid rise and gradually builds the second rising central pivot (Central Pivot B) within the range. Upon completion of Central Pivot B, it is expected to initiate another upward move departing from it.
II. Bitcoin Market Forecast and Trading Strategy for This Week
1. BTC Market Forecast for This Week
Core view for this week: High probability of market entering range consolidation, while closely monitoring the ending position of "Endpoint 7" on the daily chart.
2. Key Resistance Levels
• First Resistance Zone: $81,700 ~ $82,850 area (previous key level)
• Second Resistance Zone: Around $84,500 (previous key resistance area)
• Third Resistance Zone: $90,000 area (key psychological level)
3. Key Support Levels
• First Support Zone: $73,500 ~ $75,000 area (previous key support)
• Second Support Zone: $67,300 ~ $69,100 area (previous key support)
4. Trading Strategy for This Week (Excluding Sudden News Impact)
1. Mid-term Strategy:
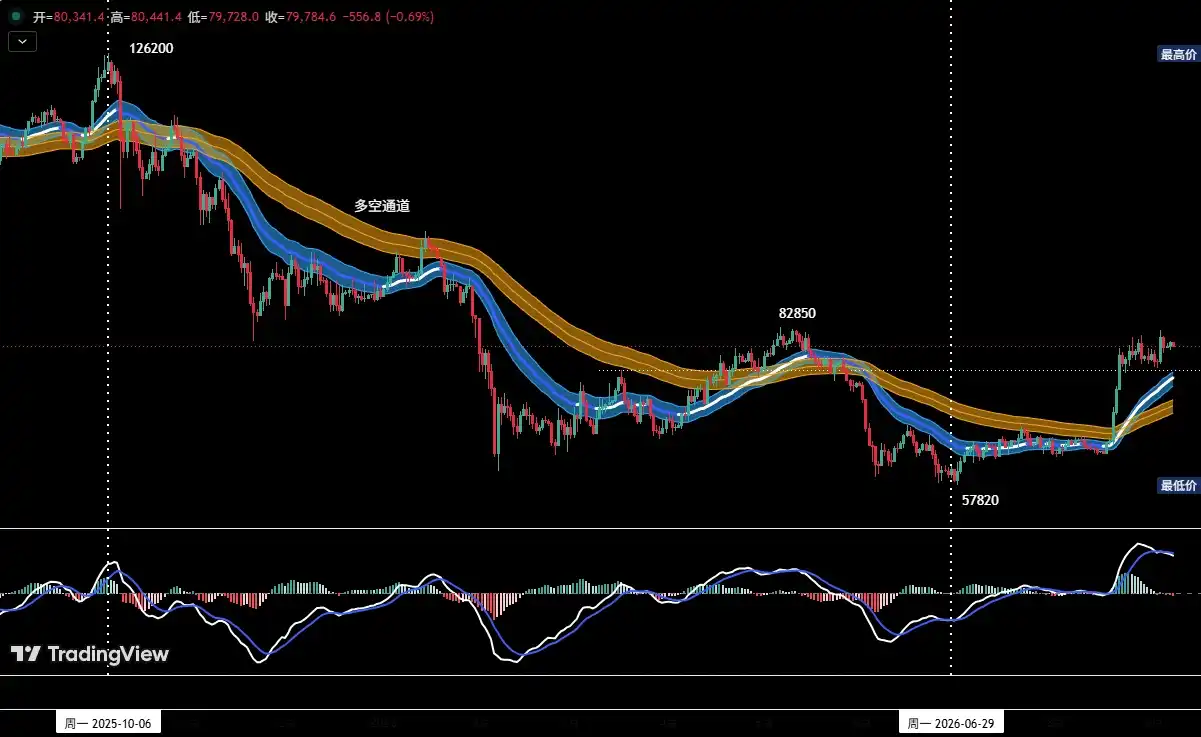
Figure 2: Bitcoin _ Daily Candlestick Chart: (Position Monitoring Model)
Position Monitoring Model: As shown in (Figure 2), the price has broken through the "Bull-Bear Channel," leading to a change in the short-term market structure. However, the pullback confirmation phase after the breakout is not yet complete, and the validity of the trend reversal still awaits confirmation. Given the signal is not yet complete, mid-term positions are currently maintained at zero, primarily on the sidelines.
2. Short-term Strategy: Utilize 30% of capital, set stop-loss, and seek "spread" opportunities based on support and resistance levels. (Using 30-minute/60-minute charts as the operational timeframe).
3. For short-term operations, to dynamically adapt to complex market evolutions, we have pre-established two operational plans, A/B.
• Plan A: Tentative Long at Strong Support Zone with Light Position.
• Entry: When the price falls back to the aforementioned first or second key support levels, showing clear stabilization patterns and the quantitative model simultaneously issues bottom signals, a long position of around 30% can be established.
• Risk Control: Set initial stop-loss.
• Exit: When the rebound approaches key resistance levels combined with model signals, gradually close the position to take profits.
• Plan B: Tentative Short at Strong Resistance Zone with Light Position.
• Entry: When the price rises to the aforementioned key resistance levels, showing clear signs of rejection/retreat and the quantitative model simultaneously issues top signals, a short position of around 30% can be established.
• Risk Control: Set initial stop-loss.
• Exit: When the decline approaches key support levels combined with model signals, gradually close the position to take profits.
III. HYPE Hourly Chart Structure Analysis
This week's analysis introduces the Chan theory framework to systematically deconstruct and analyze HYPE's rebound structure starting from the August 2nd low of $51.11.
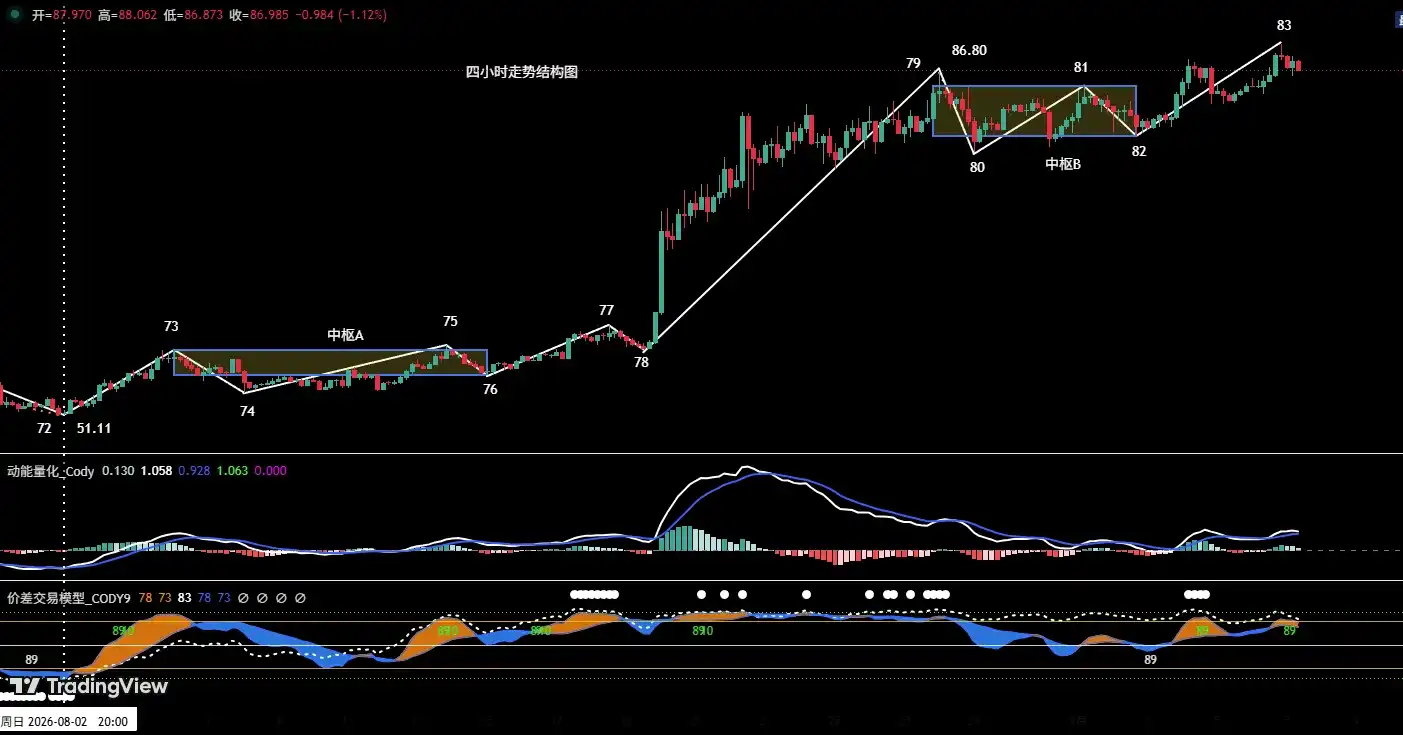
Figure 3: HYPE_4-Hour Candlestick Chart
1. Overview of Price Action Structure
As shown in (Figure 3): The rising trend in HYPE starting from the August 2nd low of $51.11 can be clearly divided into an 11-segment rising structure from (72-73) to (82-83) on the 4-hour chart.
2. Structural Analysis Based on Central Pivot A
• Central Pivot A Composition: The three segments (73-74), (74-75), and (75-76) overlap in their price ranges, forming the first rising central pivot (Central Pivot A).
• Momentum Analysis: Comparing the upward momentum of the entering segment (72-73) and the departing segment (78-79) relative to Central Pivot A, the momentum of the departing segment is significantly stronger than that of the entering segment, with no momentum divergence observed between them. Based on this, it is judged that after segment (78-79) ends, following consolidation and momentum gathering, the price is expected to continue rising.
3. Structural Analysis Based on Central Pivot B
• Central Pivot B Composition: The three segments (79-80), (80-81), and (81-82) overlap, forming the second rising central pivot (Central Pivot B). For Central Pivot B, (78-79) is its entering segment, and (82-83) is its departing segment.
• Current Position and Subsequent Scenarios: The current price is within the running departing segment (82-83). Subsequent focus should be on observing the momentum comparison between this departing segment and the entering segment. If momentum divergence appears between the departing segment (at its end) and the entering segment, the probability of the uptrend starting from "Endpoint 72" concluding increases significantly. Conversely, if no divergence appears, the price, after consolidation, is likely to continue the original uptrend and reach new highs.
IV. HYPE Market Forecast and Short-term Trading Strategy for This Week
1. HYPE Market Forecast for This Week
1. Key Resistance Level:
• First Resistance Level: Around $100
2. Key Support Levels:
• First Support Zone: $83~$85 area;
• Second Support Zone: $77~$80 area;
3. Core View for This Week: Focus on observing the ending position of Central Pivot B's departing segment (82-83), and confirming whether it forms a momentum divergence relationship with the entering segment (78-79) by comparing their upward momentum at the segment's end.
2. HYPE Short-term Trading Strategy for This Week
1. Holders (Long Positions): For those who entered positions according to the trading plan in the $50~$52 area earlier, it is suggested to move the initial stop-loss up to around $80 to lock in existing profits; strictly adhere to stop-loss discipline and hold for further gains.
2. Non-holders: If the price pulls back to the key support zone of $83~$85, shows effective stabilization, and clear long signals appear, consider entering a light long position, while simultaneously setting and strictly executing a stop-loss.
3. Risk Warning: The recent consecutive price increases have accumulated significant profit-taking pressure, and multiple technical indicators are in overbought territory. Therefore, avoid chasing highs at current levels and be vigilant about short-term correction risks.
V. Bitcoin Short-term Trade Review(08.31~09.06):
We strictly followed the operational plan and completed one short-term (long) trade last week based on trading signals from our proprietary "Spread Trading Model" and "Momentum Quantitative Model," achieving a total trading profit of approximately 4.45%.
1. Short-term Trade Record:(See Table 1)
Bitcoin Short-term Trade Details Summary:(Leverage*1x)
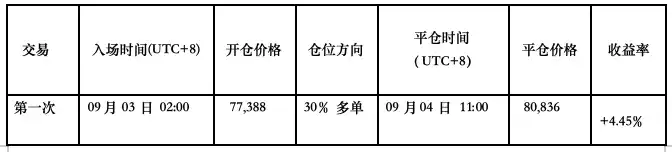
Table 1
2. Short-term Trade Review:(See Figure 4)
• Entry Strategy:
a. The price had previously completed a full correction structure. When the price fell to the area above $76,000, signs of stabilization appeared, with candlesticks forming a "bottom reversal" pattern;
b. The "Momentum Quantitative Model" formed a momentum bottom divergence signal, resonating with the bottom buy signal from the "Spread Trading Model."
Based on the resonance of the above multi-factor signals, we established a 30% long position at $77,388.
• Exit Strategy:
a. When the price rose near $82,850, signs of stagnation appeared, with candlesticks forming a "top reversal" pattern;
b. The "Spread Trading Model" continuously issued top warning signals (white dots + green dots), followed by its signal band (blue) crossing below the skyline (green), forming a top resonance signal with the "Momentum Quantitative Model."
Based on the above top resonance signals, we executed a full close-out near $80,836.
• Summary: This trade achieved a profit of approximately 4.45%.
3. Short-term Trade Illustration
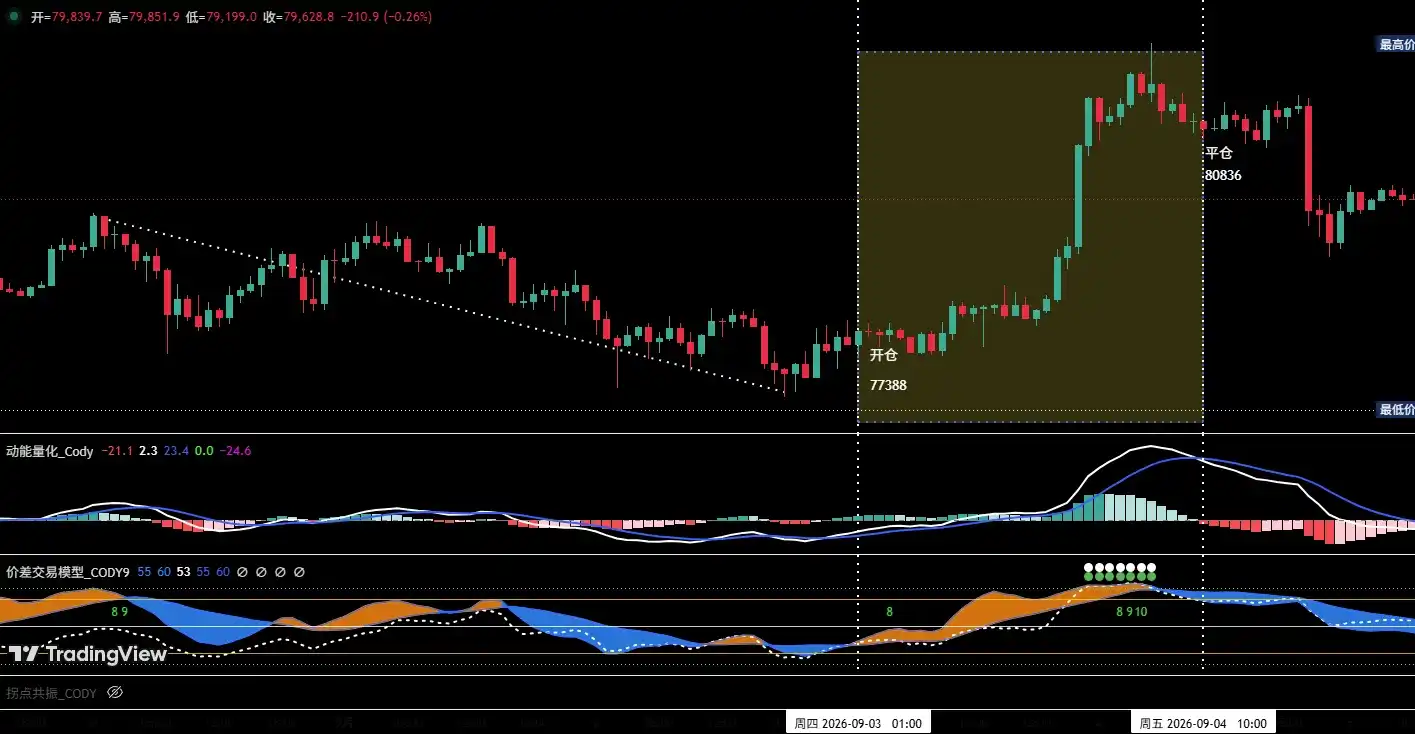
Figure 4: BTC_60-minute Candlestick Chart:(Momentum Quantitative Model+Spread Trading Model)
VI. Special Notes
1. When Opening a Position: Immediately set the initial stop-loss.
2. When Profit Reaches 1%: Move the stop-loss to the entry price (breakeven point) to ensure capital safety.
3. When Profit Reaches 2%: Move the stop-loss to the 1% profit level.
4. Continuous Tracking: Thereafter, for every additional 1% profit the price makes, move the stop-loss up by 1% accordingly, dynamically protecting and locking in profits.
Financial markets are ever-changing; all market analysis and trading strategies require dynamic adjustment. All views, analytical models, and operational strategies mentioned in this article are derived from personal technical analysis and are for personal trading log purposes only. They do not constitute any investment advice or operational basis. Markets carry risks, investment requires caution; please do not make decisions based on this content.