FARTCOIN surges 13% but THIS caps upside – What comes next?

ambcryptoPublished on 2026-02-15Last updated on 2026-02-15

Abstract

FARTCOIN surged 13.46% to $0.2183, boosting its market cap to $218.36M with a 48.77% increase in trading volume, indicating fresh capital inflow. Despite strong buyer defense at the $0.20–$0.21 support level and signs of whale accumulation, the price remains constrained within a broader descending channel. Resistance near $0.32 and $0.47 continues to limit upward movement, while the RSI at 43 suggests weak bullish momentum. Long liquidations exceeded shorts post-rally, indicating leverage cooling. Downside liquidity clusters between $0.19–$0.21 increase the likelihood of a pullback before any sustained breakout attempt. The $0.20 level remains critical for determining future price direction.

Fartcoin surged 13.46% in 24 hours to $0.2183, lifting market capitalization to $218.36M as participation accelerated sharply.

Trading volume expanded 48.77% to $48.48M, confirming that fresh capital entered during the rally instead of fading.

Buyers defended the $0.20–$0.21 support region first, then drove price toward $0.22 before the advance slowed. The expansion reflects renewed speculative interest after recent compression.

On-chain data showed a $155K wallet accumulation executed through multiple swaps shortly after the move began, pointing to calculated positioning rather than random activity.

Still, Fartcoin’s price hesitated near short-term resistance, which shows that technical structure continues to influence direction despite aggressive demand.

Descending channel continues to frame structure

The daily chart shows Fartcoin trading inside a clearly defined descending channel that has shaped price behavior for months.

Even though bulls reclaimed the $0.20–$0.21 support region and triggered a sharp bounce, price remains contained within those declining boundaries.

The upper trendline continues to cap advances and prevents any confirmed structural shift in trend direction.

Resistance stands near $0.32, while a broader supply ceiling appears around $0.47, both clearly marked on the chart.

The RSI was at 43 at press time, signaling recovery from prior weakness but not strong bullish control. The indicator remains below the 50 midpoint, which keeps buyers from asserting dominance.

Price also failed to sustain acceptance above $0.22, showing hesitation near short-term pressure.

Until bulls challenge mid-channel resistance with strength, the broader corrective structure remains intact and influential.

Long liquidations outweigh shorts after rally

The liquidation data at press time shows $93.55K in long liquidations compared to $45.83K in shorts.

That imbalance highlights a leverage shift following the rally. During the expansion toward $0.22, short sellers likely absorbed pressure as the price climbed.

Once the price stalled near resistance, late long positions faced forced exits. This sequence points to leverage cooling instead of aggressive downside continuation.

The dominance of long liquidations also suggests that traders chased the rally at elevated levels. Markets often clear stretched positioning after rapid moves, especially inside defined channels.

This current phase reflects stabilization and a reset in speculative positioning rather than immediate breakout continuation.

Downside liquidity clusters create pullback risk

The Binance FARTCOIN/USDT heatmap highlighted bright yellow leverage clusters between $0.208 and $0.210, positioned directly beneath the current price near $0.212.

Additional stacked liquidity extended toward the $0.19–$0.20 region, forming dense downside targets. Liquidity above price appeared thinner and more fragmented near $0.22–$0.23.

Markets frequently gravitate toward high-density leverage zones during consolidation phases.

Price may dip to clear those clusters before attempting another expansion. The heatmap does not display strong overhead squeeze fuel at present.

Instead, it shows that downside liquidity currently outweighs upside targets, increasing the probability of a controlled sweep below support before any sustained upside continuation develops.

To conclude, Fartcoin’s price surge reflects strong demand and visible whale participation, yet the broader descending channel still caps expansion.

Long liquidations now exceed shorts, signaling leverage cooling after the rally. Dense liquidity clusters sit below the current price, which raises the likelihood of a downside probe.

Unless bulls reclaim higher channel resistance with strength, this move remains reactive. The $0.20 level now determines whether buyers build continuation or allow another corrective phase to unfold.


Final Summary

  • Whale-driven demand sparked volatility, yet the descending channel still restricts sustained upside expansion.
  • Dense downside liquidity below $0.21 increases pullback risk before any confirmed breakout attempt.

Trending Cryptos

Related Questions

QWhat was the percentage increase in Fartcoin's price and what did it reach in 24 hours?

AFartcoin surged 13.46% in 24 hours to reach $0.2183.

QWhat key technical pattern is currently containing Fartcoin's price movement on the daily chart?

AFartcoin is trading inside a clearly defined descending channel that has shaped its price behavior for months.

QAccording to the liquidation data, which type of positions were liquidated more after the rally and what does this indicate?

ALong liquidations ($93.55K) outweighed short liquidations ($45.83K), indicating a cooling off of leverage and that traders likely chased the rally at elevated levels.

QWhere are the dense downside liquidity clusters located that create a pullback risk, according to the Binance heatmap?

AThe heatmap shows bright yellow leverage clusters directly beneath the current price between $0.208 and $0.210, with additional stacked liquidity extending toward the $0.19–$0.20 region.

QWhat is identified as the critical level that will determine if buyers can build continuation or allow another corrective phase?

AThe $0.20 level is identified as the critical support that will determine whether buyers build continuation or allow another corrective phase to unfold.

Related Reads

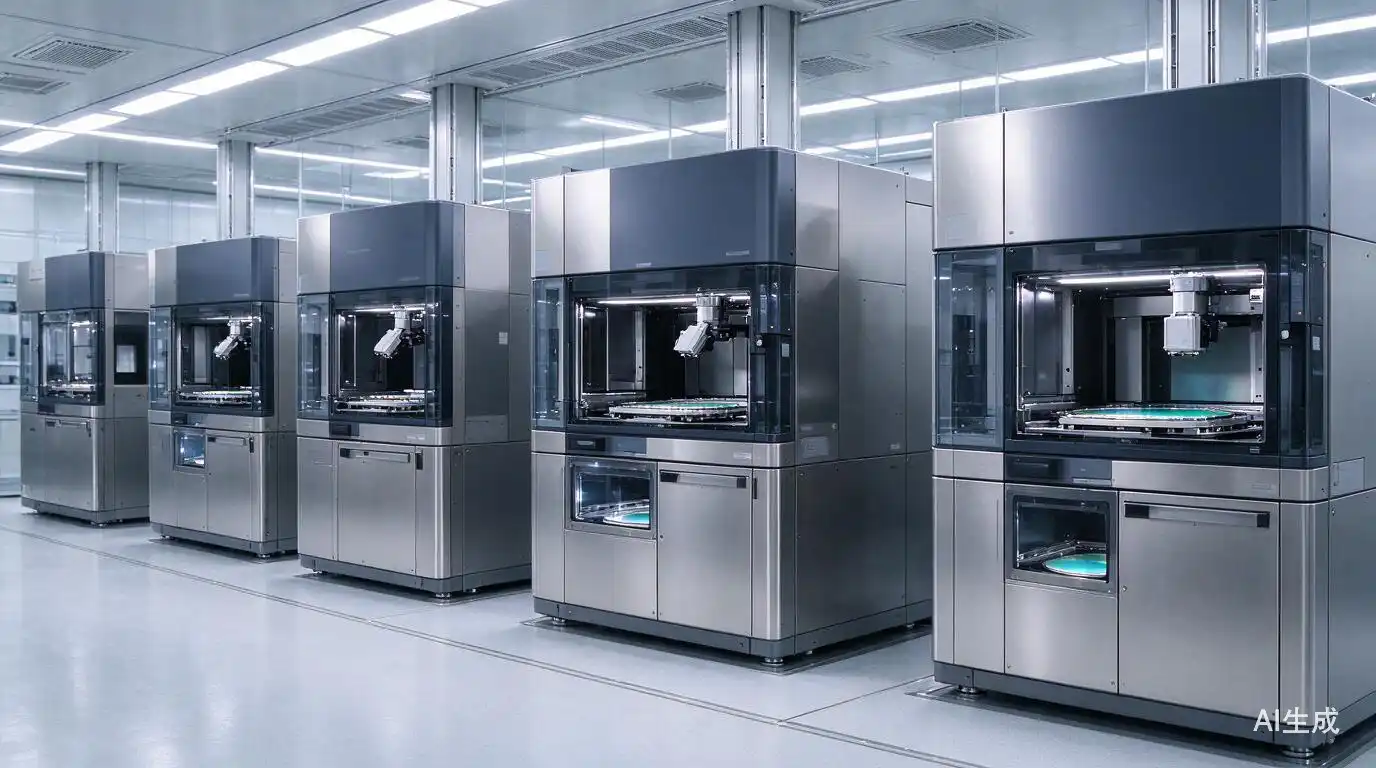
You've Never Heard of These Equipment Companies, and They're Appearing in Batches

A wave of new Chinese semiconductor equipment companies has emerged since 2024—names like Egram, Shenwei Zhichuang, Hengsheng Tianji, and others—most backed by state capital or major industrial players rather than traditional VCs. Registered capital ranges from tens of millions to 5.566 billion yuan, and many are targeting low-domesticated segments such as lithography, metrology, light sources, and advanced etching. Three common traits stand out: state or corporate dominance, a consistent focus on hard-to-localize links, and capital arriving before products. The core challenge in semiconductor equipment is not building a prototype but securing fab validation. Fabs are reluctant to risk yield on unproven tools, creating a vicious cycle: no machine time means no process data, no data means no orders, and no orders means no funding for iteration. This round of change centers on solving that validation bottleneck. A multi-layered validation ecosystem has formed. Public pilot lines for third-generation semiconductors, silicon photonics, MEMS, and specialty processes offer low-cost, high-tolerance machine time—Pinghu Laboratory's 8-inch line, for example, has validated hundreds of domestic tools. New fabs reserve isolated validation slots during planning, as Huarun Micro does for power devices. Risk-sharing mechanisms, such as Xiamen's 50% cost subsidy (up to 5 million yuan per firm) and national first-unit insurance covering up to 80% of premiums, reduce downstream trial costs. Demand has also diversified. AI-driven HBM and server expansion boosted fab capex, while export controls and 12–18 month lead times for foreign tools forced fabs to try domestic alternatives. Many new fab projects—new storage IDMs, specialty process plants, power and compound semiconductor lines, advanced packaging—are independent from established players and motivated to adopt domestic suppliers. Local funds often invest in both fabs and equipment firms, coordinating validation slots internally, though hard metrics like particle control and MTBF remain strict. Talent and capital conditions matured only recently. The 2018–2022 expansion trained a pool of engineers skilled in complete tools, process, vacuum RF, precision motion, and optics. Investors now accept years without revenue, betting on narrow segments—electron-beam metrology, light sources, vacuum subsystems, specialty cleaning, bonding—that avoid direct competition with established leaders and fit the new validation ecosystem. The industry is shifting from isolated breakthroughs by a few leaders to cluster-wide supply chain filling. Yet risks abound: multiple teams crowd the same niche, pilot-line success may not survive mass-production stability tests, over-reliance on affiliated lines can lead to customization traps, and new fab delays can abruptly halt validation.

marsbit3m ago

You've Never Heard of These Equipment Companies, and They're Appearing in Batches

marsbit3m ago

Nomura Research Report Interpretation: US Stock ETFs Absorb $6.9 Billion in a Single Week, Stock-Bond Divergence Continues to Intensify

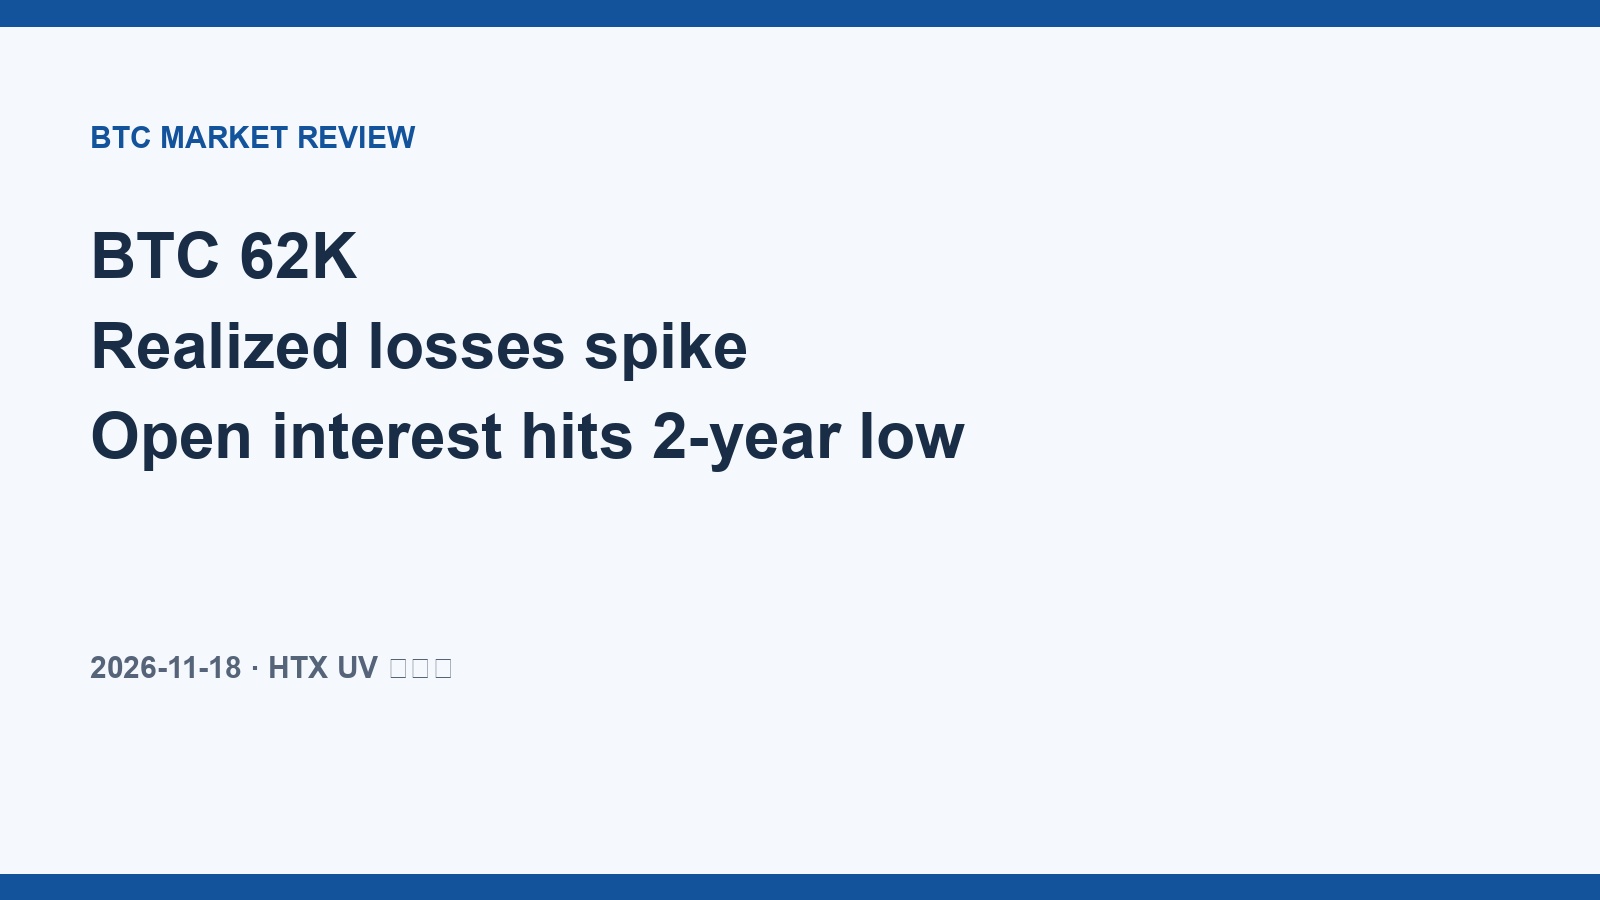
Nomura's FX Insights report, dated November 16, 2026, notes that although foreign inflows into U.S. equity ETFs and mutual funds rose to $6.9 billion in the week of November 9–13, up from $5.4 billion the prior week, the dip-buying momentum slowed somewhat in the latter half of the week. Nearly 39% of the weekly total (about $2.5 billion) flowed in on November 9 alone, extending the bargain-hunting seen after the previous week's selloff, when $2.1 billion entered on November 6. Daily buying stayed above $1 billion (November 11: $1.6 billion; November 12: $1.4 billion), but Nomura says the overall pace has begun to ease slightly. Divergence between equities and bonds is intensifying. U.S. bond ETFs and mutual funds saw $287 million of net outflows during the week, extending the prior week's $182 million outflow. Emerging-market thematic ETF inflows fell to $1.4 billion from $2.2 billion, with the split again favoring equities: $1.9 billion into stock funds versus $425 million of net outflows from bond funds. Asia-Pacific cross-border flows showed clear signs of braking. Net purchases of U.S. portfolio assets by previously active Korean retail investors plunged to $768 million from $2.6 billion, driven mainly by a sharp contraction in Korean retail buying of U.S. stocks. Taiwanese investors continued selling dollar assets, offloading another $439 million of USD-denominated bonds after net sales of $697 million the prior week.

marsbit1h ago

Nomura Research Report Interpretation: US Stock ETFs Absorb $6.9 Billion in a Single Week, Stock-Bond Divergence Continues to Intensify

marsbit1h ago

Trading

Spot

Hot Articles

How to Buy FARTCOIN

Welcome to HTX.com! We've made purchasing Fartcoin (FARTCOIN) simple and convenient. Follow our step-by-step guide to embark on your crypto journey.Step 1: Create Your HTX AccountUse your email or phone number to sign up for a free account on HTX. Experience a hassle-free registration journey and unlock all features.Get My AccountStep 2: Go to Buy Crypto and Choose Your Payment MethodCredit/Debit Card: Use your Visa or Mastercard to buy Fartcoin (FARTCOIN) instantly.Balance: Use funds from your HTX account balance to trade seamlessly.Third Parties: We've added popular payment methods such as Google Pay and Apple Pay to enhance convenience.P2P: Trade directly with other users on HTX.Over-the-Counter (OTC): We offer tailor-made services and competitive exchange rates for traders.Step 3: Store Your Fartcoin (FARTCOIN)After purchasing your Fartcoin (FARTCOIN), store it in your HTX account. Alternatively, you can send it elsewhere via blockchain transfer or use it to trade other cryptocurrencies.Step 4: Trade Fartcoin (FARTCOIN)Easily trade Fartcoin (FARTCOIN) on HTX's spot market. Simply access your account, select your trading pair, execute your trades, and monitor in real-time. We offer a user-friendly experience for both beginners and seasoned traders.

12.6k Total ViewsPublished 2024.10.23Updated 2026.09.11

How to Buy FARTCOIN

Discussions

Welcome to the HTX Community. Here, you can stay informed about the latest platform developments and gain access to professional market insights. Users' opinions on the price of FARTCOIN (FARTCOIN) are presented below.

活动图片