BTC Daily Adjustment in Progress, HYPE Nears Short-term Directional Decision | Invited Analysis

marsbitPublished on 2026-10-13Last updated on 2026-10-13

Abstract

This weekly analysis examines the recent price action of Bitcoin (BTC) and HYPE, focusing on key technical developments and outlining potential trading strategies. **Bitcoin (BTC) Analysis:** * **Market Trend Assessment:** The analysis applies a "52-week moving average confirmation method" to assess the broader trend. While BTC's weekly closing price has broken above this key average, the moving average itself remains in a downtrend, and a proper pullback confirmation is still lacking. The conclusion is that the rally from the July 1st low is still classified as a technical rebound, not yet confirming a new bull market. * **Daily Chart Structure:** The report argues that the five-wave rally (a-e) from the July low likely concluded at the September 21st high. The recent breakdown below the key support of $82,500, followed by a weak-volume rebound, supports this view. If the e-wave is complete, a larger corrective decline (potentially in three sub-waves) is anticipated. The first leg of this correction is underway, with an initial target around $78,000. * **Weekly Outlook & Strategy:** * **Outlook:** The focus is on the downside targets from the September 21st high. Key resistance is seen at $85,500 and the $87,500-$90,000 zone. Support levels are identified at $80,500-$82,500, $75,000-$78,000, and $69,100-$70,500. * **Strategy:** The medium-term posture is neutral/cautious, recommending watching for a potential pullback to a "channel" for confirmation. For ...

Last week saw substantial changes in Bitcoin's price movement. On October 8th, the price broke down with volume below the lower boundary of the consolidation range near $82,500, hitting a low of $80,400. Although it subsequently climbed back above $82,500, the rebound was notably low-volume, indicating insufficient bullish momentum. As we mentioned last issue regarding the two scenarios for the end of wave e, the market is leaning towards the second one: the high on September 21st is likely the peak of this rebound.

Zooming out to the weekly chart, only one of the three principles of the 52-week moving average confirmation method is currently met. According to our quantitative standards, the rally since July 1st should still be classified as an oversold rebound, not yet sufficient to confirm the establishment of a bull market.

HYPE also broke below the lower trendline of its two-month ascending channel on October 8th, entering a critical window for short-term directional choice.

This week's review will continue using the established analytical framework to focus on answering three questions:

  • Under the 52-week MA standard, what kind of market is Bitcoin currently in?
  • After the end of wave e, how will the daily-level correction structure unfold?
  • How should medium and short-term strategies respond to the potential correction?

We will also provide specific observation points and operational plans for HYPE during the pullback confirmation phase after breaking the channel.

Summary of this week's core trading views:

• Analysis of Bitcoin's current market trend nature (detailed in Part One)

• Analysis of Bitcoin's daily-level price structure (detailed in Part Two)

• Bitcoin's weekly price forecast and medium/short-term trading strategies (detailed in Part Three)

• Analysis of HYPE's daily-level price structure (detailed in Part Four)

• HYPE's weekly price forecast and short-term trading strategies (detailed in Part Five)

I. Analysis of Bitcoin's Current Market Trend Nature

1. In our weekly review published on August 31st, based on analyzing nearly 9 years of Bitcoin market history data, we proposed a simple, practical quantitative standard for trend judgment: the 52-week moving average confirmation method, clearly stating its quantitative principles.

1. Price Breakout Principle (Bear-to-Bull Transition): The weekly closing price breaks above the 52-week MA and remains above it for 2-3 consecutive weeks; a single-week piercing followed by a retreat is considered a false breakout.

2. Pullback Confirmation Principle: After the price runs above the 52-week MA for a period (typically 5 weeks or more), a pullback to retest the MA is desirable to further confirm the breakout's validity.

3. Bull Market Confirmation Principle: The price continues to trade above the 52-week MA, and the slope of the MA turns upward.

These constitute the three conditions for judging a bull market environment. After more than 40 trading days of market movement, what changes have occurred? What nature is the current market in? Bearing these questions, we will strictly follow the established quantitative standards to re-examine the market.
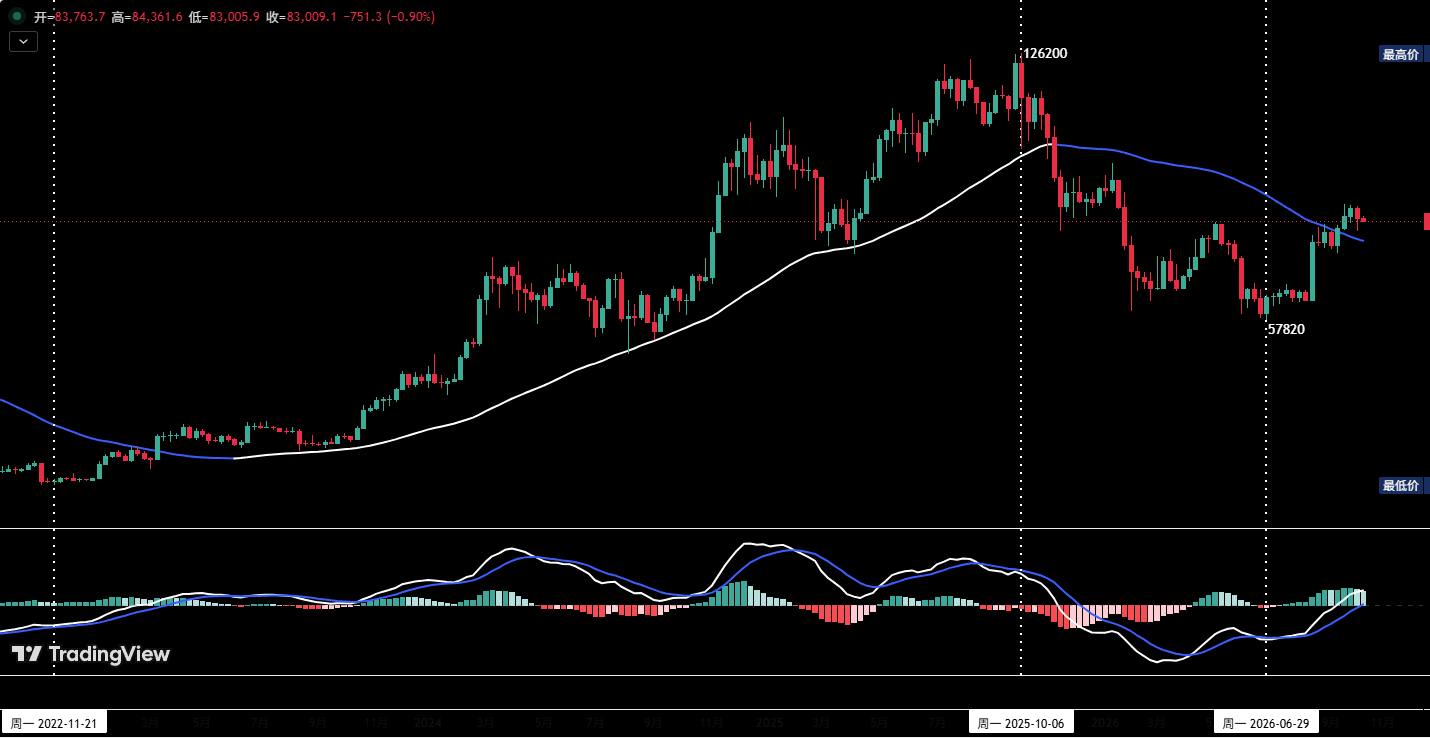
Figure 1: Bitcoin Weekly Candlestick Chart

2. As shown in Figure 1, within the weekly chart framework, the market displays the following characteristics:

1. Since the weekly close on September 14th, the price has successfully broken and held above the 52-week MA (white-blue) for four consecutive weeks, largely satisfying the price breakout principle.

2. During the 3rd week of trading above the 52-week MA, a pullback to test the MA occurred. However, it still falls short of the predetermined pullback confirmation principle.

3. The current 52-week MA is around $78,000, and its direction is still downward.

3. In summary, the current market performance only satisfies one of the three principles mentioned above, with the other two unmet. Based on this judgment, we believe:

1. The rally initiated from the July 1st low of $57,820 should still be defined as an oversold rebound, insufficient to confirm a bull market.

2. Even if this rally is later confirmed as a bull market Wave I (impulse) (meaning July 1st is the terminal point of the correction from $126,200), the direction of the 52-week MA will also need to undergo a process of "downward → flat → upward turn." It can be inferred that the price will most likely maintain a range-bound, oscillating pattern in the near future, with the probability of a Wave II (corrective) adjustment significantly increased.

II. Analysis of Bitcoin's Daily-Level Price Structure

1. Our last weekly review introduced the Elliott Wave theory framework to dissect the five-wave a→e rebound structure formed since the July 1st low, focusing on two scenarios for the end of wave e:

1. If the price continues to rally and surpasses the September 21st high, wave e is highly likely to terminate within the $87,500~$90,000 resistance zone.

2. If the price rallies but fails to surpass the September 21st high, shows a pattern of rising and then falling, and effectively breaks below the key $82,500 support, the probability of the September 21st high being the terminal point of wave e increases significantly.

Judging from last week's actual price action, the probability of the market unfolding the second scenario is increasing.

This week, we continue using the previous analytical framework to focus on: if wave e has indeed ended on September 21st, how will the subsequent market structure evolve.
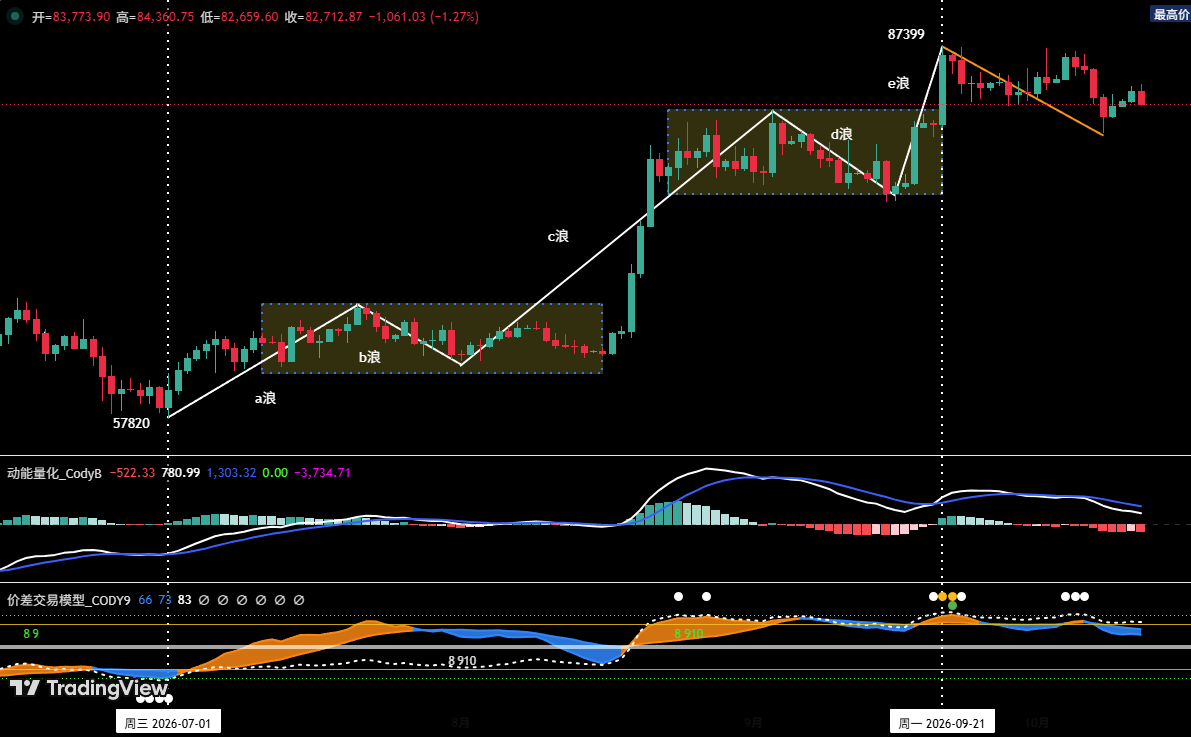
Figure 2: Bitcoin Daily Candlestick Chart

2. Review of last week's price action and rationale for judging wave e likely ended on September 21st:

1. Since the correction from the October 2nd high (~$87,154), the overall volume-price pattern has been one of high volume on declines and low volume on rebounds. On October 8th, it broke below the previous consolidation range's lower boundary (~$82,500), creating a short-term low of $80,400.

2. In the latter half of last week, although the price rebounded from the $80,400 low and regained the $82,500 support, it did so with noticeably low volume, indicating insufficient bullish intent. The current movement can be viewed as a pullback confirmation after breaking the key support. As long as a high-volume rally does not appear, the correction could resume at any time.

3. Technical indicator level:

• Our proprietary "Momentum Quantification Model" currently shows a momentum top divergence state.

• Our proprietary "Spread Trading Model" indicator remains in a high range. If the price rises again, top warning signals could be triggered at any moment.

4. On the weekly chart, after consecutive rallies, the recent three weekly candlesticks have formed a "top fracturing" pattern. If this week's low falls further below $80,400, a weekly-level top pattern will likely be established.

5. In summary, the probability of wave e ending on September 21st is extremely high.

3. Potential evolution of the market structure after wave e ends:

1. If wave e has ended, the market is expected to enter a daily-level correction, which will likely unfold in a three-wave corrective pattern.

2. The current movement can be defined as the first leg of correction (wave i), starting from the September 21st high of $87,399. It has run for 21 trading days so far, with an initial downside target around $78,000.

3. After the daily-level wave i correction ends, a wave ii rebound is expected, followed potentially by a wave iii correction, which will be analyzed in detail later.

III. Bitcoin's Weekly Price Forecast and Trading Strategies

1. BTC Weekly Price Movement Forecast

This week's core view: Focus on the target for the correction starting from the September 21st high.

2. Key Resistance Levels

• First Resistance Zone: Around $85,500 (previous important level)

• Second Resistance Zone: $87,500~$90,000 area (previous important level)

3. Key Support Levels

• First Support Zone: $80,500~$82,500 area (previous key support)

• Second Support Zone: $75,000~$78,000 area (previous important support)

• Third Support Zone: $69,100~$70,500 area (previous important support)

4. This Week's Trading Strategies (Excluding Sudden News Impact)

1. Medium-term Strategy:
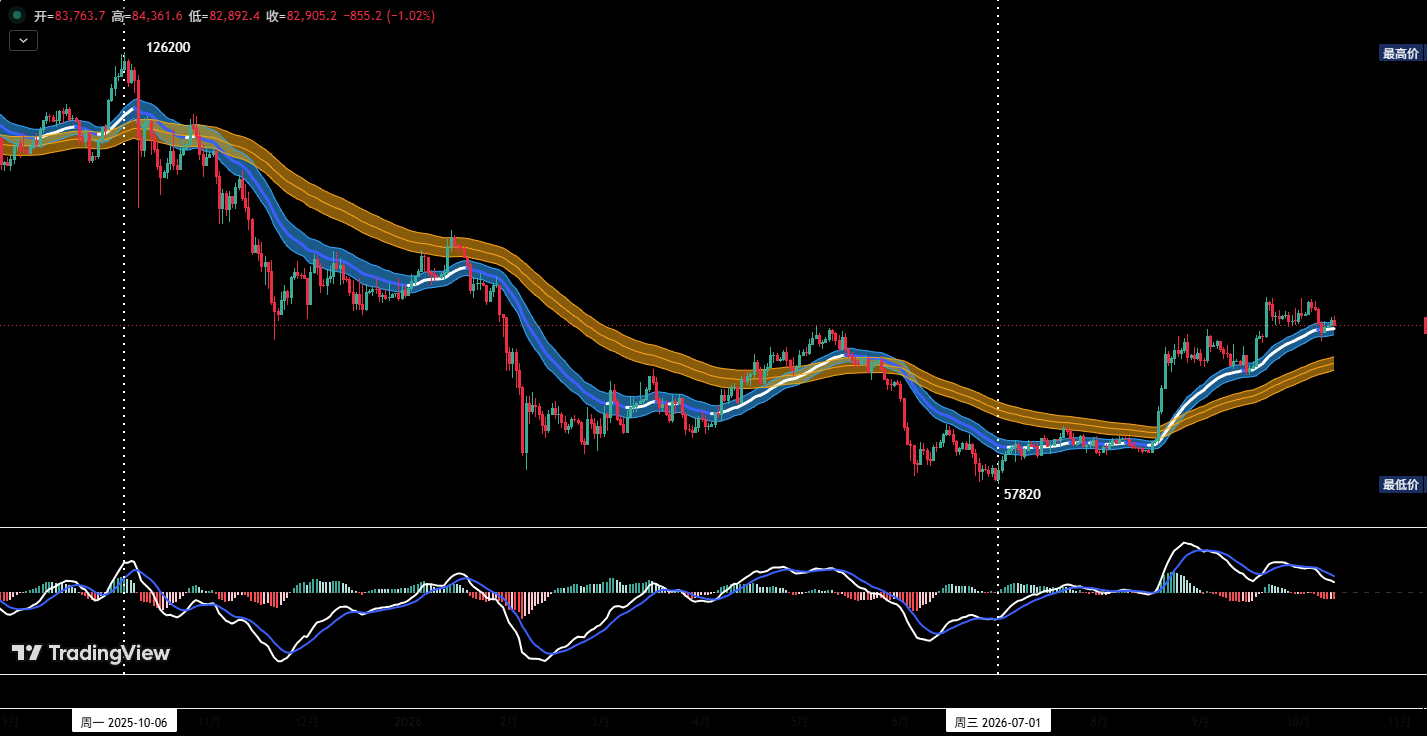
Figure 3: Bitcoin _ Daily Candlestick Chart: (Position Monitoring Model)

Position Monitoring Model: As shown in Figure 3, the price has broken the "Bull-Bear Channel" but has not yet entered the pullback confirmation stage. Therefore, the current medium-term strategy is primarily to stay in cash and observe.

2. Short-term Strategy: Utilize 30% of capital, set stop-losses, and look for "spread" trading opportunities based on support and resistance levels. (Use 30-minute/60-minute as the operation cycle).

3. For short-term operations, to dynamically adapt to the market's complex evolution, we have prepared Plan A/B in advance.

• Plan A: Lightly test short in strong resistance zones.

• Entry: If early this week the price rises to the $85,500~$87,500 zone, shows clear signs of rejection and decline, and the quantitative model simultaneously issues a top signal, consider establishing a short position of approximately 30%.

• Risk Control: Set an initial stop-loss.

• Exit: When the price adjusts near important support levels combined with model signals, consider exiting in batches to take profits.

• Plan B: Go with the trend upon effective breakdown.

• Entry: If the price falls and effectively loses the $80,500~$82,500 support zone, those in cash can consider establishing a short position of approximately 30%.

• Risk Control: Set an initial stop-loss.

• Exit: When the price further adjusts near important support levels combined with model signals, consider exiting in batches to take profits.

IV. Analysis of HYPE's Daily-Level Price Structure
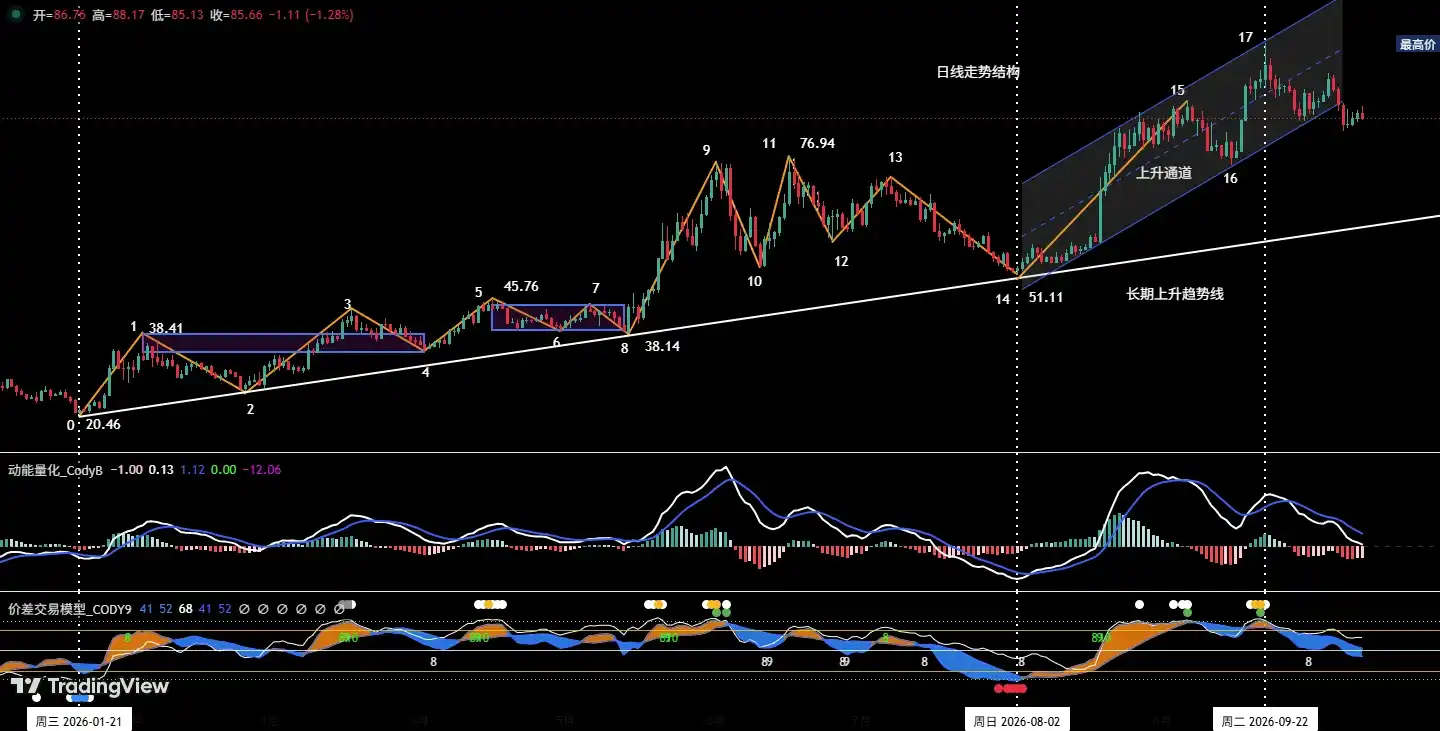
Figure 4: HYPE Daily Candlestick Chart

1. Review of HYPE's Last Week Performance

1. As shown in Figure 4, we clearly stated in last week's review: Since the August 2nd low of $51.11 initiated this rally, HYPE's price has been moving within an ascending channel (the lower channel line is defined by connecting the lows of August 12th and September 15th; the upper line is defined by connecting the highs of August 22nd and September 22nd).

2. On October 8th, HYPE recorded a medium bearish candle, dropping 4.82%, decisively breaking below the ascending channel's lower trendline. If it cannot reclaim the channel line soon, it indicates signs of weakness.

2. Analysis of Current Price Structure (Figure 4)

1. From a daily perspective, the long-term uptrend line (white) remains intact, indicating the larger cycle is still in an uptrend.

2. The daily chart shows the price has broken below the original ascending channel's lower trendline and is currently in the pullback confirmation phase after the breakdown, at a critical juncture for short-term direction. If the price can reclaim and hold above the channel line and continue upward, the short-term sideways-upward pattern remains. If it effectively loses this level, the price will likely maintain a corrective pattern this week, with the next adjustment target looking at the $75~$77 area.

V. HYPE's Weekly Price Forecast and Short-Term Trading Strategies

1. HYPE Weekly Price Movement Forecast

1. Key Resistance Levels:

• First Resistance: $88~$90 area

• Second Resistance: Around $94

• Third Resistance: Around $102

2. Key Support Levels:

• First Support: $80~$82 area;

• Second Support: $75~$77 area;

3. This Week's Core View:

Focus on observing the outcome of the price's pullback to the channel's lower trendline.

2. HYPE Short-Term Trading Strategies This Week

1. Lightly test long upon holding above channel line.

If the price continues to rise this week and firmly reclaims the channel's lower trendline, those in cash can consider lightly testing a long position. Keep position size under 30%, set a stop-loss, and strictly execute.

2. Lightly test long upon strong support holding.

If the price continues to fall to the $75~$77 area and shows signs of stabilization and bottoming, those in cash can consider lightly testing a long position. Keep position size under 30%, set a strict stop-loss, and maintain discipline.

VI. Special Notes​​

1. When entering a position: Immediately set an initial stop-loss.

2. When profit reaches 1%: Move the stop-loss to the entry price (breakeven point) to ensure capital safety.

3. When profit reaches 2%: Move the stop-loss to the 1% profit level.

4. Continuous tracking: Thereafter, for every additional 1% profit, move the stop-loss up by 1% to dynamically protect and lock in profits.

Financial markets are ever-changing. All market analysis and trading strategies require dynamic adjustment. All views, analytical models, and operational strategies mentioned in this article are derived from personal technical analysis, intended solely for personal trading log purposes. They do not constitute any investment advice or operational basis. The market carries risks, investment requires caution. Do not make decisions based on this article.

Trending Cryptos

Related Questions

QBased on the article, what are the three conditions of the '52-Week Moving Average Confirmation Method' used to judge a bull market?

AThe three conditions are: 1. Price Breakout Principle (Bear-to-Bull Transition): The weekly closing price breaks above the 52-week moving average and holds above it for 2-3 consecutive weeks. 2. Pullback Confirmation Principle: After the price runs above the moving average for a period (typically over 5 weeks), a pullback to test the moving average occurs to enhance the validity of the breakout. 3. Bull Market Confirmation Principle: The price continues to run above the 52-week moving average, and the slope of the moving average turns upward.

QWhat is the core view of the article regarding Bitcoin's (BTC) market trend after analyzing the 52-week moving average?

AThe core view is that the current market only meets one of the three conditions for a bull market confirmation. Therefore, the rebound starting from the low on July 1st should still be defined as an oversold rebound, which is insufficient to confirm the establishment of a bull market. If this rebound is later confirmed as a bull market Wave I, a subsequent Wave II correction is highly probable.

QAccording to the analysis, what two scenarios were proposed for the end of Bitcoin's e-wave, and which one is becoming more likely?

AThe two scenarios are: 1. If the price continues to rally and breaks the September 21 high, the e-wave would likely end in the 87,500~90,000 USD resistance zone. 2. If the price fails to break the September 21 high, shows a pattern of rallying and then falling, and effectively breaks the 82,500 USD key support, then the September 21 high is highly likely the end point of the e-wave. Based on last week's price action, the probability of the second scenario is increasing.

QWhat is the key observation point for HYPE's price action in the coming week according to the article?

AThe key observation point is the outcome of the price's pullback to test the lower rail of its previous ascending channel, which it broke on October 8th. Whether the price can reclaim and hold above this channel line will determine the short-term direction.

QWhat are the two main short-term trading strategies (A and B) suggested for Bitcoin in the article?

AStrategy A (Light Short at Strong Resistance): If the price rises to the 85,500~87,500 USD zone early in the week, shows clear signs of rejection, and quantitative models issue top signals, a short position of about 30% can be established. Strategy B (Follow-through Short on Breakout): If the price declines and effectively loses the 80,500~82,500 USD support zone, short sellers can establish a short position of about 30%.

Related Reads

Backed by $80 Million, Alta is Building the Infrastructure to Bring Global Banking Onchain

Alta, a financial infrastructure company building institutional-grade blockchain infrastructure for global finance, has announced $80 million in total funding, including a $47.5 million Series A led by Index Ventures with participation from GV, Blackbird Ventures, Square Peg, and Capital 49, plus $32.5 million in prior seed financing. Unlike blockchains built mainly for crypto-native applications, Alta is designed to meet the privacy, compliance, neutrality, and operational needs of regulated financial institutions while supporting transactions across assets, chains, and jurisdictions. Its architecture is built on recursive zero-knowledge cryptography, keeping balances, transactions, identities, and compliance policies private while verifying that transactions meet required rules. CEO Loong Wang said existing blockchains aren't designed for institutional privacy and compliance requirements, and Alta builds these features directly into the chain. President Catherine Porter noted that as AI agents increasingly make financial decisions and execute transactions, trust becomes even more critical. Airwallex has chosen to build on Alta, connecting its global payments infrastructure to Alta's blockchain technology, supporting stablecoin pay-ins and pay-outs plus connectivity to local fiat payment networks across 200 countries and 90 currencies. Alta's first product will help businesses manage liquidity more efficiently, reducing cash buffers tied up in prefunded accounts—an estimated $4 trillion globally—through tokenized assets, just-in-time funding, more efficient foreign exchange, and instant movement in and out of yield-bearing tokenized assets. Investors praised the founding team's deep-tech blockchain engineering, institutional go-to-market knowledge, and track record of scaling multi-billion-dollar businesses. The new funding will support continued development of Alta's blockchain infrastructure, expansion of institutional partnerships and global financial connectivity, and growth of its engineering and compliance teams.

TheNewsCrypto4h ago

Backed by $80 Million, Alta is Building the Infrastructure to Bring Global Banking Onchain

TheNewsCrypto4h ago

Hitting a Record for U.S. Tech IPO Fundraising, Anthropic to Raise Up to $90.4 Billion, Fully Diluted Valuation of $1.4 Trillion

Anthropic is pursuing what would be the largest tech IPO in U.S. history, targeting a fully diluted valuation of $1.4 trillion and aiming to become the first publicly listed frontier AI lab. According to its SEC filing, Anthropic seeks to raise up to $90.4 billion through an IPO and private placement—a base IPO of up to $64.4 billion plus $26 billion from seven tech giants (Alphabet, Nvidia, AMD, Broadcom, Micron, Microsoft and TSMC). Shares are priced at $70–78; at the top end the valuation is about $1.02 trillion, slightly above its $965 billion private valuation. The stock will list on Nasdaq under ANT, with Goldman Sachs and Morgan Stanley as lead underwriters, pricing on Nov 18. Including the greenshoe, proceeds could approach $100 billion, surpassing SpaceX's $86.5 billion record. The filing reveals rapid growth: Q3 revenue neared $17 billion versus $1.4 billion a year earlier, with annualized revenue around $81 billion as of Oct 31 and over 11,900 customers spending more than $100,000 annually. Profitability remains unstable—Q3 operating expenses jumped 292% to $17.5 billion, producing a $567 million operating loss after a brief Q2 profit, hit by $5 billion in short-term compute contracts and $2 billion in non-cash charitable matching costs. Price cuts trimmed Q3 revenue growth by about $600 million. Costs are enormous: total committed spending is $895 billion, mostly for compute and chips, with about $70 billion due within a year. Revenue depends almost entirely on AI services. Anthropic is embedding Claude in healthcare, life sciences, legal and accounting work, with over 90% of its codebase now contributed by Claude. It lists as a public benefit corporation with a Long-Term Benefit Trust controlling board elections, and warns AI could pose catastrophic or existential risks. Rival OpenAI targets a 2027 IPO at a $1.25 trillion valuation. Each of Anthropic's seven co-founders holds about 1.4%.

marsbit4h ago

Hitting a Record for U.S. Tech IPO Fundraising, Anthropic to Raise Up to $90.4 Billion, Fully Diluted Valuation of $1.4 Trillion

marsbit4h ago

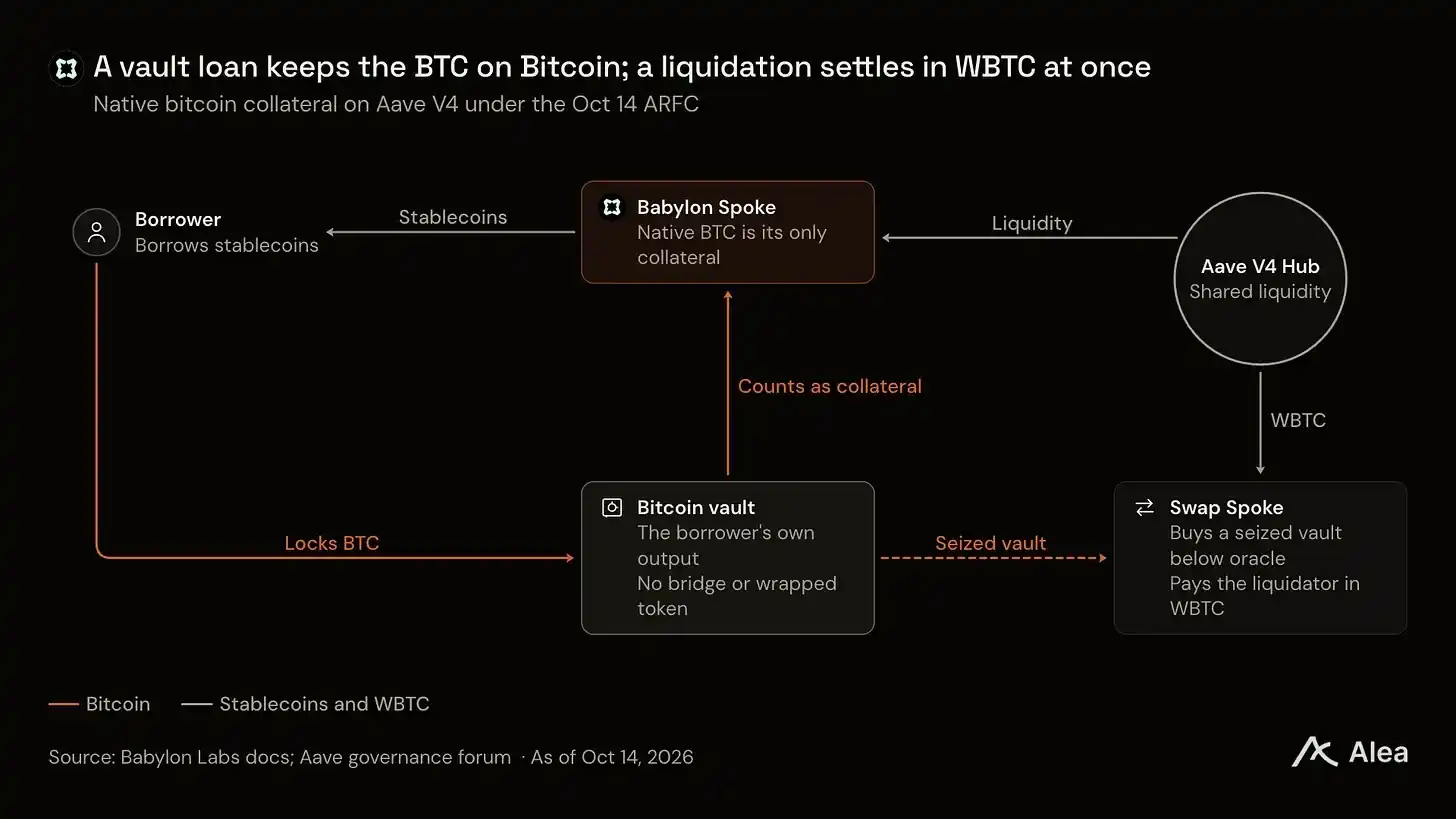
Babylon Knocks on Aave's Door: Can You Borrow Stablecoins Directly with Bitcoin as Collateral?

On November 9, Aave DAO approved the Babylon proposal with 100% of votes in favor. The proposal allows native Bitcoin to be used as collateral on Aave V4 to borrow stablecoins—no wrapping, no cross-chain bridging, and no third-party custody required. The collateral ratio is set at 78%. The proposal also specifies revenue sharing: Aave DAO takes the first $500,000 annually, with amounts above that split with Babylon, and 4% to 7% allocated to buy back AAVE and BABY tokens. Bitcoin is entering the largest lending market on Ethereum in its native form. According to Babylon's announcement on X, Bitcoin holders can lock BTC while retaining control of their private keys and borrow assets such as USDT and USDC. The proposal now moves to the AIP stage, the final on-chain execution vote, with a mainnet target of late 2026. Participation and scale will be limited initially and opened up in phases. The proposal was first submitted in May, passed a community temperature check in June with 299,743 AAVE in favor and zero against, and Aave founder Stani Kulechov voiced support on October 14. Borrowers lock BTC into a Taproot vault on the Bitcoin chain, with the coins remaining in addresses under their own names. A non-transferable accounting token is generated on Ethereum in an amount equal to the locked Bitcoin, serving as collateral proof in Aave V4. According to LlamaRisk, the collateral ratio for native BTC is 78% with a maximum liquidation bonus of 5.55%, comparable to wrapped assets like WBTC and cbBTC in Aave V4's core market. This fills a long-standing custody gap in Bitcoin lending. Existing Bitcoin collateral on Aave relies mainly on wrapped assets such as WBTC and cbBTC, exposing users to counterparty risk. Babylon's proposal is the first aimed at unwrapped native Bitcoin. On cost, Babylon estimates annualized vault borrowing costs of 3% to 5%, compared with the 9% to 16% common on centralized lending platforms. By the end of Q3, about 40,481 BTC were staked on Babylon, all held on the Bitcoin chain in script form. Revenue distribution is tiered. Only two revenue sources count: the liquidity fees Aave collects from interest paid by borrowers on this line, and liquidation fees. The first $500,000 each year goes entirely to Aave DAO. In the $500,000 to $2 million tier, Aave DAO takes 78%, Babylon 18%, and 4% goes to buybacks. The ratios rise by tier, and above $6 million, Aave DAO takes 61.5%, Babylon 31.5%, and the buyback ratio rises to 7%. Buybacks purchase tokens on the open market—85% AAVE and 15% BABY—with purchased tokens split equally between Aave DAO and the Babylon Foundation. Alea Research estimates that if this line generates $10 million in annual revenue, Aave DAO would receive about $6.92 million, Babylon about $2.52 million, and buybacks about $560,000, of which about $84,000 would buy BABY. Alea notes this would be BABY's first value channel from borrower interest. Still, relative to the two tokens' existing scale, the buyback is limited. Aave's own annual buyback budget was cut from $50 million to $30 million in a March proposal, while BABY adds about 1.58 million tokens daily, worth about $7 million annually at Q3 prices. Scale is the next hurdle. The initial credit line from Aave's core pool is $8 million each for USDT and USDC, $2 million each for USDG and RLUSD, and $1 million for GHO—about $21 million total. The native BTC collateral cap is 300 BTC. Limits will rise with demand but require Aave DAO approval each time. Aave V4 had about $310 million in effective loans in September. Liquidation is another focus. Because Bitcoin stays on the Bitcoin chain, the proposal sets up a liquidation settlement module: liquidators buy seized vaults with WBTC, and arbitrageurs redeem BTC on the Bitcoin chain. Collateral thus escapes custodian dependence, but liquidation still relies on a custodial asset like WBTC. Emergency pause authority sits with a 3/5 multisig of Aave Labs, LlamaRisk, and Babylon, with no time lock on pause or resume; during a pause, repayment and liquidation are also blocked. The multisig cannot move users' Bitcoin. Two dates matter: Babylon plans to submit BABY tokenomics changes to governance by end of November, aiming to direct more new issuance to vault business, and about 2,999 BTC staked via Gate custody matures around November 30. Whether the tokenomics adjustment lands before mainnet will determine how much real buyback this native Bitcoin lending business ultimately brings to both tokens.

marsbit5h ago

Babylon Knocks on Aave's Door: Can You Borrow Stablecoins Directly with Bitcoin as Collateral?

marsbit5h ago

Trading

Spot

Hot Articles

How to Buy HYPE

Welcome to HTX.com! We've made purchasing Hyperliquid (HYPE) simple and convenient. Follow our step-by-step guide to embark on your crypto journey.Step 1: Create Your HTX AccountUse your email or phone number to sign up for a free account on HTX. Experience a hassle-free registration journey and unlock all features.Get My AccountStep 2: Go to Buy Crypto and Choose Your Payment MethodCredit/Debit Card: Use your Visa or Mastercard to buy Hyperliquid (HYPE) instantly.Balance: Use funds from your HTX account balance to trade seamlessly.Third Parties: We've added popular payment methods such as Google Pay and Apple Pay to enhance convenience.P2P: Trade directly with other users on HTX.Over-the-Counter (OTC): We offer tailor-made services and competitive exchange rates for traders.Step 3: Store Your Hyperliquid (HYPE)After purchasing your Hyperliquid (HYPE), store it in your HTX account. Alternatively, you can send it elsewhere via blockchain transfer or use it to trade other cryptocurrencies.Step 4: Trade Hyperliquid (HYPE)Easily trade Hyperliquid (HYPE) on HTX's spot market. Simply access your account, select your trading pair, execute your trades, and monitor in real-time. We offer a user-friendly experience for both beginners and seasoned traders.

12.0k Total ViewsPublished 2024.03.29Updated 2026.09.23

How to Buy HYPE

Discussions

Welcome to the HTX Community. Here, you can stay informed about the latest platform developments and gain access to professional market insights. Users' opinions on the price of HYPE (HYPE) are presented below.

活动图片