$86,000 Is a Thick Wall. Can Bitcoin Break Through This Time?

marsbitPublished on 2026-09-11Last updated on 2026-09-11

Abstract

Bitcoin has risen 23% over 21 trading days, significantly outperforming flat equities, though it remains down 10% year-to-date. The rally has stalled just below a significant resistance ceiling between $83,000 and $86,000, identified by three converging metrics: the Long-Term Holder cost basis, futures liquidation heatmaps, and the breakeven point for US spot ETFs. Seller pressure has notably diminished, with the Sell-Side Risk Ratio at less than half its August peak, indicating limited supply at current prices. Long-term holders are not participating in selling, while altcoins, though rising, are not gaining market share against Bitcoin—a pattern divergent from previous cycle tops. Strong bottom signals that persisted for months have now faded, leaving the market between a repaired floor and an untested ceiling. A sustained break above $86,000 on low selling pressure would confirm absorption of this resistance, while a return of sellers or a break below the $62k-$65k support zone would invalidate the bullish structure.

Original article by Frederik Theissen, Glassnode

Compiled | Express Messenger @Odaily Planet Daily
Key Points:

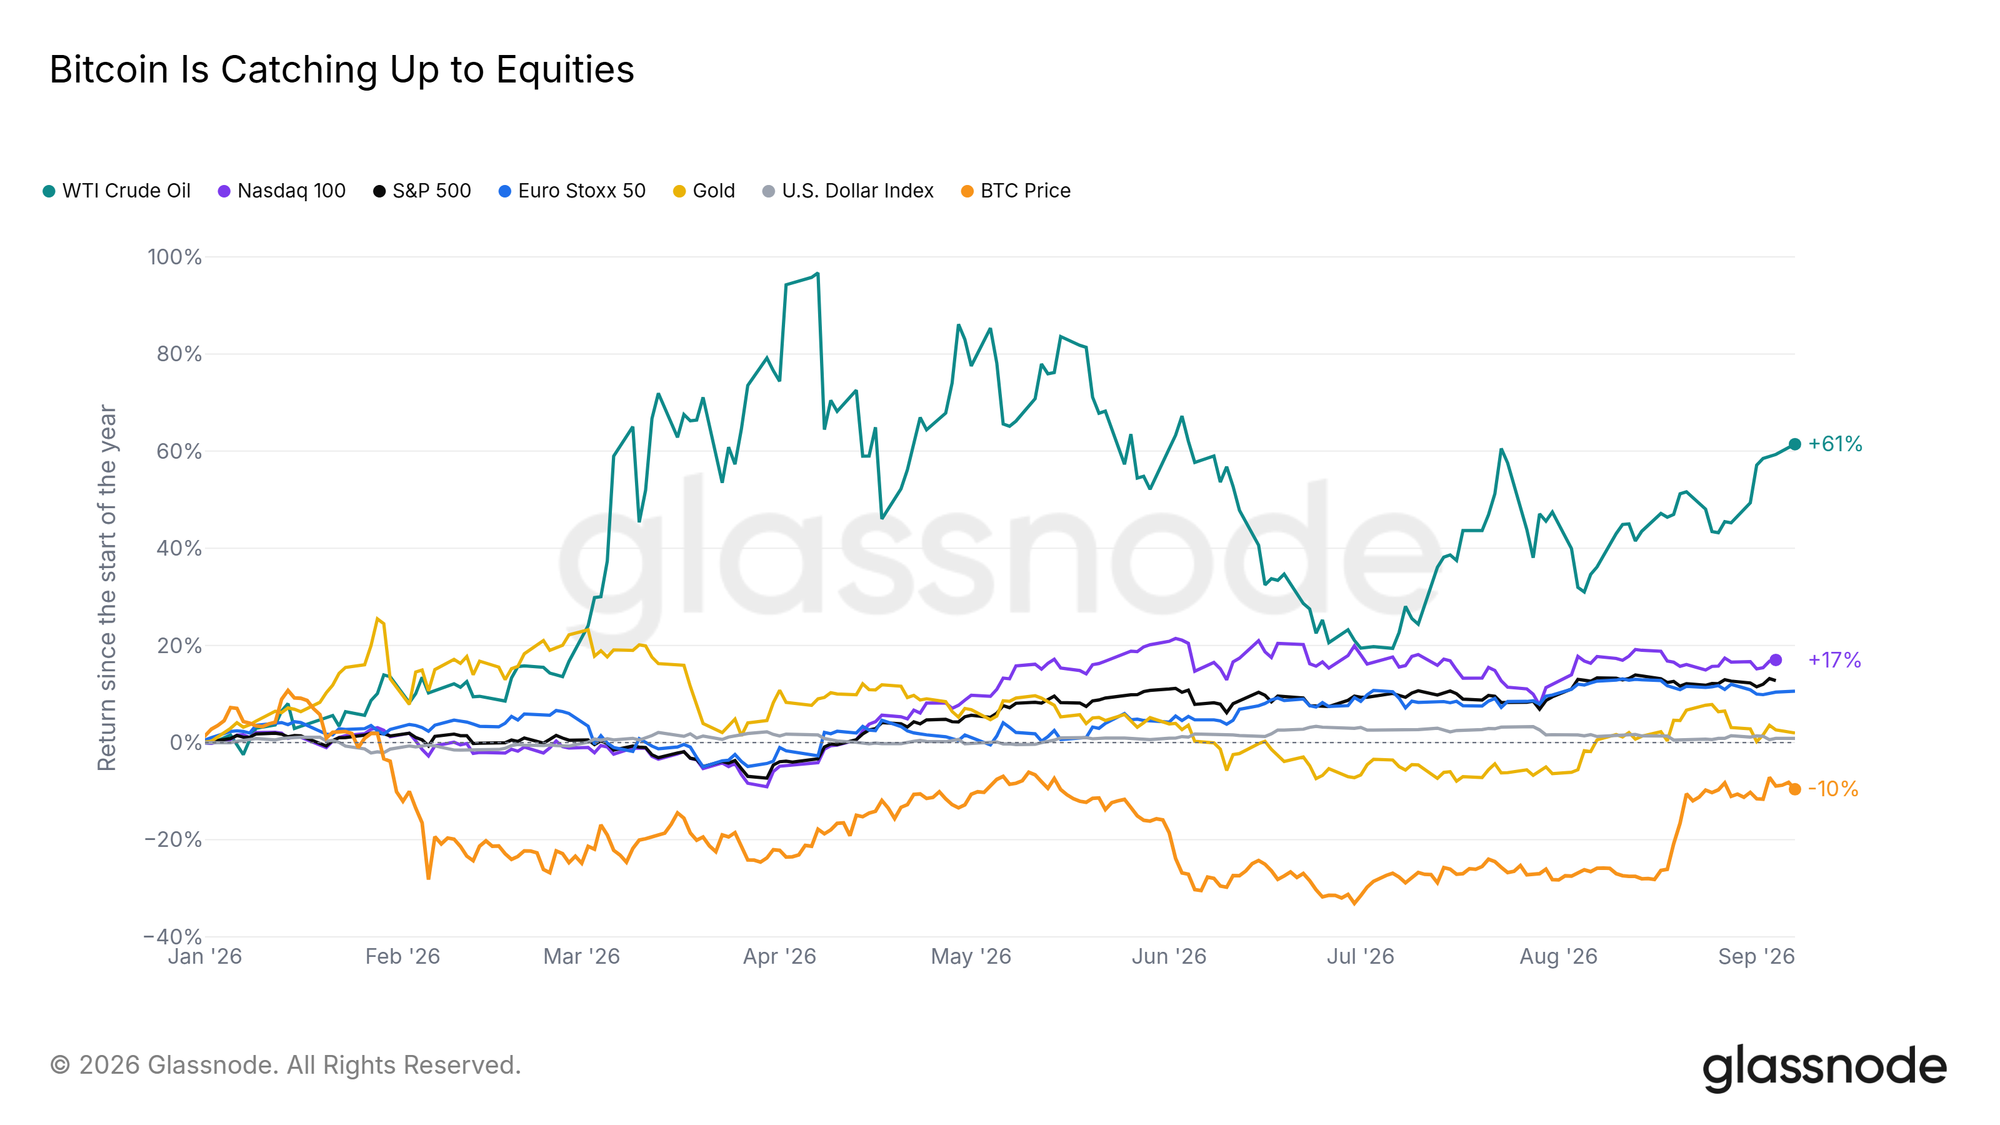
  • Bitcoin rose 23% in 21 trading days while equities were flat, but it's still down 10% year-to-date.
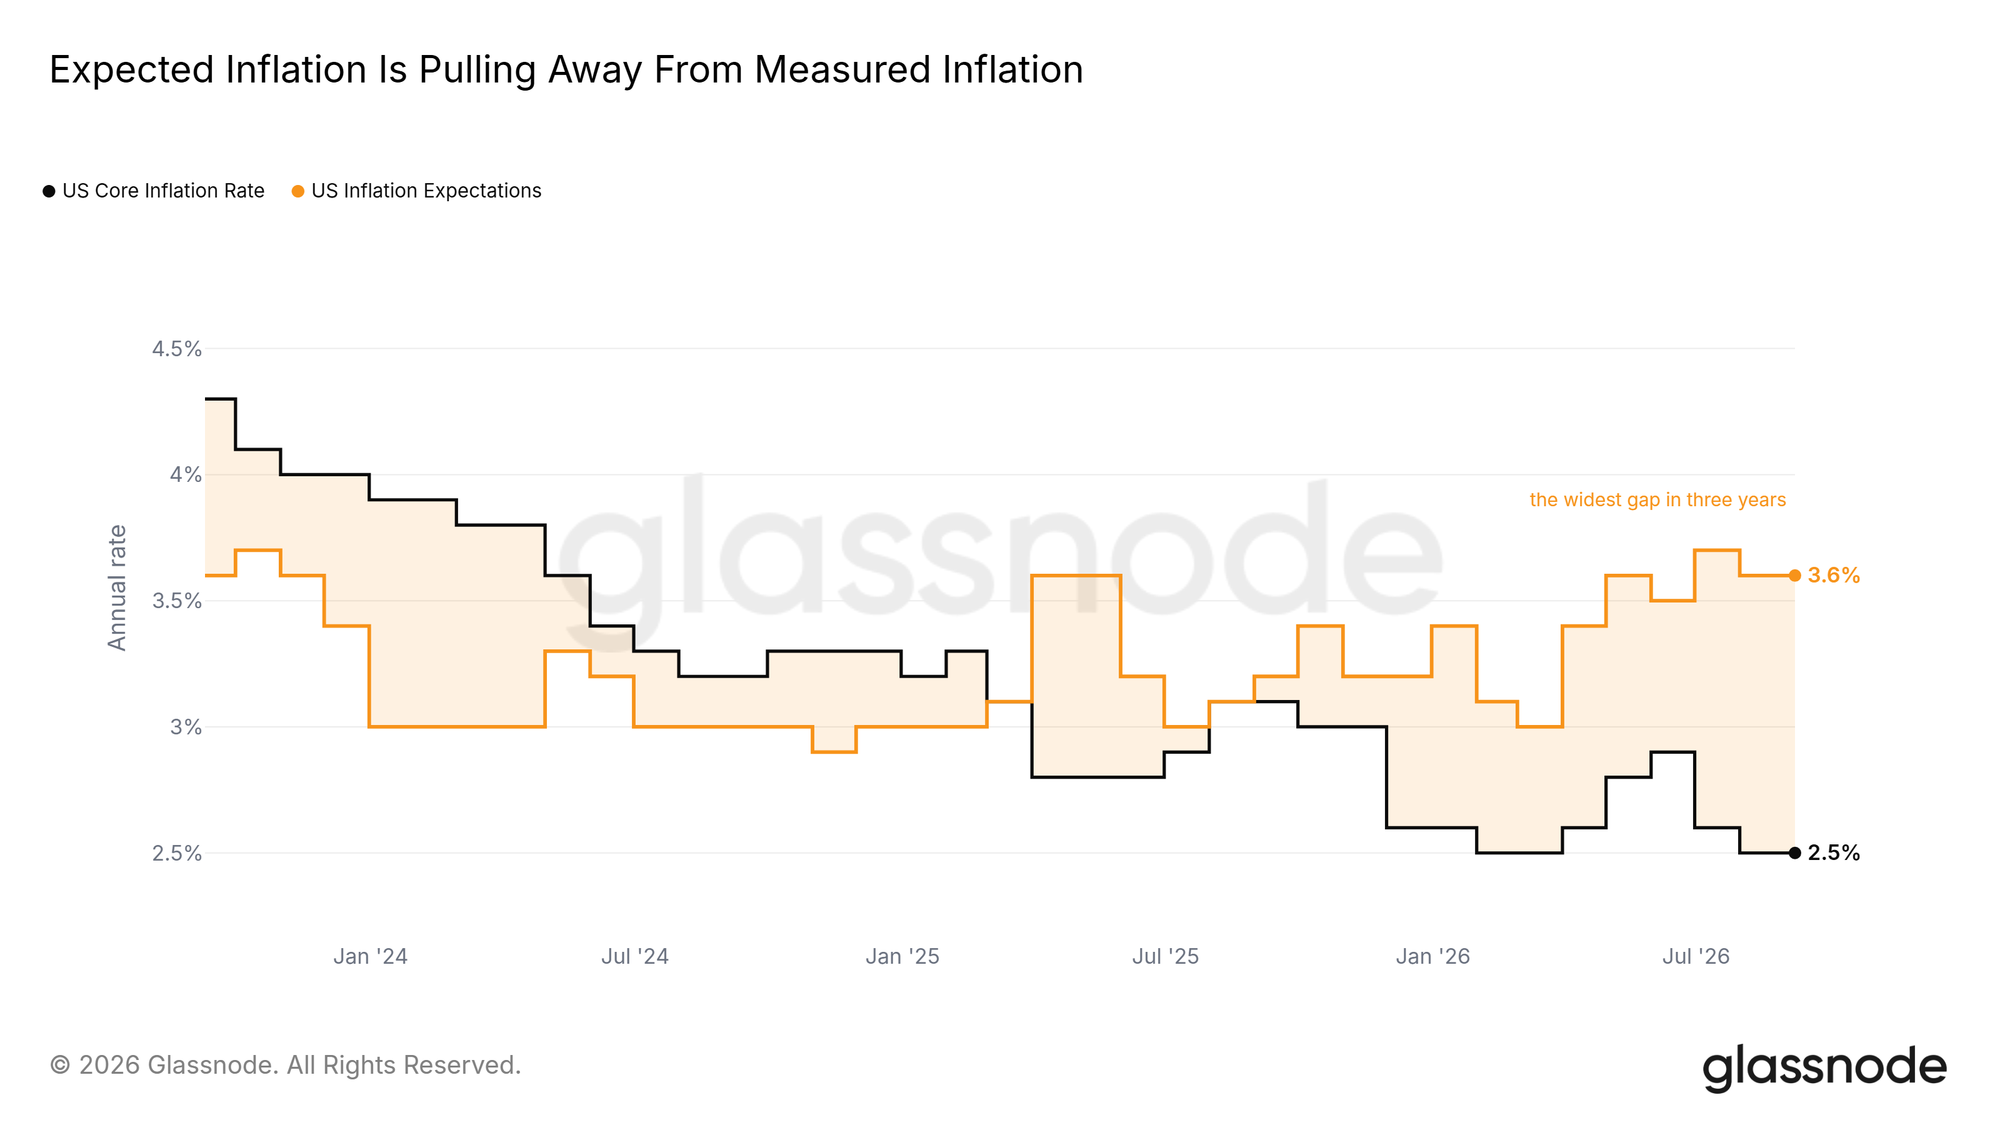
  • Core inflation has dropped to a two-year low of 2.5%, while inflation expectations sit at 3.6%, the widest gap in three years.
  • The Long-Term Holder cost basis, liquidation map, and ETF breakeven all point to a ceiling at $83,000 to $86,000; spot price stalled 1.5% shy of that range.
  • The pace of selling into the range high is less than half of August's, with long-term holders not participating this round.
  • The strong resonance of bottom signals has faded after months; altcoins are not taking share from Bitcoin as they did prior to previous tops.

A Late Start to the Year, Narrowing the Gap from the Bottom

Over the past 21 trading days, Bitcoin returned 23%, while the S&P 500 and Nasdaq 100 were flat and the Euro Stoxx 50 declined. Within this window, Bitcoin ranked first among the seven asset classes we track. Looking at year-to-date performance, the opposite is true: Bitcoin is still down 10% since January, while the S&P 500 is up 13%, and the year's top performer, crude oil, is far ahead of both.

Bitcoin spent the entire summer at the bottom of the rankings and is only now starting to close the gap. A month of relative strength has only repaired a small portion of the losses from the first half of the year.

Expectations Running Ahead of Data

Bitcoin is rebounding into a bond market that remains restrictive. The US 10-year Treasury yield closed at 4.8%, matching its two-year high, while the 2-year yield is about 63 basis points above the 3.75% Fed funds target rate—this is the bond market's way of leaning toward tighter policy.

The actual inflation data does not support this inclination. US core inflation has dropped to 2.5%, a two-year low, while US inflation expectations are at 3.6%. The gap between household expectations and the actual reported data is the widest in three years. Yields are at cycle highs while core inflation data is cooling, making rate hikes difficult to justify; the August CPI release on September 11, 2026, and the FOMC decision on September 16, 2026, will directly test this. If core data moves back toward expectations, the case for tight policy strengthens; if core data remains low, then the move in yields has already run ahead of the data.
Viewing the Ceiling from Every Angle

Stalling Under the Wall

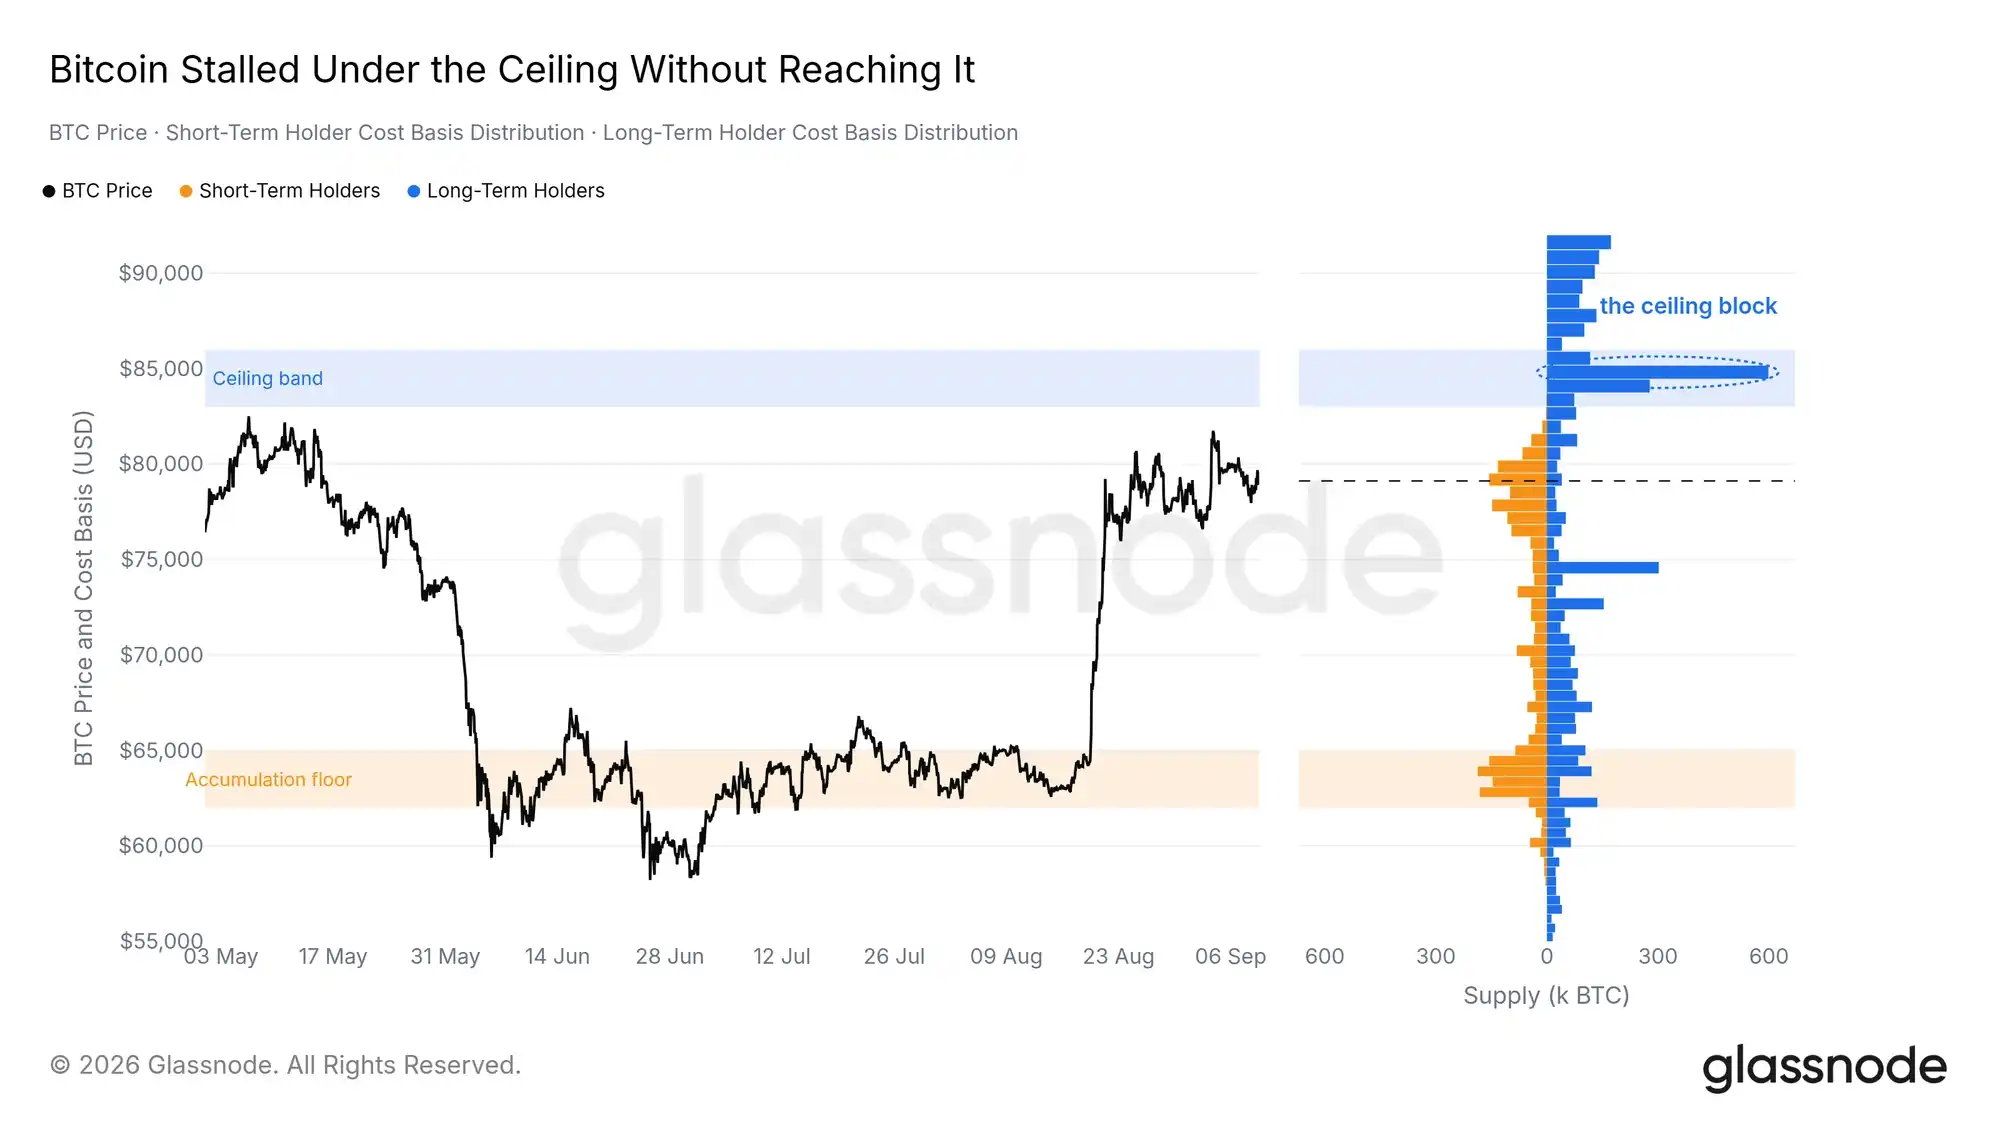
Last week's report placed the overhead ceiling between $83,000 and $86,000. The current rally tested this but did not reach the range. On September 3, 2026, spot made a higher high than August but stalled 1.5% shy of the bottom of that range, subsequently stabilizing in a narrow band just below $80,000.

The Long-Term Holder Cost Basis Distribution shows why this range is important. Approximately 1.07 million BTC were acquired between $83,000 and $86,000, almost entirely by long-term holders, with the single heaviest price bucket around $85,000. This block has barely moved in thirty days. The change happened below it: supply acquired between $76,000 and $82,000 (mainly recent buyers) grew, while the accumulation floor between $62,000 and $65,000 thinned as coins bought there rotated. The market rebuilt a floor directly below spot while leaving the overhead ceiling intact.
The Same Wall on the Liquidation Map

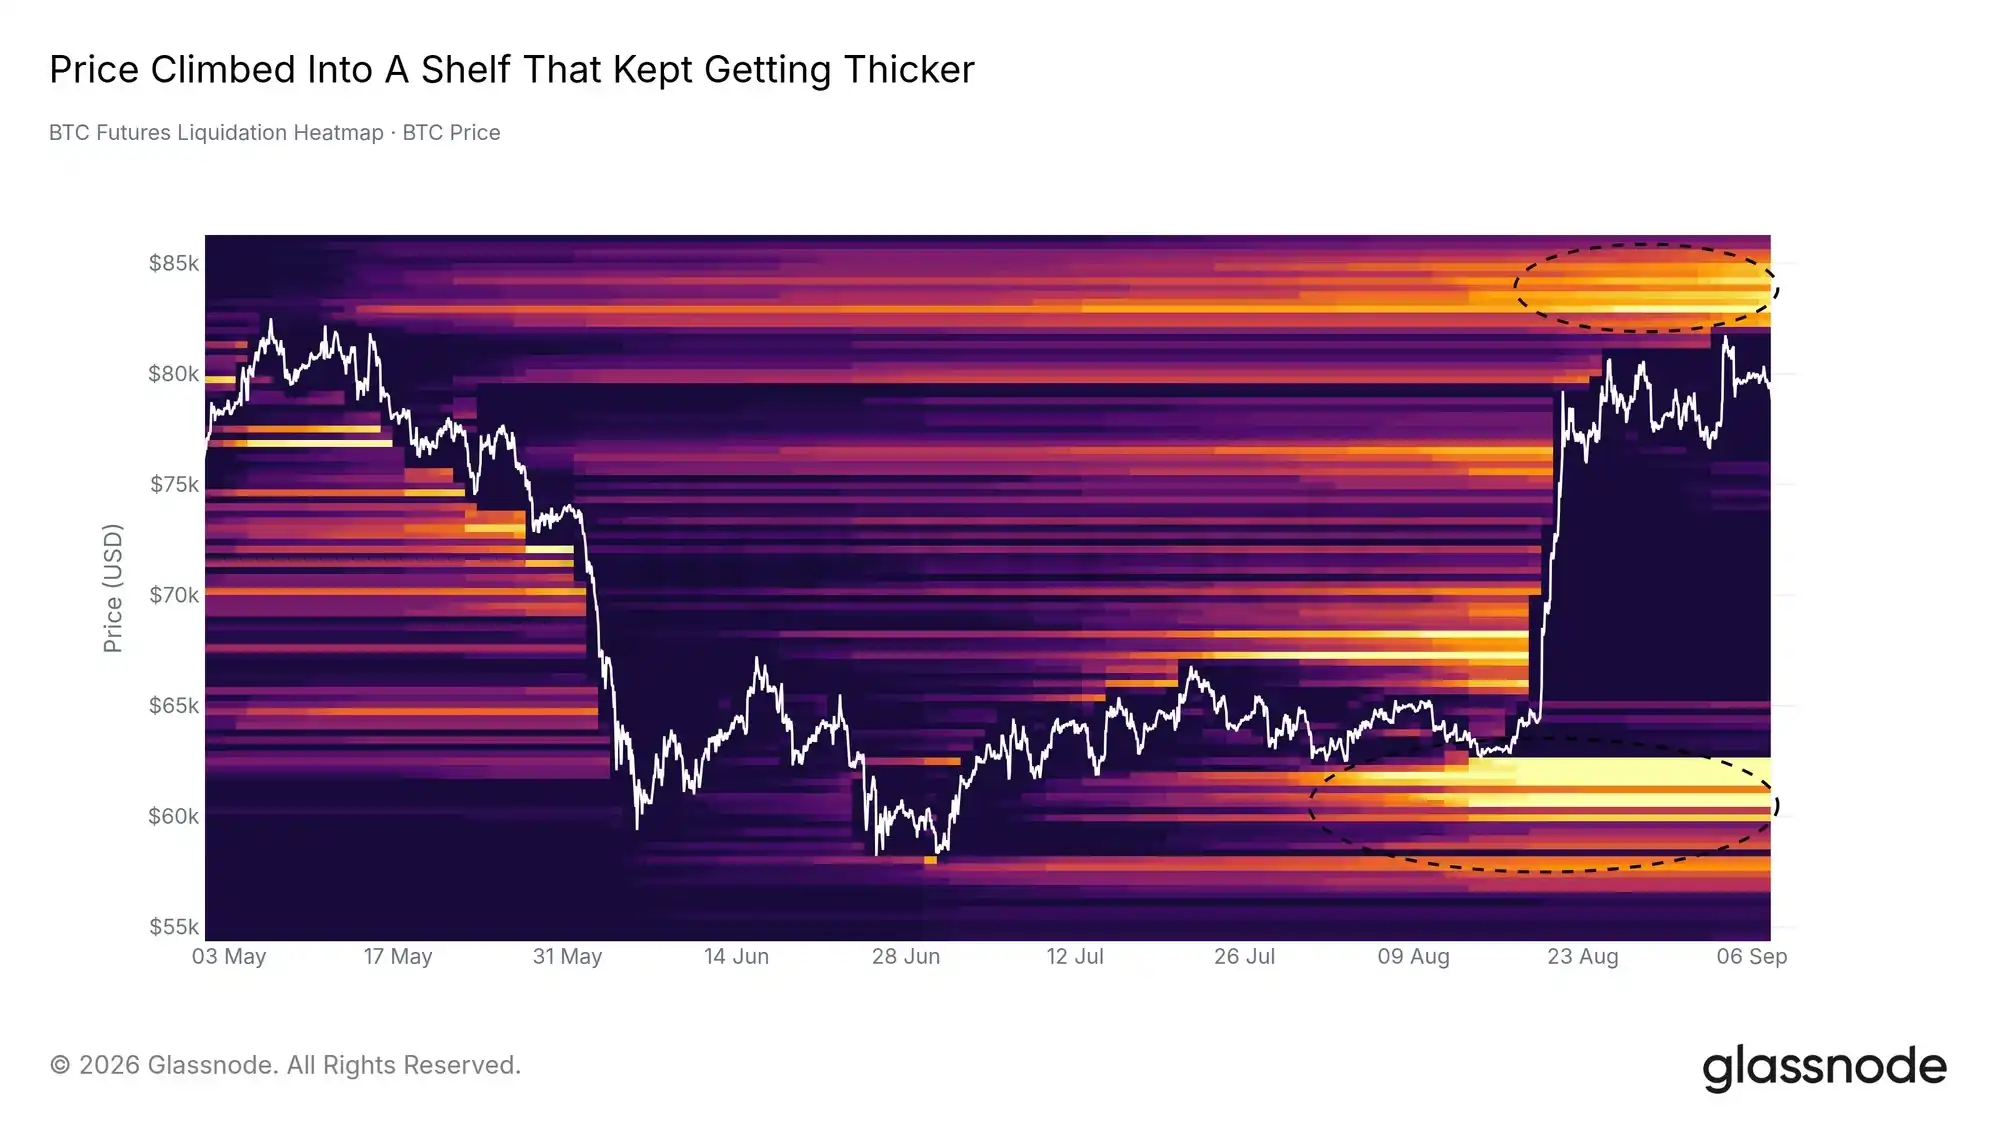
The derivatives market also draws the ceiling at the same level. On the BTC Futures Liquidation Heatmap, the wall of short liquidation levels between $82,000 and $86,000 has grown 21% since the short squeeze on August 19, 2026, while the entire map has shrunk by a third. This wall now carries a share of modeled liquidations nearing the highest level in the map's history.

Price is climbing into a wall that keeps thickening and stalled before reaching it. Below spot, the long liquidation cluster between $60,000 and $63,000 remains intact, framing the range from below. A sustained break above $86,000 would consume the densest fuel of short liquidations on the map; a break below $63,000 would start to chew through the long side.
Institutional Breakeven Just Slightly Above

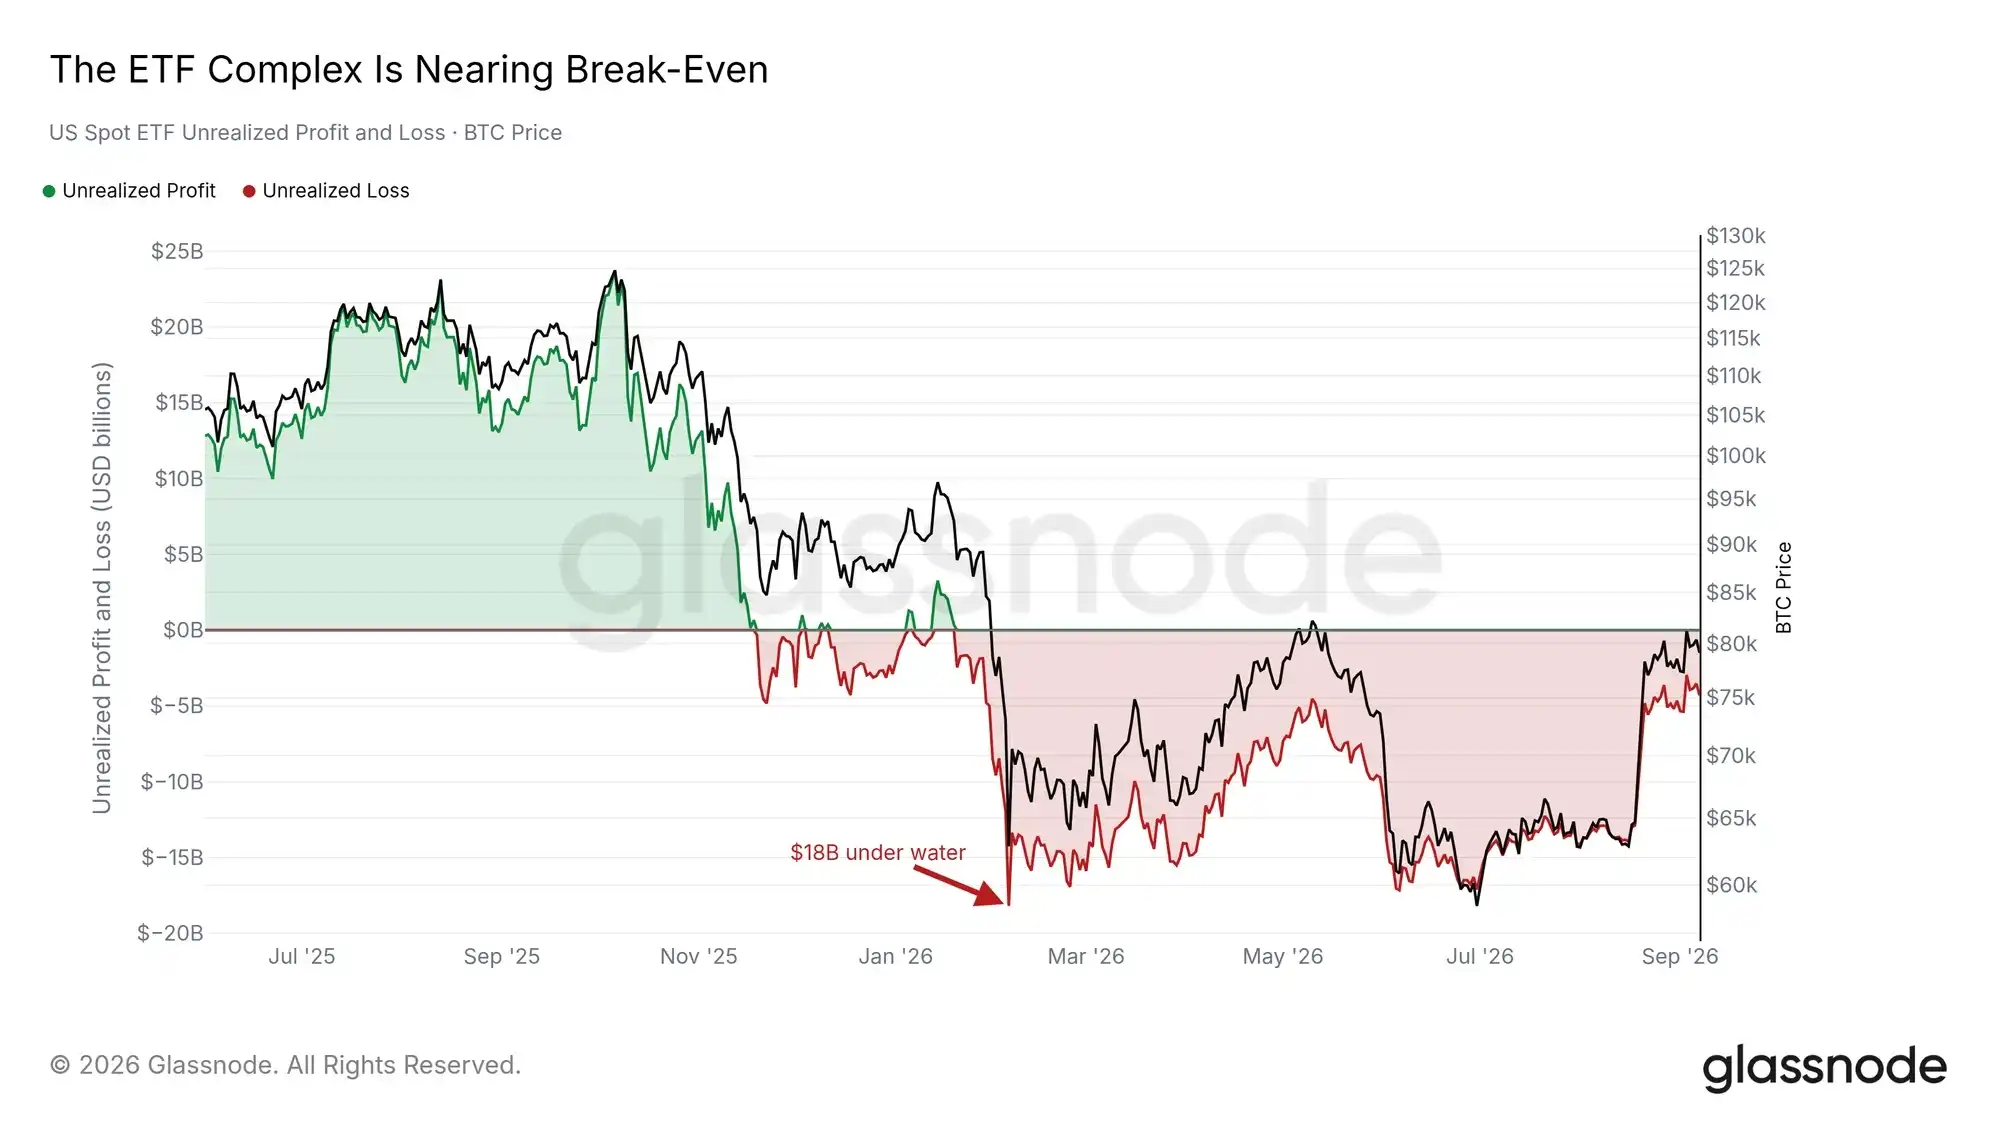
A third independent source also lands at the same level. The US spot ETF complex, measured by the coins created since its launch, has a breakeven point near $86,000. It has closed below that level for 228 consecutive trading days, with its paper loss bottoming at around $18 billion on February 5, 2026. This rally has narrowed that loss to about $3.9 billion, bringing the complex closest to breakeven since January.

Corporate treasuries' breakeven is near $80,500, slightly below spot. Among our tracked cost basis models, five are above the current price, ranging from the True Market Mean at $76,600 to the ETF breakeven at $86,000. Overhead resistance is a cluster of real cost bases, and reclaiming $86,000 would put the largest institutional holders back in profit for the first time this year.
Sellers Are Not Showing Up

Selling Dwindles on the Run Toward Highs

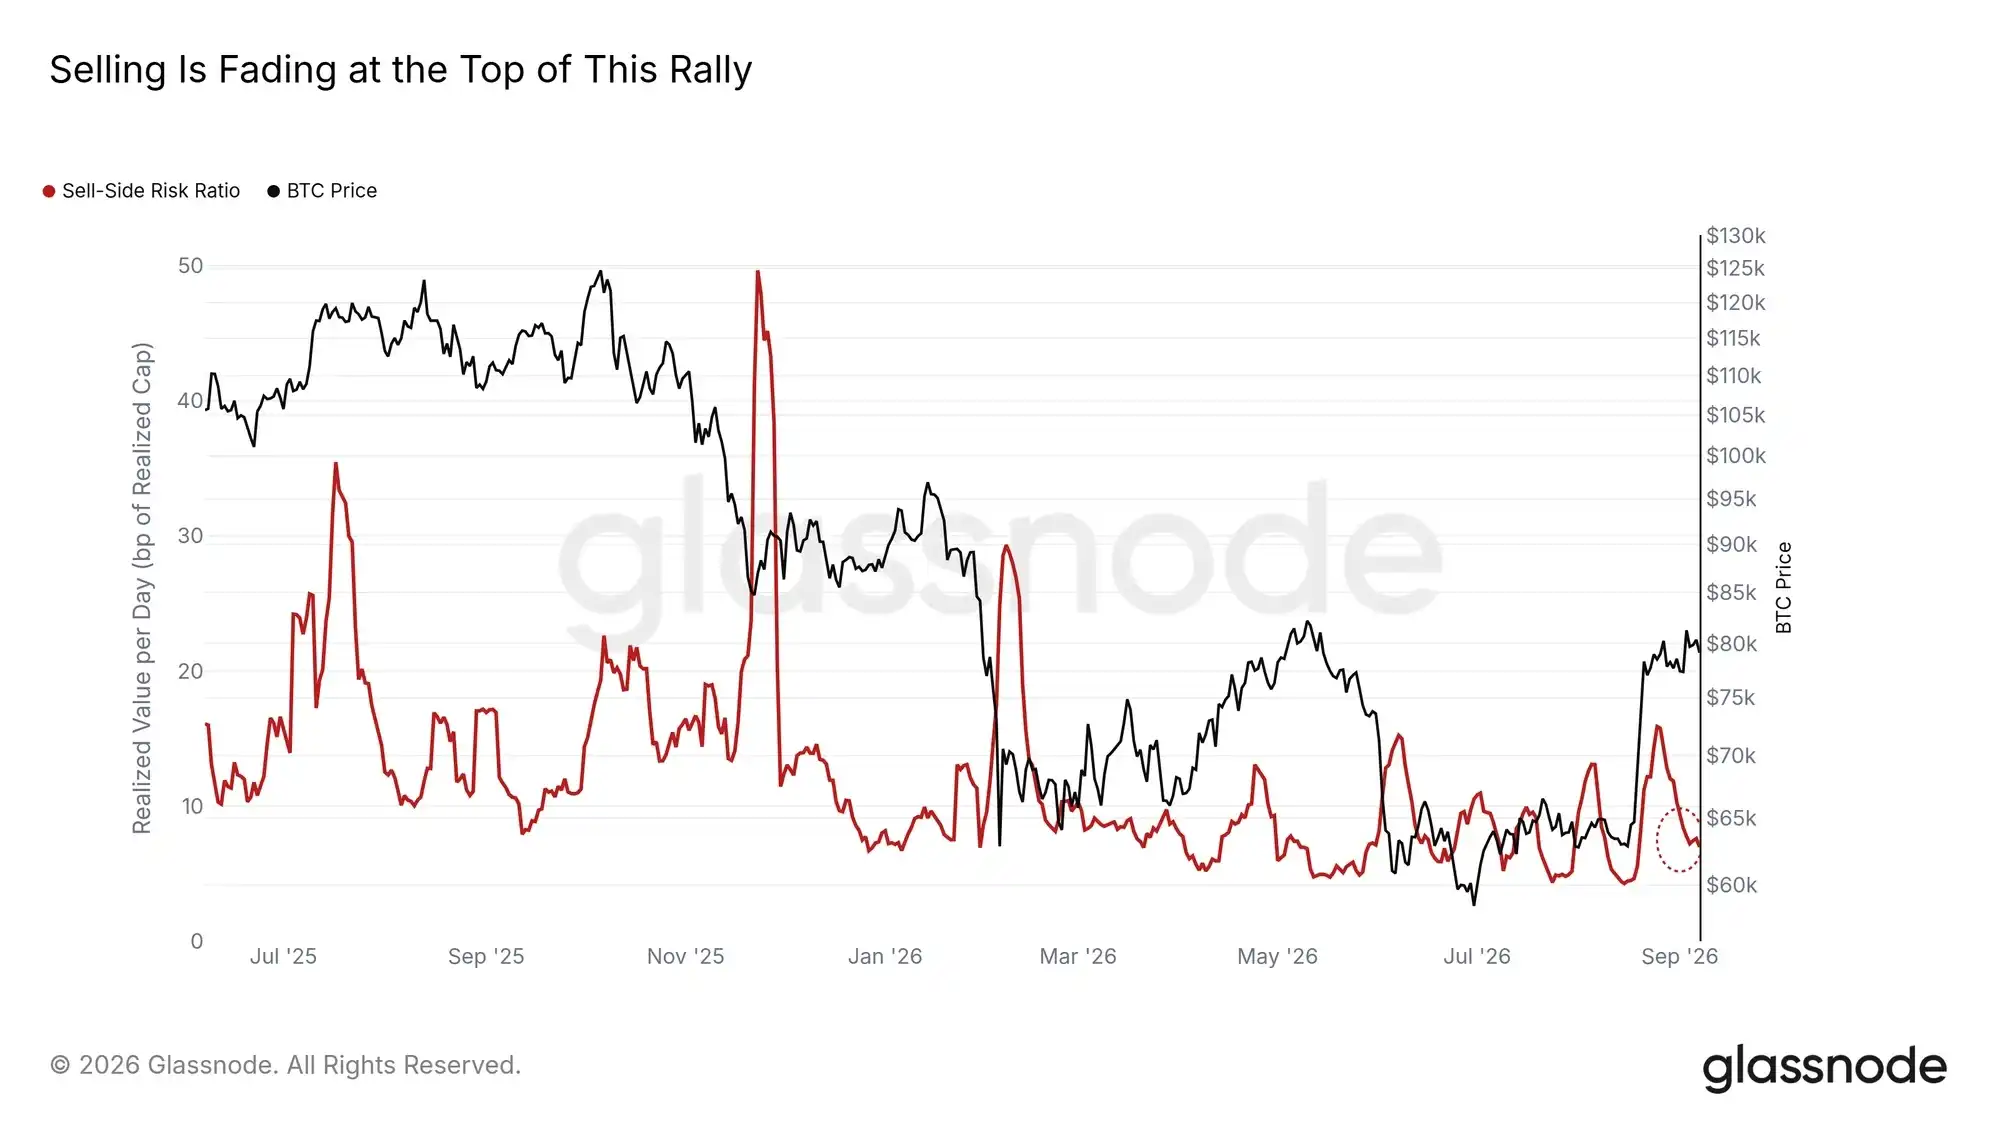
The push toward the ceiling has not drawn out much supply. The Sell-Side Risk Ratio (realized profit plus realized loss, measured relative to Realized Cap) on a seven-day basis has fallen to 7 basis points per day, less than half of August's peak of 16 bps. At the July 2025 and October 2025 highs, the same metric spiked to 35 and 23 bps, respectively. Only a handful of days in the past year have had readings lower than today.

Long-Term Holders' share of realized profit has dropped from 88% at the August peak to 47%, and the September realized profit peak on September 3, 2026, was less than half the size of August's. This month's sellers are recent buyers, and even they are selling less. If this metric sustainably returns above 16 bps, it would signal sellers of August's magnitude are back; until then, the spot market is short of sellers at these prices.
Between Bottom and Top

Bottom Signals Have Served Their Purpose

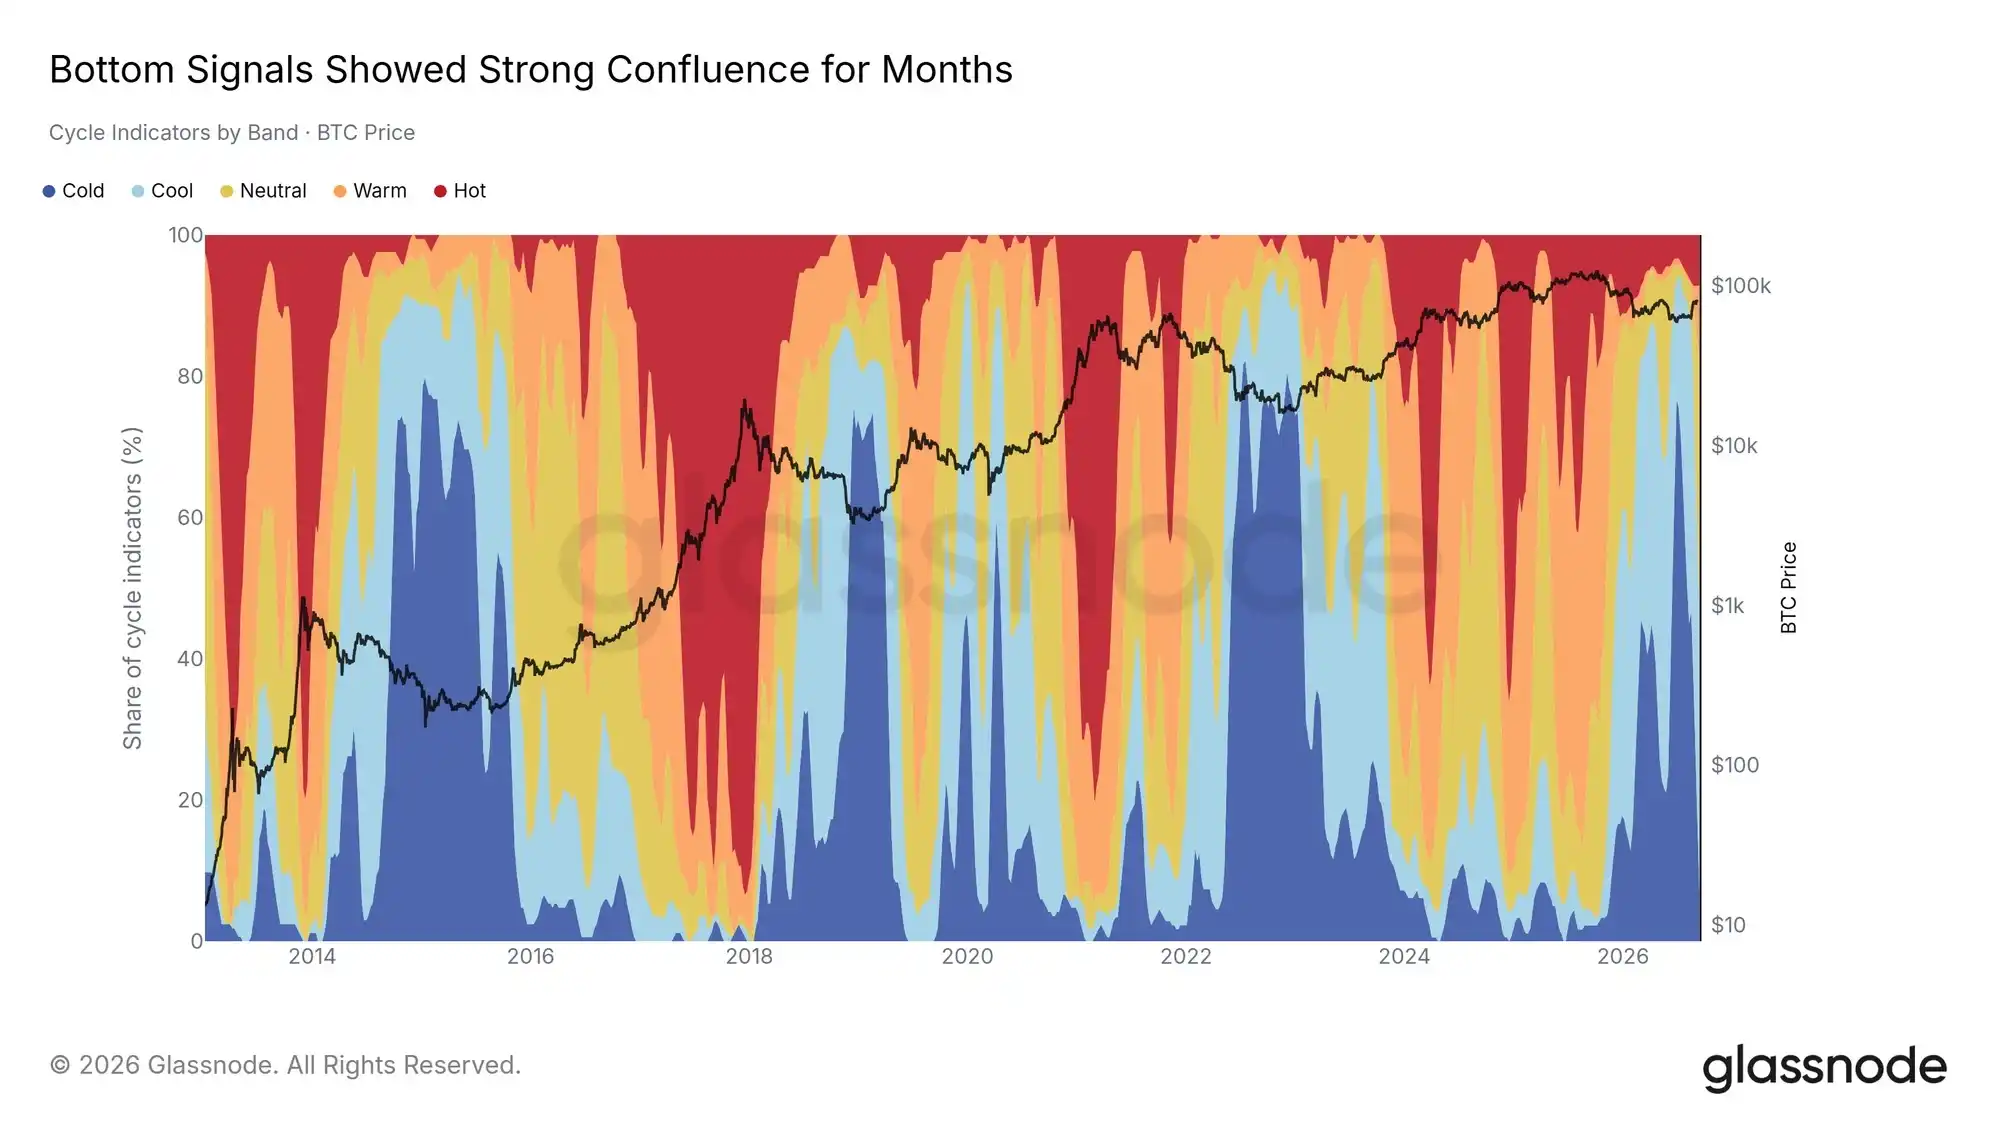
Among the 45 cycle indicators in the Market Compass panel, the share in the coldest zone peaked at 82% the week of June 29, 2026, and spent 41 consecutive weeks above its long-term median. This was the strongest resonance of bottom signals produced in this cycle. That signal has now faded: as the rally repaired valuations, the cold share dropped to 2% in the most recent complete week.

The panel has not swung to the other extreme. Three-quarters of indicators are still below the midpoint of their own history, and it has been 43 weeks since a majority were above 50. The interpretation: the market has left the value zone but is not yet expensive. A majority of indicators breaking above 50 would be the clearest confirmation the cycle position has shifted.
No Mass Rush into Altcoins

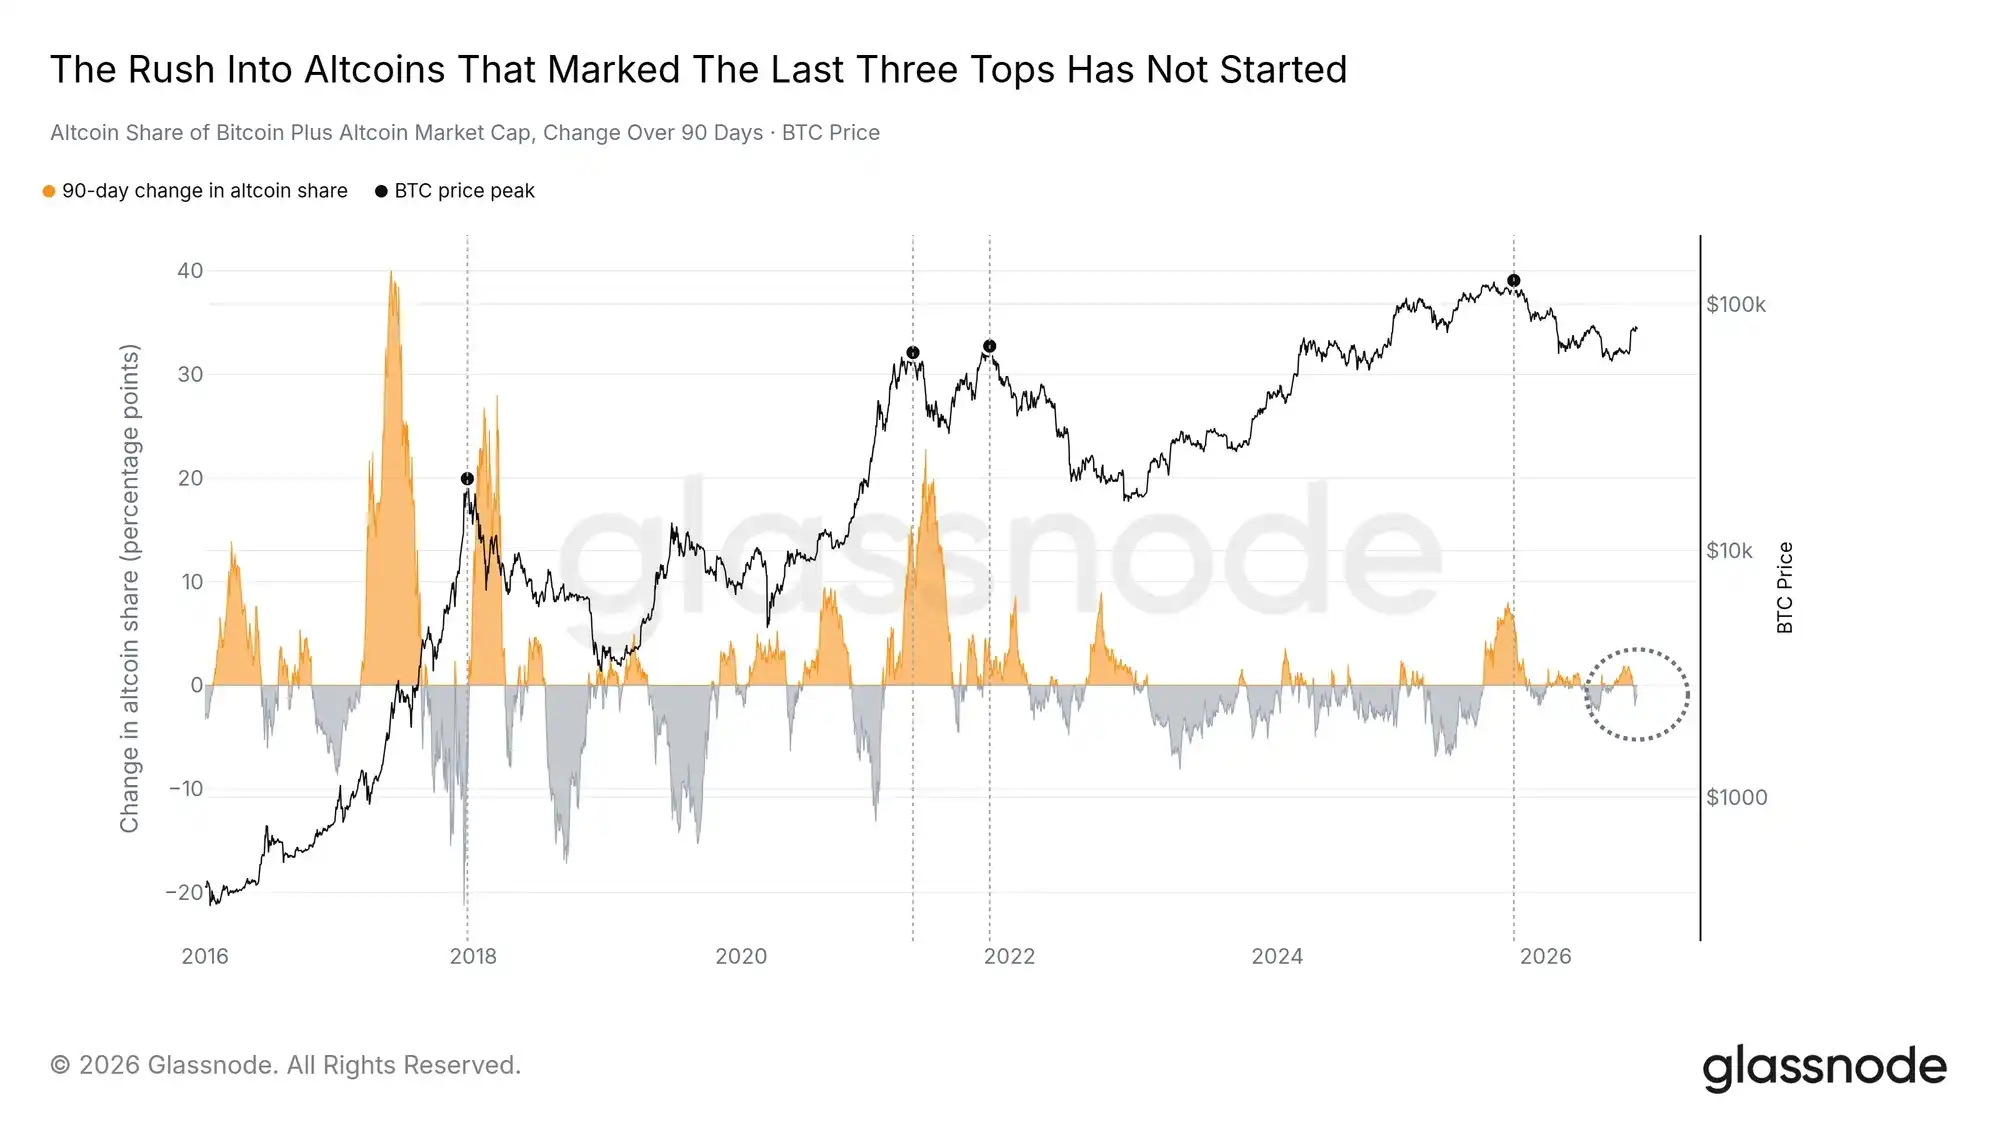
Many altcoins are rallying, with Altcoin Market Cap up 21% this month. This metric examines whether this move is oversized relative to the entire crypto market: whether altcoins are taking share from Bitcoin at the pace seen before previous tops. At four of the labeled Bitcoin price peaks, the share of altcoins in the combined Bitcoin + altcoin market cap surged in the 90 days before the peak, rising at least 2.8 percentage points; the December 2017 peak was the exception. Today, the 90-day change in Altcoin Share is negative, reading -0.9 percentage points.

Altcoins are rising in dollar terms but not outperforming Bitcoin; the entire ladder is moving as a block, with the largest-cap coins leading. The massive rotation signaling a mature top—capital cascading down the risk curve faster than Bitcoin's own market cap grows—has not yet begun. If the altcoin share rises 2.8 percentage points or more over 90 days while Bitcoin is near its all-time highs, it would be a warning based on precedent; today, neither condition is met.
Conclusion

Bitcoin is consolidating below a ceiling that three independent sources agree on: the Long-Term Holder cost basis, the liquidation map, and the ETF breakeven point, all between $83,000 and $86,000. The current state is a range with a repaired floor and an untested ceiling. The difference from the August attempt is the absence of sellers: sell-side pressure is less than half of August's, long-term holders are stepping back, and overhead derivatives fuel is thickening. A sustained close above $86,000 with a still-subdued Sell-Side Risk Ratio would confirm the ceiling is being absorbed; a return of selling with the metric breaking above 16 bps, or a break below the $62,000 to $65,000 floor, would invalidate this.

On-chain metrics, price, and derivatives data as of September 7, 2026; ETF flows as of September 4, 2026; Market Compass panel as of the week ending September 7, 2026; recent daily data points may still be revised.

Disclaimer: This report does not provide any investment advice. All data is for informational and educational purposes only. No investment decision should be made based on the information provided herein, and you are solely responsible for your own investment decisions.

The exchange balances presented are derived from Glassnode's comprehensive address labeling database, which aggregates information from official exchange disclosures and proprietary clustering algorithms. While we strive to present exchange balances as accurately as possible, please note that these figures may not always encompass the full extent of exchange reserves, particularly when exchanges do not disclose their official addresses. We urge users to exercise caution and judgment when using these metrics. Glassnode assumes no responsibility for any discrepancies or potential inaccuracies.


Related Questions

QAccording to the article, what are the three independent sources that identify the ceiling price range for Bitcoin, and what is that range?

AThe three independent sources are the Long-Term Holder Cost Basis, the BTC Futures Liquidation Heatmap, and the US spot ETF breakeven point. They all identify a ceiling price range for Bitcoin between $83,000 and $86,000.

QHow does the current selling pressure in September compare to the selling pressure observed in August?

AThe current selling pressure, as measured by the Sell-Side Risk Ratio on a seven-day basis, is less than half of what it was in August. In August, it peaked at 16 basis points, while in September it has dropped to 7 basis points.

QWhat are the key data points to watch to confirm a breakout above the identified ceiling or a breakdown below the support?

AA sustained close above $86,000 with the Sell-Side Risk Ratio remaining low would confirm the ceiling is broken. A break below the $62,000 to $65,000 support base or a return of the Sell-Side Risk Ratio above 16 basis points would falsify the breakout thesis.

QWhat is the current status of altcoin dominance according to the Market Compass panel?

AAccording to the article, the Altcoin Share of total crypto market capitalization has a 90-day change of -0.9 percentage points. While altcoin market cap is rising in dollar terms, it is not outperforming Bitcoin and the 'Altcoin Share' is not increasing significantly as it has before previous major Bitcoin tops.

QWhat discrepancy between inflation data and market expectations does the article highlight, and why is it significant?

AThe article highlights that US core inflation has fallen to a two-year low of 2.5%, while US inflation expectations are at 3.6%. This three-year high gap between expectations and actual data makes it difficult to justify further rate hikes, as bond market yields are at cycle highs while inflation data is cooling.

Related Reads

230k-follower “Crypto God” exposed: 30 sock puppet accounts caught harvesting fans

Cupsey, a Solana meme coin trader with over 230,000 X followers, has been exposed by on-chain analytics firm Bubblemaps for allegedly running roughly 30 secret wallets to profit off his own followers. Since May 7, these linked addresses traded over 27,000 tokens and cashed out about $1.74 million on roughly 3,000 tokens using a repeated three-step scheme: four core wallets quietly accumulate a new token and spread holdings across 12 associated wallets; Cupsey's public wallet then buys the same token and he promotes it to followers; finally, the hidden wallets sell into the incoming buy orders. In some cases the secret wallets dumped tokens while Cupsey was still drafting his recommendation posts. Because new meme coins have thin liquidity, followers' buys push prices up briefly, letting the insider wallets exit while late buyers absorb the losses. The report also links Cupsey-associated wallets to a token-issuing address starting with "3z4vj," which launched over 400 tokens and earned an estimated $1.3 million. Beyond trading spreads, Cupsey reportedly received about $331,000 in Pump.fun promotion rewards. Bubblemaps has similarly exposed other top traders such as Anglio, 0xEthan, and Solstice for front-running their own recommendations, in some cases buying about 20 seconds before posting. The firm criticizes platforms for rewarding trading volume with millions in incentives while doing little to detect bundled holdings, insider wallets, or repeat offenders, turning followers into exit liquidity. Cupsey has not yet responded to the allegations.

marsbit1h ago

230k-follower “Crypto God” exposed: 30 sock puppet accounts caught harvesting fans

marsbit1h ago

Ex-employee sues Ethereum Foundation and Vitalik Buterin over firing

A former Ethereum Foundation employee, Kayleen Fulton (known as “Nixo”), has sued the organization, co-founder Vitalik Buterin, and four others, alleging she was fired after disclosing a cancer diagnosis and organizing a staff letter challenging a directive tied to the foundation’s new mandate. Fulton, who led the protocol support team, filed the complaint on Nov. 4 in the U.S. District Court for the District of Colorado. She claims Bastian Aue, then a co-executive director, fired her on April 6, 13 days after her diagnosis disclosure, and that Buterin helped adopt and enforce the directive as a board member. Fulton and colleague Trent Van Epps organized a letter with 53 signers supporting the mandate’s goals but objecting to a requirement that employees affirm it to keep their jobs; she alleges she and Van Epps were fired 30 minutes apart days later. She alleges disability discrimination, retaliation, and interference with medical leave rights, seeking lost pay and damages. The complaint also notes some employees objected to a reference to ritual suicide in the mandate, quoting Aue saying the language was figurative. A lawyer for the foundation’s Singapore affiliate denied unlawful conduct or retaliation and said her separation agreement was binding. The foundation published its mandate in March, highlighting censorship resistance, open-source code, privacy and security, and a focus on protocol upgrades, research, and developer tools.

cointelegraph1h ago

Ex-employee sues Ethereum Foundation and Vitalik Buterin over firing

cointelegraph1h ago

Major Analog Chip Acquisition: The Account Behind Over 500 Part Numbers

On November 9, Awinic Electronics announced a trading halt to plan the acquisition of Yutai Semiconductor shares via share issuance and cash, plus supporting financing—a landmark integration in China's analog chip design sector. Both companies compete in analog chips but follow different product paths. Awinic's power management revenue reached 1.047 billion yuan in 2025 (about 37% of total), slightly down 0.03% year-on-year, deeply tied to consumer electronics like phones, AIoT, and wearables. Its real strength lies in high-performance mixed-signal chips (1.505 billion yuan, 53% of revenue), with audio power amplifiers as the core, now extending into edge AI audio for AI glasses, supplying Meta, Rokid, and RayNeo. However, consumer cyclicality and fierce 2026 price competition expose Awinic's limited coverage in industrial-grade medium/high-voltage power, telecom power, and smart meters. Yutai, founded by former Maxim designers with R&D centers in Shanghai, Silicon Valley, and Hanoi, offers over 500 product models covering DC-DC, AC-DC, LDO, battery management, and PMU. Its AC-DC line spans 5 categories and 130+ models, including PWM controllers, integrated GaN converters, synchronous rectification, and fast-charging protocols—targeting high-voltage, high-frequency, high-power-density applications like fast chargers, industrial power, and telecom equipment. Its DC-DC products, such as the ETA9121/9122 dual-phase buck converters and ETA5220 ultra-low-noise LDO (0.96μV RMS), are not commodity consumer parts. Yutai also partners with MediaTek, Intel, Spreadtrum, Rockchip, Ambarella, and NXP, covering smart meters, security, set-top boxes, and routers. The complementarity is clear: Awinic excels in low-voltage, consumer-grade, highly integrated power for phones and wearables; Yutai in medium/high-voltage, industrial-grade, full-category solutions. A merger could theoretically cover consumer to industrial communications, low to medium/high voltage, and single chips to system-level solutions. Yet product logic alone doesn't guarantee success: Saint-Gong holds 25.95% of Yutai as second-largest shareholder, potentially constraining R&D integration, customer sharing, and product roadmaps post-closing. The deal reflects China's analog chip industry moving from niche land-grabbing to platform-based consolidation. Awinic needs Yutai's industrial power lines and customer ecosystem to break consumer growth ceilings; Yutai needs Awinic's listing platform and consumer channels to offset capital and market shortcomings. But success won't be decided by synergy visions in announcements—it depends on whether the two R&D teams can work under one product definition framework after the halt ends, and how many of Yutai's 700+ part numbers truly enter Awinic's customer system and generate design wins. Products can be acquired; scenario capabilities must be digested.

marsbit2h ago

Major Analog Chip Acquisition: The Account Behind Over 500 Part Numbers

marsbit2h ago

15 Crypto Ideas That Were 'Ahead of Their Time'—Why They're Worth Rebuilding in the AI Era

Between 2014 and 2019, crypto projects like Kleros, Augur, Etherisc, and Golem tried to bring commercial arbitration, prediction markets, mutual insurance, and decentralized compute on-chain, but failed because judgment of real-world outcomes depended on slow, bribe-prone human voting, governance tokens were volatile, and settlement was expensive. After 2023, three bottlenecks broke at once: multi-model AI juries cut the cost of real-world judgment to cents, AI agents became high-frequency on-chain transactors, and stablecoins (~$310B) plus sub-second chains like Solana made micro-settlement viable. The article ranks 15 ideas worth rebuilding by revenue potential and readiness: e-commerce arbitration courts, real-world prediction market oracles for questions lacking APIs, automatic-payout insurance without claims adjusters, escrowed task labor markets, data and media licensing, machine micropayments (x402), reputation-and-bond lending, proof of personhood, constitution-enforced DAOs, curated registries, content provenance, supply chain tracking, legally binding tokenized assets, compute and infrastructure markets, and IP with real legal contracts. Top candidates combine billion-dollar markets with components buildable in a quarter using existing AI models, stablecoins, and Solana. The article also provides a general validation prompt plus per-idea prompts, and warns of four risks: AI juries may share blind spots and err collectively, evidence can be forged, regulated sectors still require licenses, and real paid demand for micropayments and DePIN remains thin.

marsbit2h ago

15 Crypto Ideas That Were 'Ahead of Their Time'—Why They're Worth Rebuilding in the AI Era

marsbit2h ago

Trading

Spot
活动图片