Text | Jinduan
On September 14th, BLT (688333.SH) closed up 10.99% at 117.7 yuan, with a total market cap of 32.288 billion yuan. On the same day, Farsoon (688433.SH) closed at 91 yuan, up 2.09%, with a total market cap of 37.818 billion yuan.
Interim reports show that the former earned 51.13 million in the first half of the year, while the latter earned 8.43 million. The company with only one-sixth the profit of the other has a market cap that is instead 5.5 billion yuan higher.
And this is already the result after a narrowing. Nine trading days earlier on September 2nd, Farsoon's market cap had once surged to 46.9 billion, leading BLT by over 15 billion; subsequently, Farsoon pulled back 18% from its high, while BLT has rebounded more than 50% from its late-July low, compressing the gap all the way to 5.5 billion.
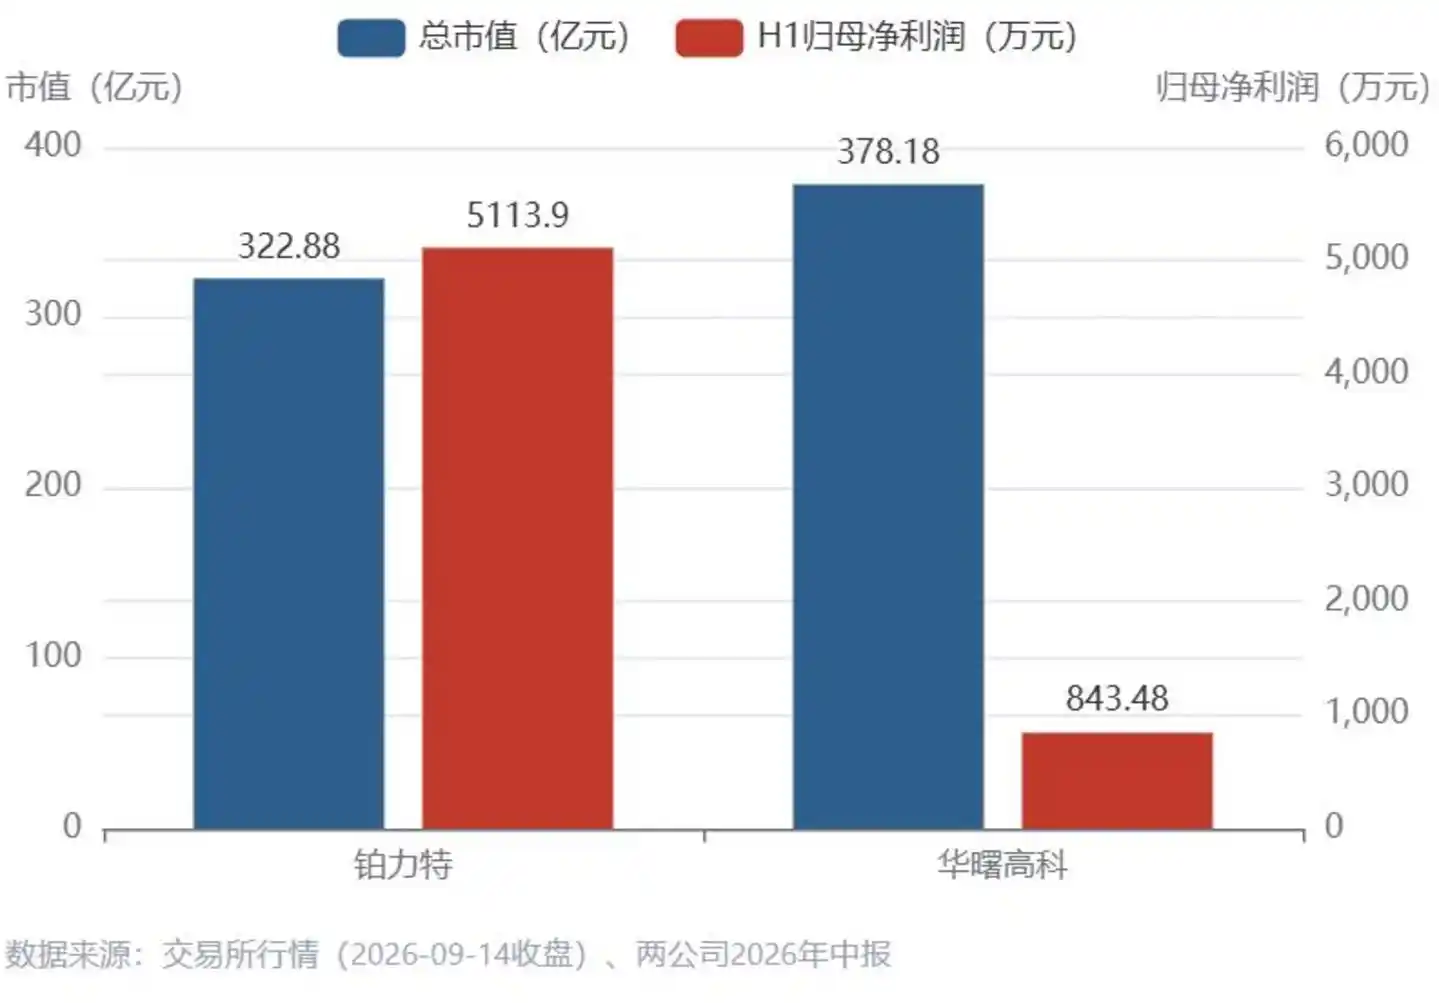
Figure: BLT vs Farsoon, Profit and Market Cap Inversion
This is not a failure of the valuation model, but rather the most realistic portrayal of the 3D printing industry at present: industrial hype is scorching hot, profit statements are chillingly cold, and stock prices swing violently between the two. BLT and Farsoon, this pair of metal 3D printing "titans", are using two distinctly different curves to compete for a title:
China's 3D Printing Top Stock.
Export Frenzy and Profit Winter
First, let's look at the overall industry.
Customs data shows that in the first half of 2026, China exported a cumulative 3.62 million 3D printers, with an export value of 9.611 billion yuan, a year-on-year increase of 109.3%. On July 28th, the Ministry of Commerce, during a State Council Information Office press conference, listed 3D printers alongside industrial robots (export value up 18.6% YoY) as "new name cards" for AI-related product exports — 9 out of every 10 consumer-grade 3D printers sold globally are from China.
The industrial-grade story is even more substantial. According to CCTV Finance, the export value of industrial-grade metal 3D printing equipment grew 76% year-on-year in the first half, with Europe and Southeast Asia contributing 87% of the total export value; equipment manufacturers like XDM (Suzhou XDM) saw orders increase approximately threefold year-on-year, with schedules booked through the end of the year; for some equipment manufacturers, the proportion of overseas orders in their backlog exceeded domestic orders for the first time, approaching 60%. Domestic industrial equipment delivery cycles are about 1 month, compared to at least 3 months for overseas counterparts.
But there's a detail hidden in the export data that must be unpacked: out of the total 3.62 million units exported, desktop-grade plastic devices accounted for 99.99%, supporting 94.7% of the 9.6 billion yuan value; the real high-end equipment exports, industrial-grade metal devices, numbered 760 units worth 325 million yuan.
The mainstay of the export frenzy is the consumer-grade business of Bambu Lab, Creality, etc. Industrial-grade is the fastest-growing increment, but it's not yet the main course.
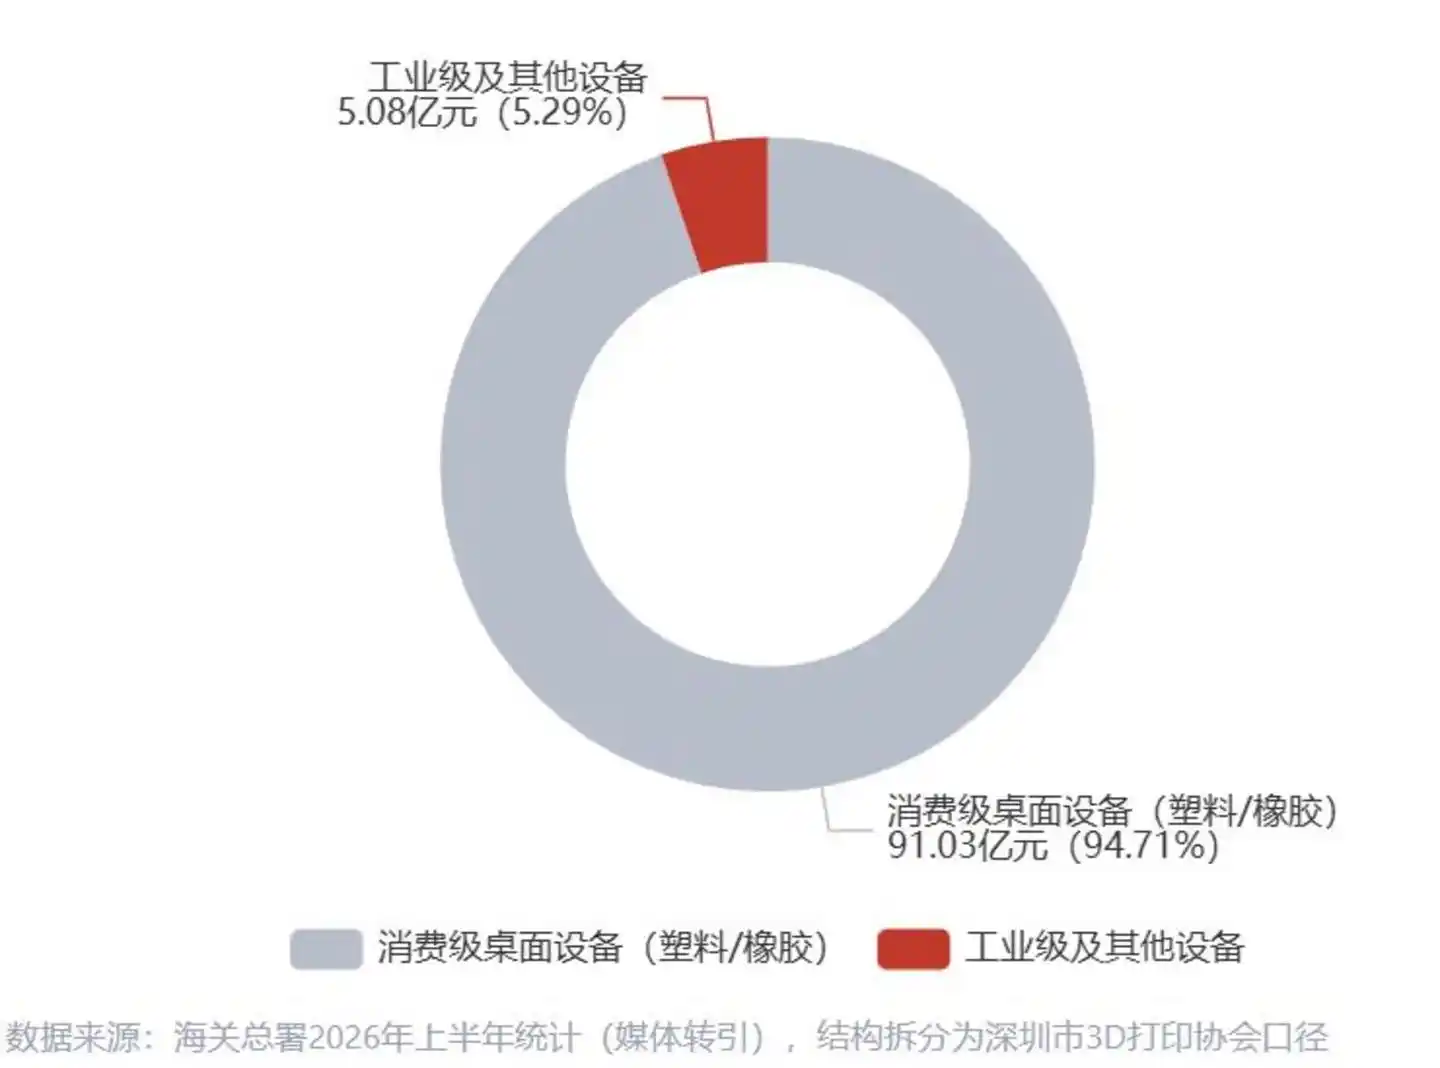
Figure: Industrial-grade only accounts for 5% of the 9.6 billion yuan export value
The production side is equally hot. Under the NBS (National Bureau of Statistics) caliber, 3D printing equipment output grew 48.5% year-on-year in the first half. CRI (China Research Institute) estimates that China's 3D printing market size in 2025 is about 70 billion yuan, up about 30% year-on-year, and is expected to reach 86.2 billion yuan in 2026. According to Wohlers Report 2026, the global additive manufacturing market revenue in 2025 was $24.2 billion, with a growth rate of 10.9%, of which system sales grew only 3.6%. The growth rate of the Chinese market is more than double that of the global market.
However, the warmth of the overall industry is discounted on the profit statements. We have compiled statistics for 24 companies in the 3D printing sector with the highest business relevance: the median revenue growth in the first half was +15.2%, while on the profit side, 9 companies saw declines or losses.
This is not an industry where everyone is taking off.
The Titans' Mirror Moment
The interim reports of BLT and Farsoon contain an extremely informative "scissors gap".
Farsoon reported revenue of 341 million yuan in the first half, up 42.27% year-on-year; net profit attributable to shareholders of 8.4348 million yuan, up 87.09% year-on-year; non-GAAP net profit of 3.6645 million yuan, up 115.78% year-on-year. The real breakout was in Q2: Q2 single-quarter revenue was 211 million yuan, with growth surging to 86.1%, compared to only 2.84% in Q1. The driver came from equipment and exports: Equipment revenue was 271 million yuan, up 52% year-on-year, accounting for 79.6% of total revenue — this is a pure "shovel seller"; Export revenue was 77.94 million yuan, up 74% year-on-year, accounting for 22.9%.
BLT is precisely the mirror image. Its first-half revenue was 770 million yuan, up 15.46% year-on-year; net profit attributable to shareholders was 51.139 million yuan, down 32.99% year-on-year; non-GAAP net profit was only 16.1661 million yuan, down 62.72% year-on-year. Q1 revenue growth was still 43.57%, but Q2 single-quarter growth dropped to a mere 0.95%. Even more glaring is the profit quality: out of the 51.13 million yuan net profit attributable to shareholders, non-recurring gains and losses totaled 34.97 million yuan, including 29.48 million yuan in government subsidies. This means about 68% of the profit was unrelated to its core business.
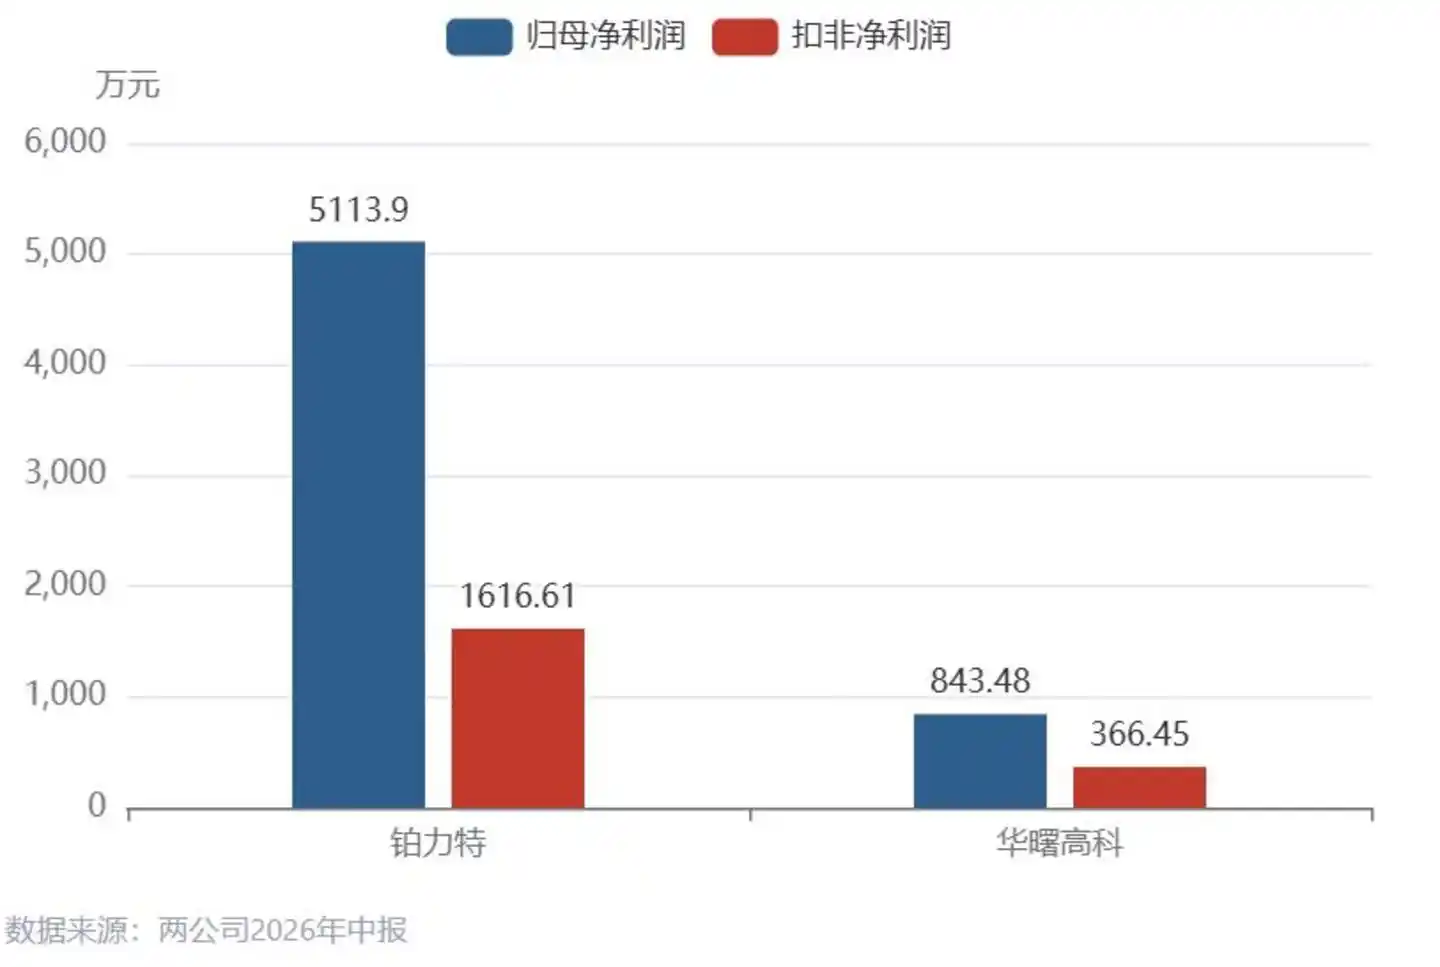
Profit Quality: Net Profit Attributable vs Non-GAAP (10k yuan)
As leaders in metal 3D printing, why is one accelerating while the other decelerating?
The answer lies in the customer structure.
Farsoon is riding the "export + consumer electronics" chain, where order rhythm is determined by overseas equipment procurement, resulting in high elasticity and fast transmission. BLT's mainstay is the "aerospace and defense" chain: in the first half, aerospace revenue was 429 million yuan, up 43.03% year-on-year, accounting for 55.75%, while industrial sector revenue actually declined by 9.76%. Orders from defense and aerospace customers operate like an old-fashioned train, departing on schedule, not according to market sentiment.
A more telling comparison: In the same first half, Farsoon's export revenue grew +74%, while BLT's overseas revenue was 37.5 million yuan, down 46.42% year-on-year. The same industry, two leaders: one accelerating overseas expansion, the other retreating.
The story on the profit side is even more cautionary. BLT's H1 gross margin was 39.04%, down 3.14 percentage points year-on-year; financial expenses were 20.33 million yuan, up 580.6% year-on-year, with both exchange losses and interest expenses rising, coupled with bad debt losses, squeezing the profit statement from multiple angles; operating cash flow was -174 million yuan (-302 million yuan in the same period last year); accounts receivable were 1.352 billion yuan, inventory was 1.635 billion yuan, together accounting for over one-third of total assets. Farsoon's operating cash flow was also negative at -79 million yuan, an outflow increase of 55.09 million yuan year-on-year, primarily due to inventory buildup for capacity expansion.
Thus, the entire industry chain is engaged in "inventory buildup for capacity expansion + receivables expansion." The growth on the profit statement has not yet turned into cash in the pocket.
03 The Math Problem of 518x and 181x
The story of market cap overtaking requires doing the math.
Farsoon has a market cap of 37.8 billion yuan, full-year 2025 revenue of 715 million yuan, resulting in a static P/S ratio of about 53x; its TTM PE is about 518x. Using the non-GAAP figure, TTM non-GAAP profit is about 59 million yuan, corresponding to about 637x. BLT has a market cap of 32.3 billion yuan, 2025 revenue of 1.852 billion yuan, resulting in a P/S ratio of about 17x; its TTM PE is about 181x, and about 264x on a non-GAAP basis.
Farsoon's valuation is built on the assumption that "every link must go right." Assuming the market in 2030 is willing to give a high-end equipment company a P/S ratio of 10x, Farsoon's revenue by then would need to reach about 3.8 billion yuan — starting from 715 million in 2025, requiring a five-year compound annual growth rate (CAGR) of about 40%. Apple orders need to materialize, high export growth needs to continue, the 3.91 billion yuan private placement for capacity needs to be smoothly absorbed, and the service business needs to scale as planned — four things that must all go right.
BLT's math problem points in another direction. This company is not without ambitious dreams: The 2020 restricted stock incentive plan set a target of 30% CAGR in revenue from the 2019 base. In hindsight, this "growth shackle" is widely seen by the market as a deep-seated incentive for its later aggressive revenue recognition, culminating in accounting error corrections and a CSRC investigation. Now, a market cap of 32.3 billion yuan corresponding to a TTM PE of 181x indicates the market is still pricing not current profits, but the long-term narrative of "commercial aerospace scaling + full industry chain." According to brokerage research, BLT holds over 40% market share in the commercial aerospace metal 3D printing sector, ranking second globally behind Germany's EOS. This is both a foundation and a burden: the heavier the position, the more one cannot afford to lose the rhythm.
The valuation rift within the sector is starkly glaring: on one end, Farsoon at 518x; on the other end, niche players in biological 3D printing like Chunli Medical at 18.75x and Medprin at 28.37x (all TTM PE as of September 14th close). There is almost no transitional zone in between. The market, in an almost black-and-white manner, has placed "story-driven companies" and "earnings-driven companies" into two separate rooms.
04 Four Fronts in the Battle for Supremacy
The competition between BLT and Farsoon is not simply a zero-sum game. The divergence of the two paths is unfolding simultaneously across four fronts.
The first front: customer structure. Farsoon relies on overseas equipment orders and scaling in the consumer electronics chain, offering high elasticity but also high volatility; BLT is tied to aerospace and defense customers, offering high certainty but a rhythm not under its control. The former bets on the "penetration rate story," the latter on the "mass production cycle."
The second front: profit quality. BLT's non-GAAP net profit fell 62.72%, but its operating cash flow improved from -302 million yuan to -174 million yuan, with Q2 gross margin at 40.34%, up 3.08 percentage points quarter-over-quarter, showing marginal improvement. Farsoon's net profit of 8.43 million yuan becomes only 3.6645 million yuan non-GAAP; even after excluding share-based payments, it's only 44.59 million yuan — the absolute profit volume is too small to withstand any disturbance in order recognition rhythm; while R&D expenses were 69.4 million yuan, accounting for 20.4% of revenue, essentially trading current profits for long-term chips.
The third front: valuation logic. Farsoon's bubble valuation is the market's forward pricing of the "Apple chain + export chain"; BLT's super-high valuation is the market's existing pricing of the "defense industry leader + full industry chain." The former needs continuous new stories to sustain it; the latter needs rhythmic performance recovery to prove it. Additionally, BLT has an off-balance-sheet liability that Farsoon doesn't: it was placed under investigation by the CSRC on December 31, 2025, for suspected information disclosure violations, with the investigation still ongoing; in July, it also received a warning letter from the Shaanxi Securities Regulatory Bureau for exceeding approved limits in cash management of raised funds. A governance discount is the hidden mine its valuation cannot bypass.
The fourth front: capacity layout. BLT announced at the end of April to increase the total investment for its "Large-scale Intelligent Production Base for Metal Additive Manufacturing" from 2.449 billion yuan to 3.105 billion yuan. In August, the 1 billion yuan powder base in Xixian New Area began trial production, planning an annual output of 3000-4000 tons. Farsoon's 3.91 billion yuan private placement is in progress, targeting equipment capacity expansion, printing service platforms, and a global operation center. Both production lines are betting on the same future: demand will continue to swell. But the timing difference in capacity coming online will determine who gets the next wave of orders first.
Apple is a variable that cannot be ignored. Apple has officially confirmed that the Apple Watch Ultra 3 and titanium models of the Series 11 use 3D printed titanium for their cases: 50-micron recycled titanium powder, six lasers working simultaneously, about 20 hours of printing per case, using half the material compared to traditional subtractive manufacturing, saving over 400 tons of titanium raw material in 2025 alone. John Ternus, with a background in hardware engineering, took over as Apple CEO on September 1st, and his appointment document even listed the 3D printing process for the Ultra 3 as one of his representative contributions.
However, a cold dose of reality is necessary: Apple has never disclosed the list of equipment suppliers. The notion that "domestic equipment has entered the Apple supply chain" remains at the level of market speculation, with both BLT and Farsoon mentioned, but none confirmed.
05 The First to Enter Xianyang Rules
At its core, the battle for supremacy between BLT and Farsoon is a microcosm of an industry oscillating between "narrative pricing" and "earnings pricing."
BLT has a stronger foundation: leading position in commercial aerospace, full industry chain layout, and the world's second-largest market share. But its profit curve is constrained by customer rhythm, making it difficult to match the market's optimistic expectations in the short term, and it also has the Damoclean sword of an ongoing investigation hanging over its head.
Farsoon has greater elasticity: explosive growth in the export chain, potential penetration in the consumer electronics chain, and a lighter asset structure (asset-liability ratio 26%, interest-bearing debt less than 10 million yuan). But its profit base is too small; a PE of 518x requires proving itself with data every single quarter.
The endgame of this battle will depend on who first turns "story" into "orders," and then "orders" into "profits."
In the next two quarters, the following signals need to be closely watched: BLT's Q3: whether the trend of Q2 gross margin recovering to 40.34% quarter-over-quarter can continue; whether revenue is a rhythmic catch-up or a demand-driven slowdown; and when the investigation will conclude. Farsoon's orders: the +74% export growth rate cannot continue indefinitely; whether Apple chain orders can transition from "expectation" to "contract."
Every wave of hard-tech sentiment eventually has to answer the same question: when will the story turn into a profit statement. BLT and Farsoon are providing their respective answers, each at their own pace. The money has arrived first; the profits are still on the way.
The first to enter Xianyang rules. The winner of this battle for supremacy belongs to the one who lets the profits catch up with the story first.