The current bull market shows several structural similarities to the 2015–2018 cycle. We explore this idea from the perspective of the drawdown profile, price performance, and changes in the Realized Cap. We also address misconceptions about exchange balances, helping to frame up how many coins are in the custody of these large entities.
Executive Summary
- Cyclical Market Growth: The rate of Bitcoin price appreciation has declined cycle by cycle, reflecting a path into market maturity. The drawdown profile of this cycle thus far closely resembles that of the 2015–2017 cycle. Prior cycles also hint at a potential acceleration phase in the bull market, which tends to occur around this time (relative to the cycle low).
- Realized Cap Expansion: The Realized Cap has grown by 2.1x in this cycle so far, below the 5.7x peak of the last cycle and aligns with the 2015–2018 cycle at this stage. The euphoria phase has yet to fully impact Realized Cap, indicating potential room for further market expansion.
- Exchange Balances vs. ETF Wallets: We assess that the recent drop in exchange balances to 2.7M BTC is primarily due to supply migrating into ETF wallets, many of which are managed by custodians like Coinbase. Combined exchange and ETF balances have remained stable at around 3M BTC, reflecting a shift in market structure rather than a supply shock.
- Capital Rotation Insights: Bull markets are characterized by long-term holders distributing coins to new investors. Recent capital rotation trends have seen the Bitcoin uptrend holding $100k, underscoring the key role that new buyers have in supporting price momentum.
Bitcoin's Cyclical Evolution
To begin our analysis, we set the stage by comparing the price performance and drawdown profile across Bitcoin’s last four market cycles. This helps to contextualize the prevailing bull run within historical trends.
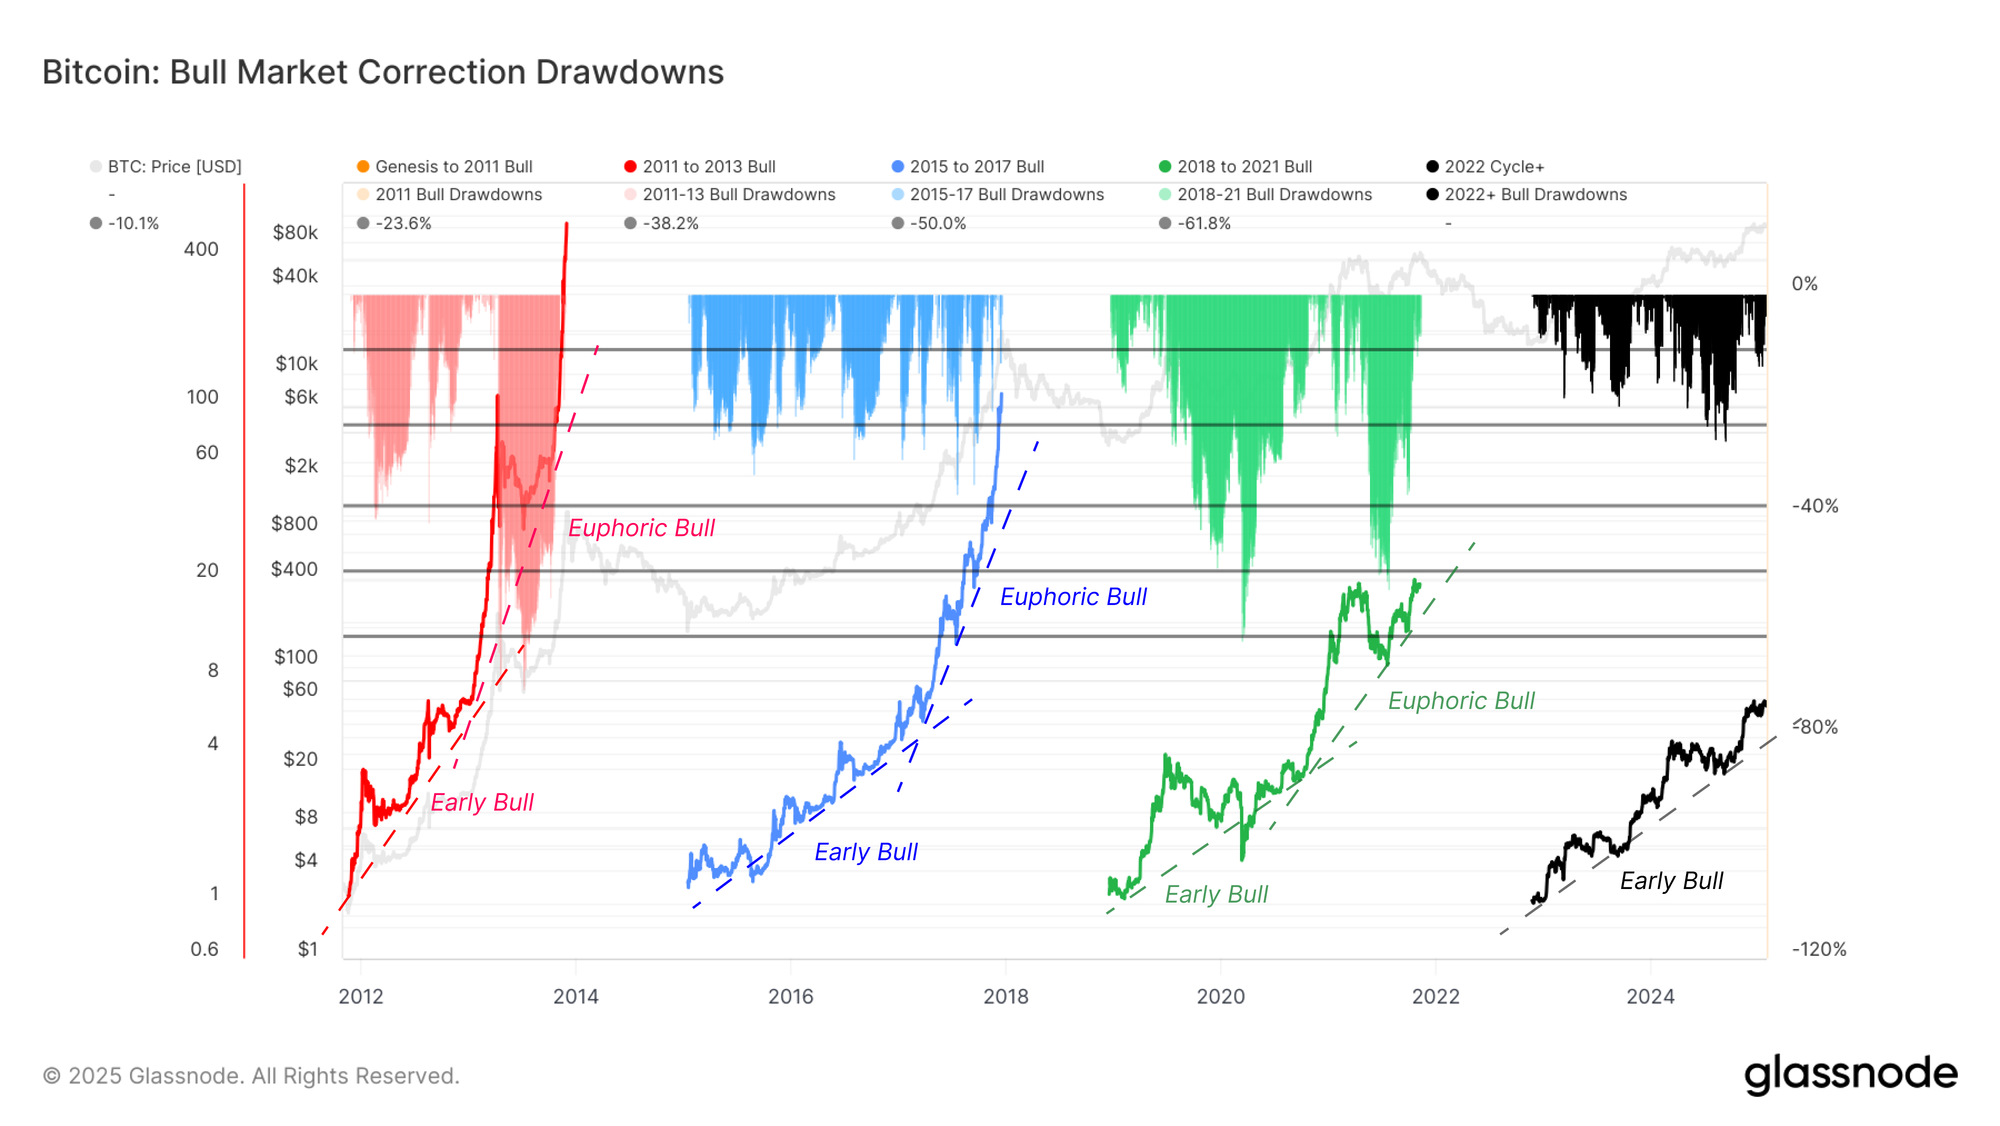
The chart below showcases Bitcoin's price performance index relative to the cycle low, and the following chart looks at the drawdown profile during bull markets. Via an assessment of these two charts, a few key trends emerge:
- Declining Cyclical Growth: The rate of price appreciation (gradients) has diminished with each cycle, reflecting the ongoing market maturity and the increasing capital required to grow a multi-billion to multi-trillion dollar asset valuation.
- Drawdown Size: Drawdowns in the current cycle typically range between the 10.1% and 23.6% Fibonacci levels and closely resemble the 2015–2017 cycle.
- Bull Market Phases: Bull runs typically feature an initial slow-growth phase (early bull), which is eventually followed by a period of rapid price expansion (the euphoric bull).
The current position of the 2023-25 cycle relative to the low set in late 2022 aligns with a possible transition into the second euphoric phase. Both prior cycles have seen a marked acceleration in price performance around this time, driven by an influx of new attention and demand for the asset.
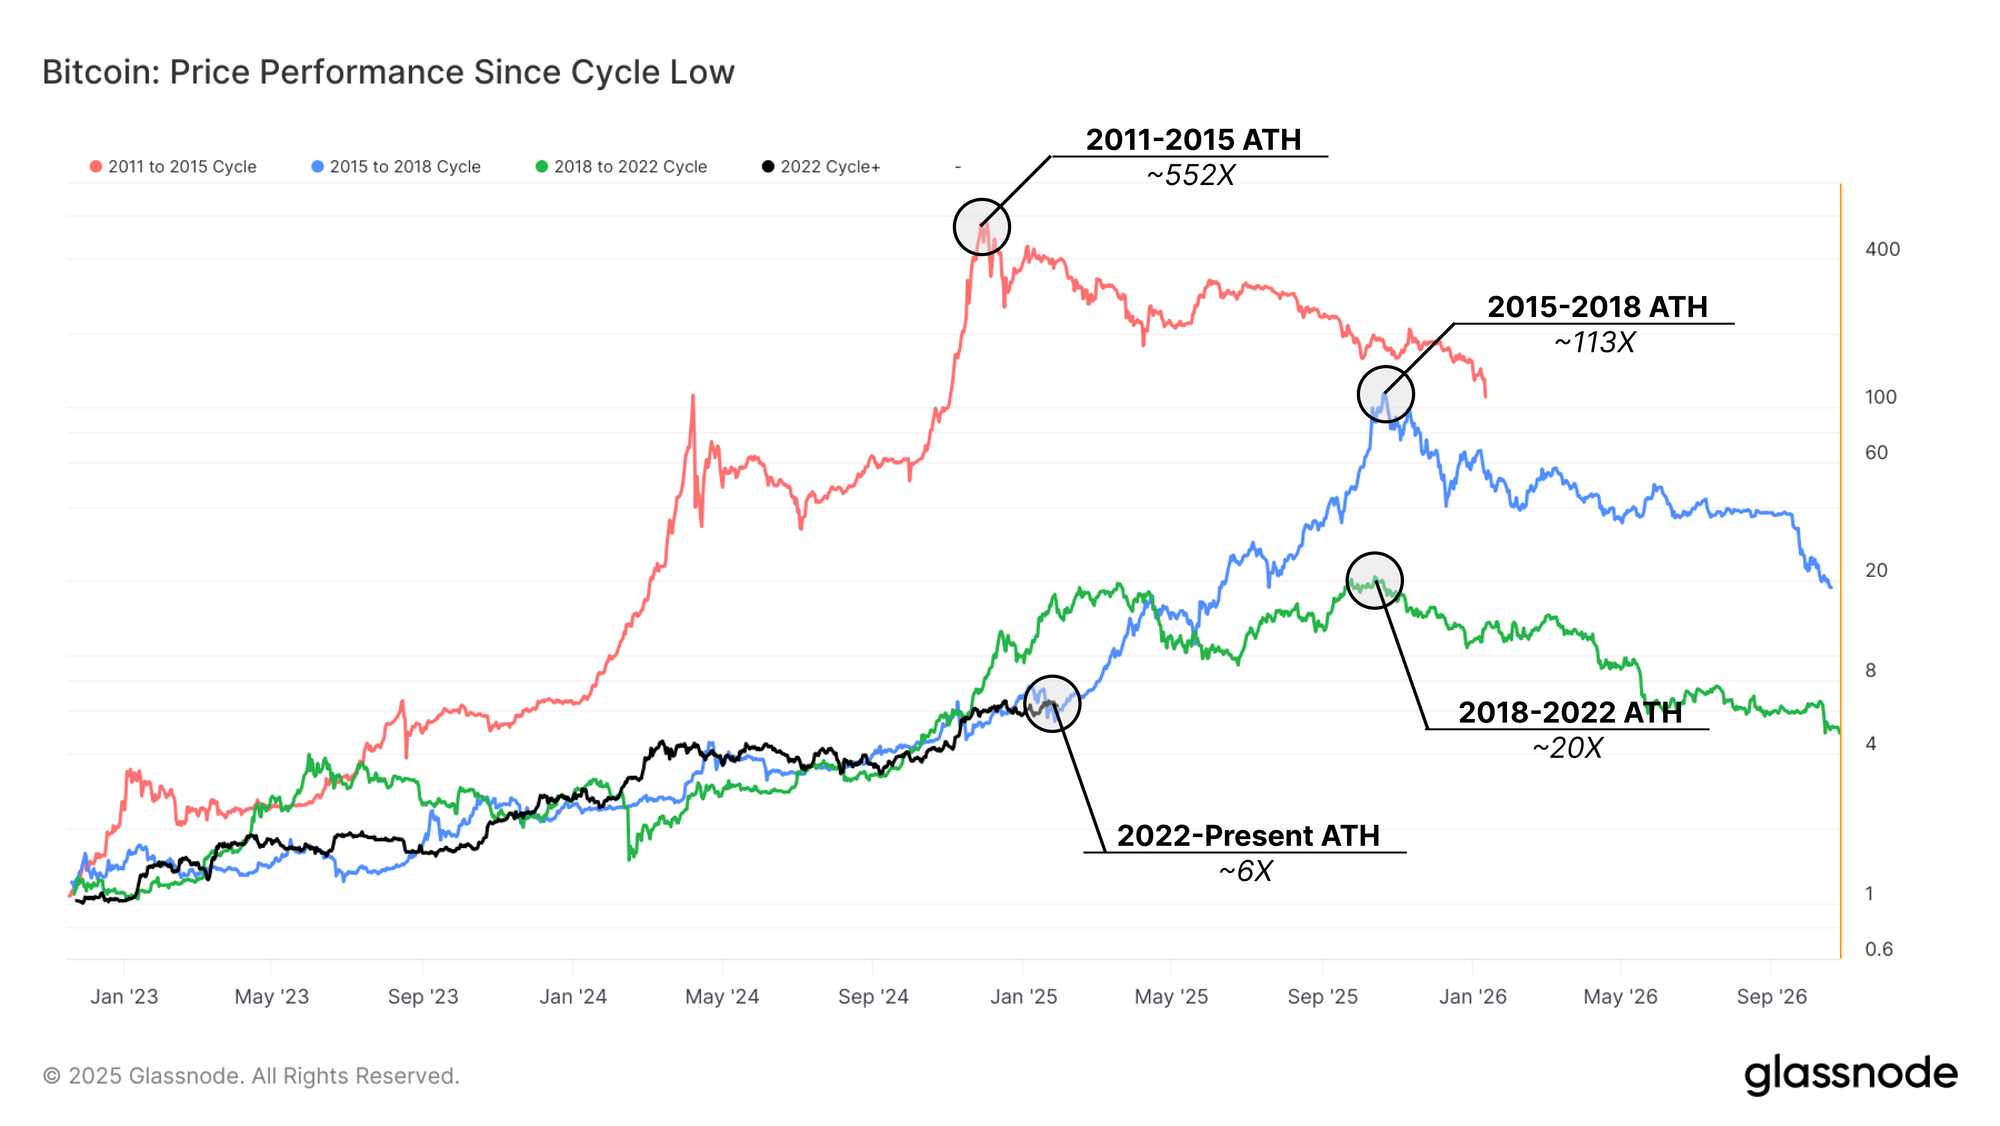
The current cycle mirrors trends seen in the 2015–2018 cycle, a primarily spot-driven market due to the lack of developed derivatives and stablecoin infrastructure. However, the overall performance of that cycle peaked at more than a 100x return from the low, which is arguably quite unlikely given the starting price of $15.6k this cycle.
Nevertheless, we can build on this analysis using the drawdown profile during uptrends. What stands out is how similar the pattern of pullbacks is since the low was set after FTX collapsed. Despite Bitcoin trading at a market cap which is orders of magnitude larger, the typical drawdown from the local high has rarely exceeded -25%.
This is a reflection of the impressive demand profile that has emerged for Bitcoin in recent years, in part due to the acceptance of it as a macro asset in finance and the role of spot ETFs as a source of new demand.
Realized Cap Growth as a Bull Market Driver
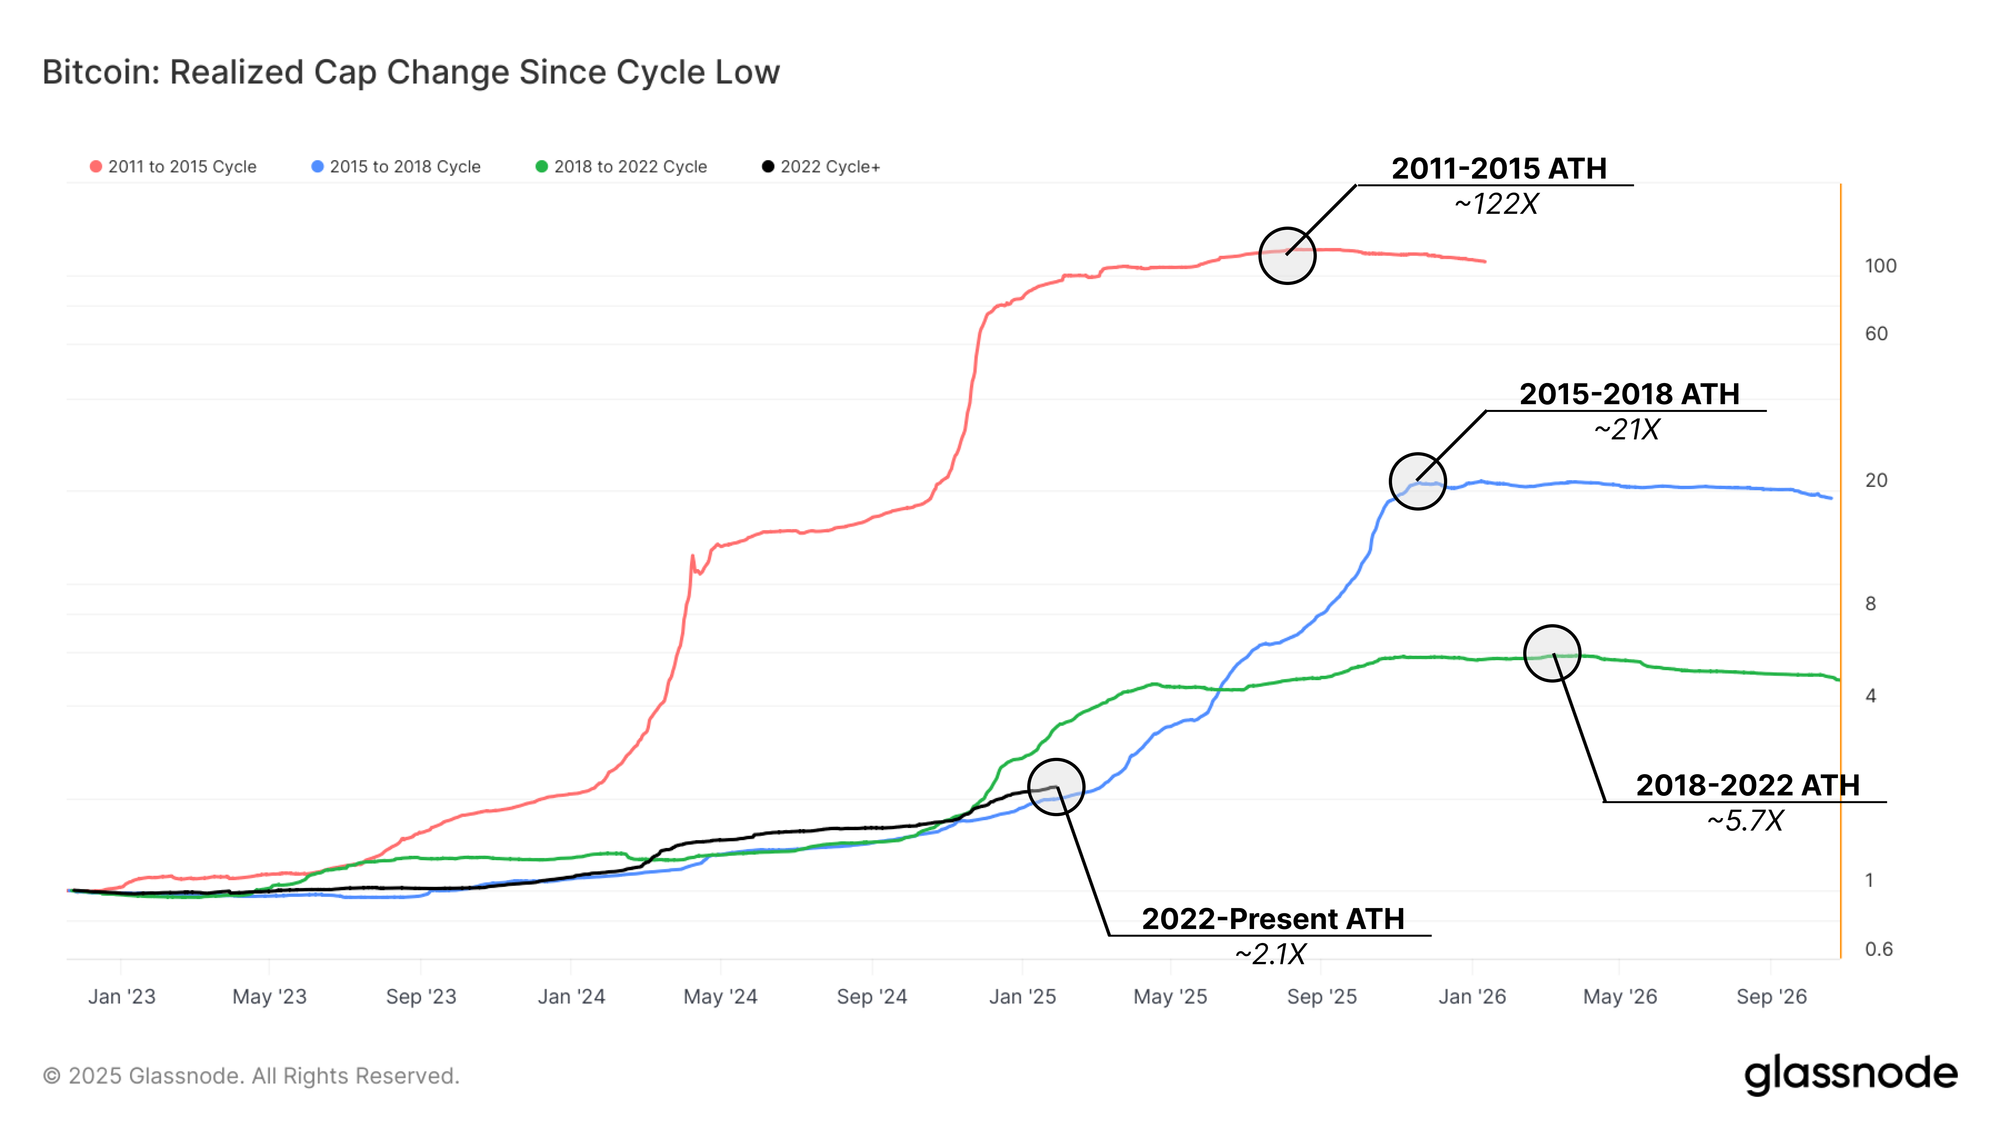
To delve deeper into the phases and drivers of bull markets, we can examine how the Realized Cap has changed since each cycle low. This tool helps visualize the rate of net capital inflow deployed into the market, offering insight into the demand forces fuelling Bitcoin's cyclical rallies.
During the 2011–2015 cycle, the Realized Cap grew by an astounding ~122x, a product of Bitcoin’s early exponential adoption. However, as the market matured, growth ratios declined with each subsequent cycle, speaking to Bitcoin’s transition into a capital-intensive and structurally mature market.
In the current cycle, Realized Cap has grown 2.1x so far—well below the 5.7x peak of the previous cycle, but again showing similarities to the 2015–2018 cycle. We can also see the clear change in the gradient as each cycle enters the euphoria phase of the bull market, where the Realized Cap inflects sharply higher (in log space).
By this metric, the market has not yet fully entered this stage of exponential Realized Cap growth, which suggests there may be room for potential expansion should demand accelerate from here. This idea is likely balanced by the considerably larger size of Bitcoin today, requiring much more capital to follow a similar path.
Rotation of Capital: Long-Term to Short-Term Holders
The underlying driver of the Realized Cap climbing higher is profit-taking by Long-Term investors. We introduce a framework to track the capital rotation from these long-term investors to new buyers, providing a clearer view of supply dynamics during bull markets.
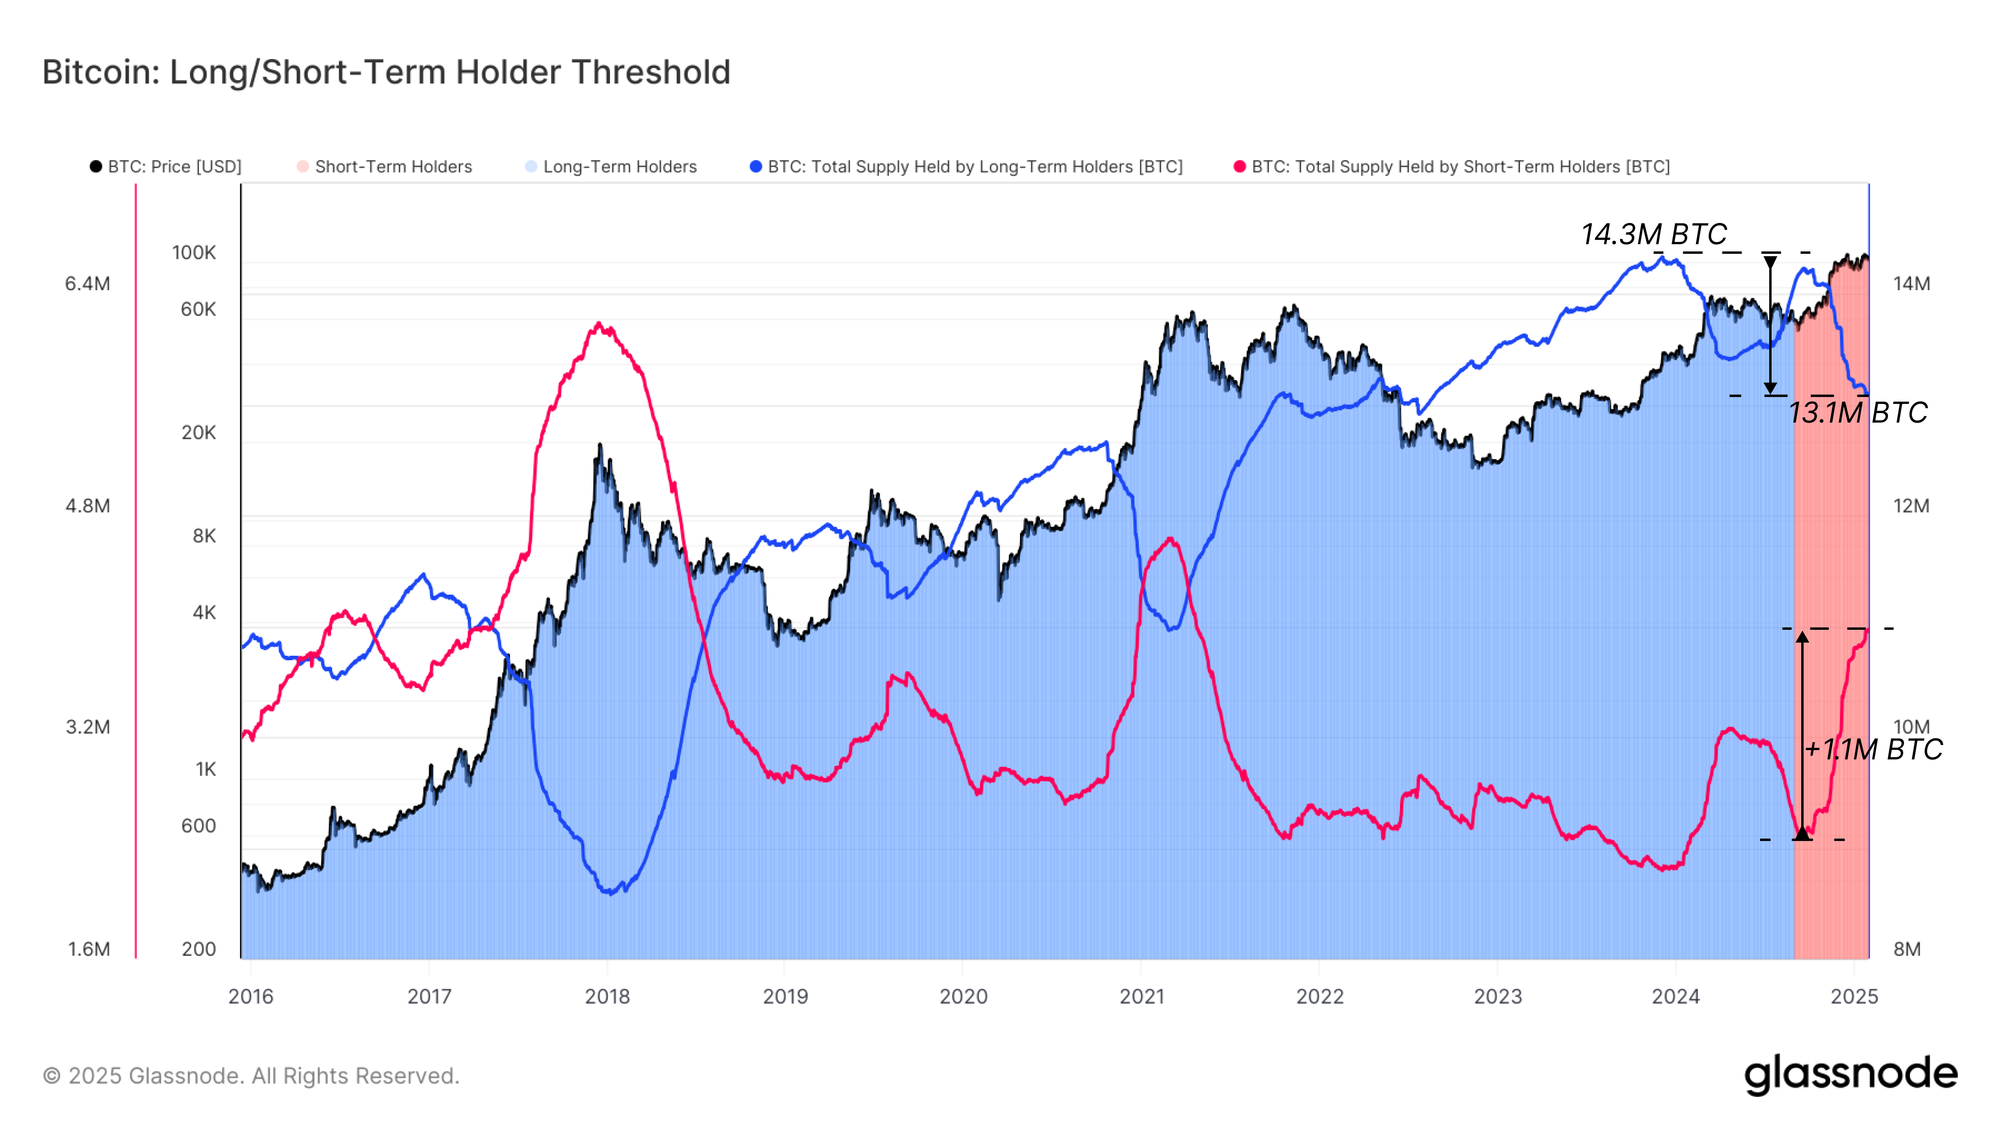
In bull markets, long-term holders spend long-dormant coins to lock in profits while new buyers absorb that supply at higher prices. The sustainability of a bull market depends heavily on the aggressiveness of demand, which drives price appreciation and sustains momentum.
The chart below illustrates this capital rotation during prior market markets, with 1.2M coins changing hands since the LTH Supply ATH of 14.3M BTC in December 2023. During the recent rally above $100K, 1.1M BTC have transferred from long-term to short-term holders, representing an impressive inflow of demand to absorb this supply at prices above $90k.
The rate of supply distribution offers further insights into investor behaviour and can be thought of as the near-term sell-side pressure being exerted.
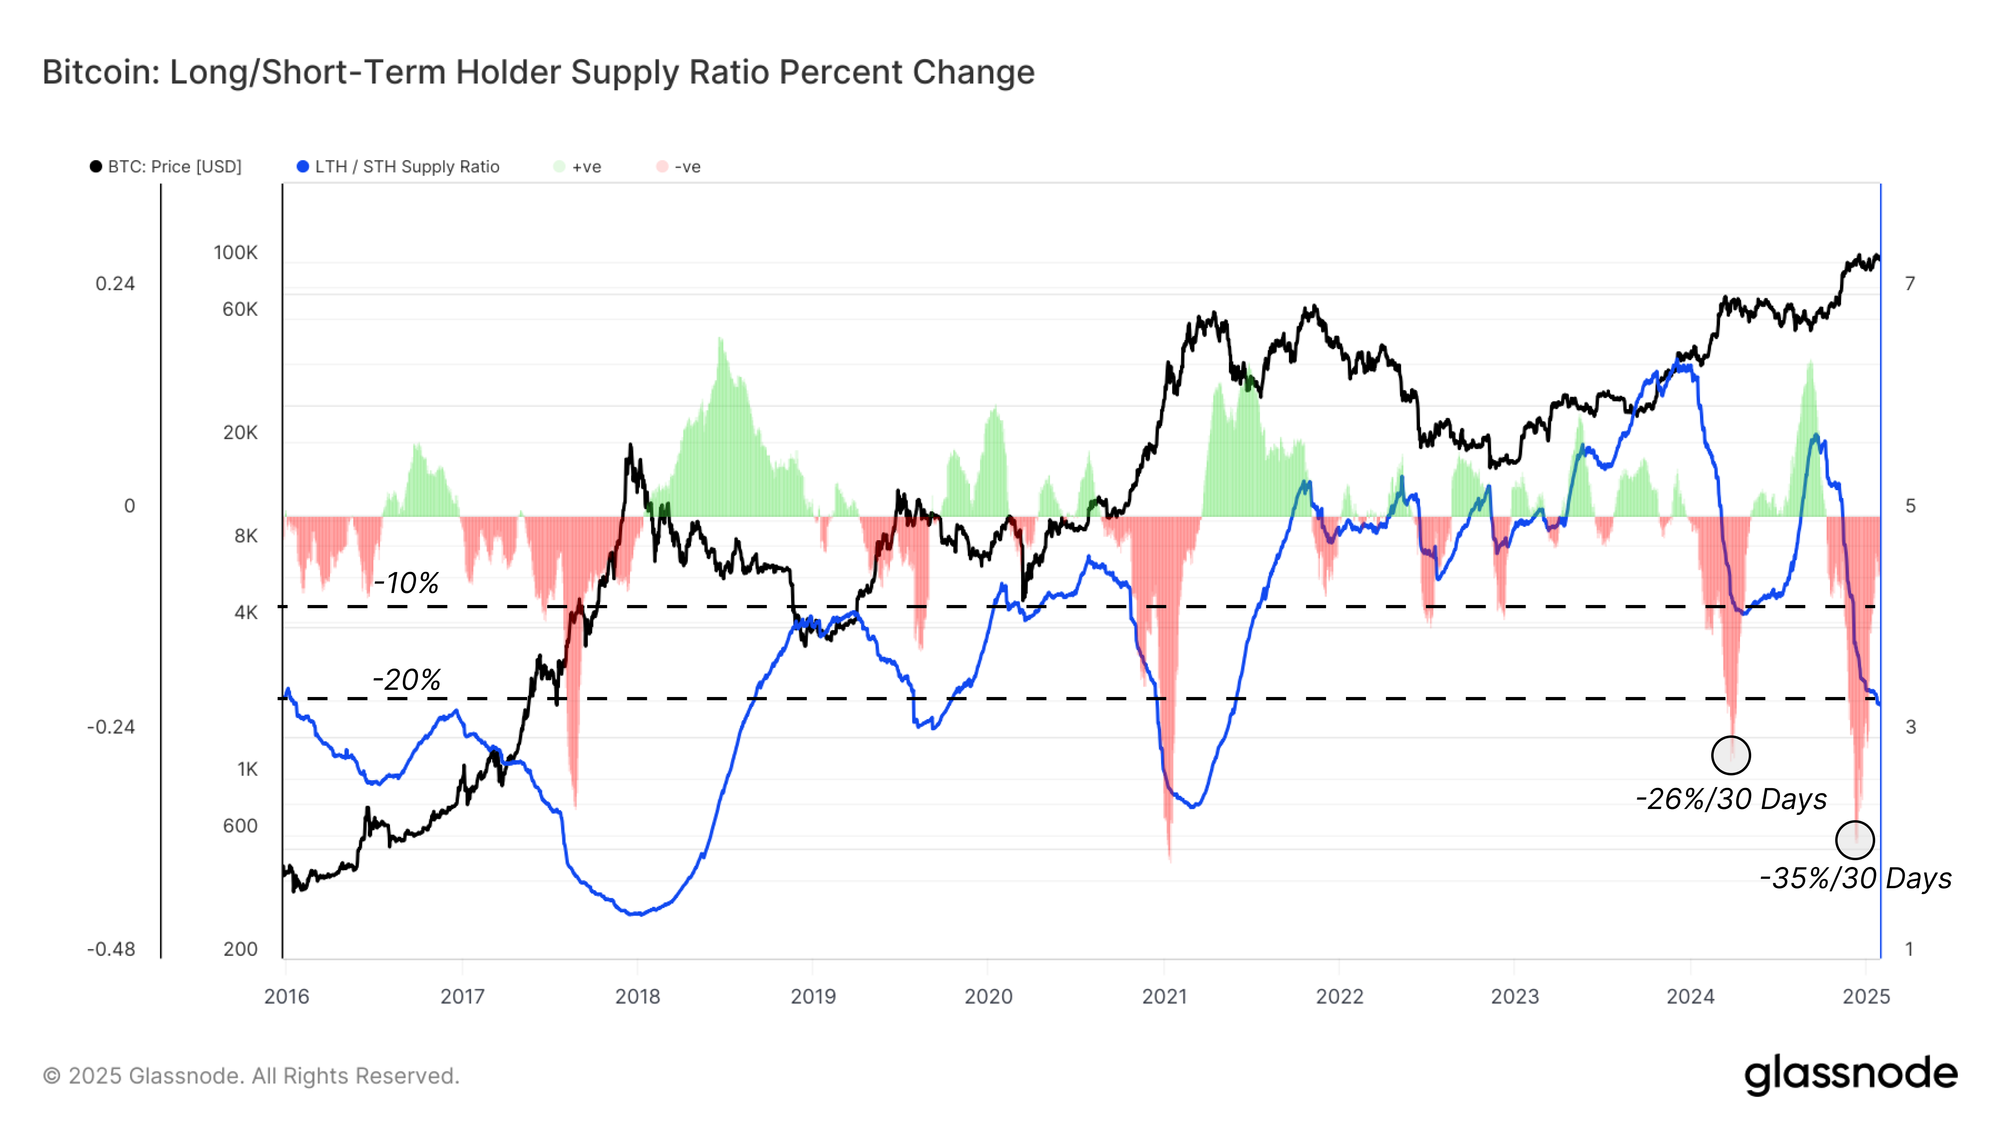
The chart shows the long-term to short-term holder supply ratio, revealing these distribution dynamics over time. A rising trend signals a dominance of accumulation and HODLing behaviour, as fewer old coins are spent and more migrate into Long-Term Holder status. Conversely, a decline in this metric indicates strong distribution by long-term holders at the present moment.
The monthly rate of change in this ratio highlights two primary waves of distribution that have occurred in the 2023-25 cycle, which are comparable in scale to those in early 2021 and late 2017.
In each case, the market rallied for over a month after the peak sell-side, suggesting a lessening sell-side allows breathing room for the demand to push prices higher. However, each eventually reached demand exhaustion, and the market started to transition back into a HODLing dominant phase during the subsequent bear market.
These metrics demonstrate the interplay between long-term holder activity and the role capital rotation has in sustaining bullish market momentum.
Addressing a Misconception on Exchange Balances
There is a widely held misconception regarding the decline in exchange balances during this cycle and the potential implications for market structure.
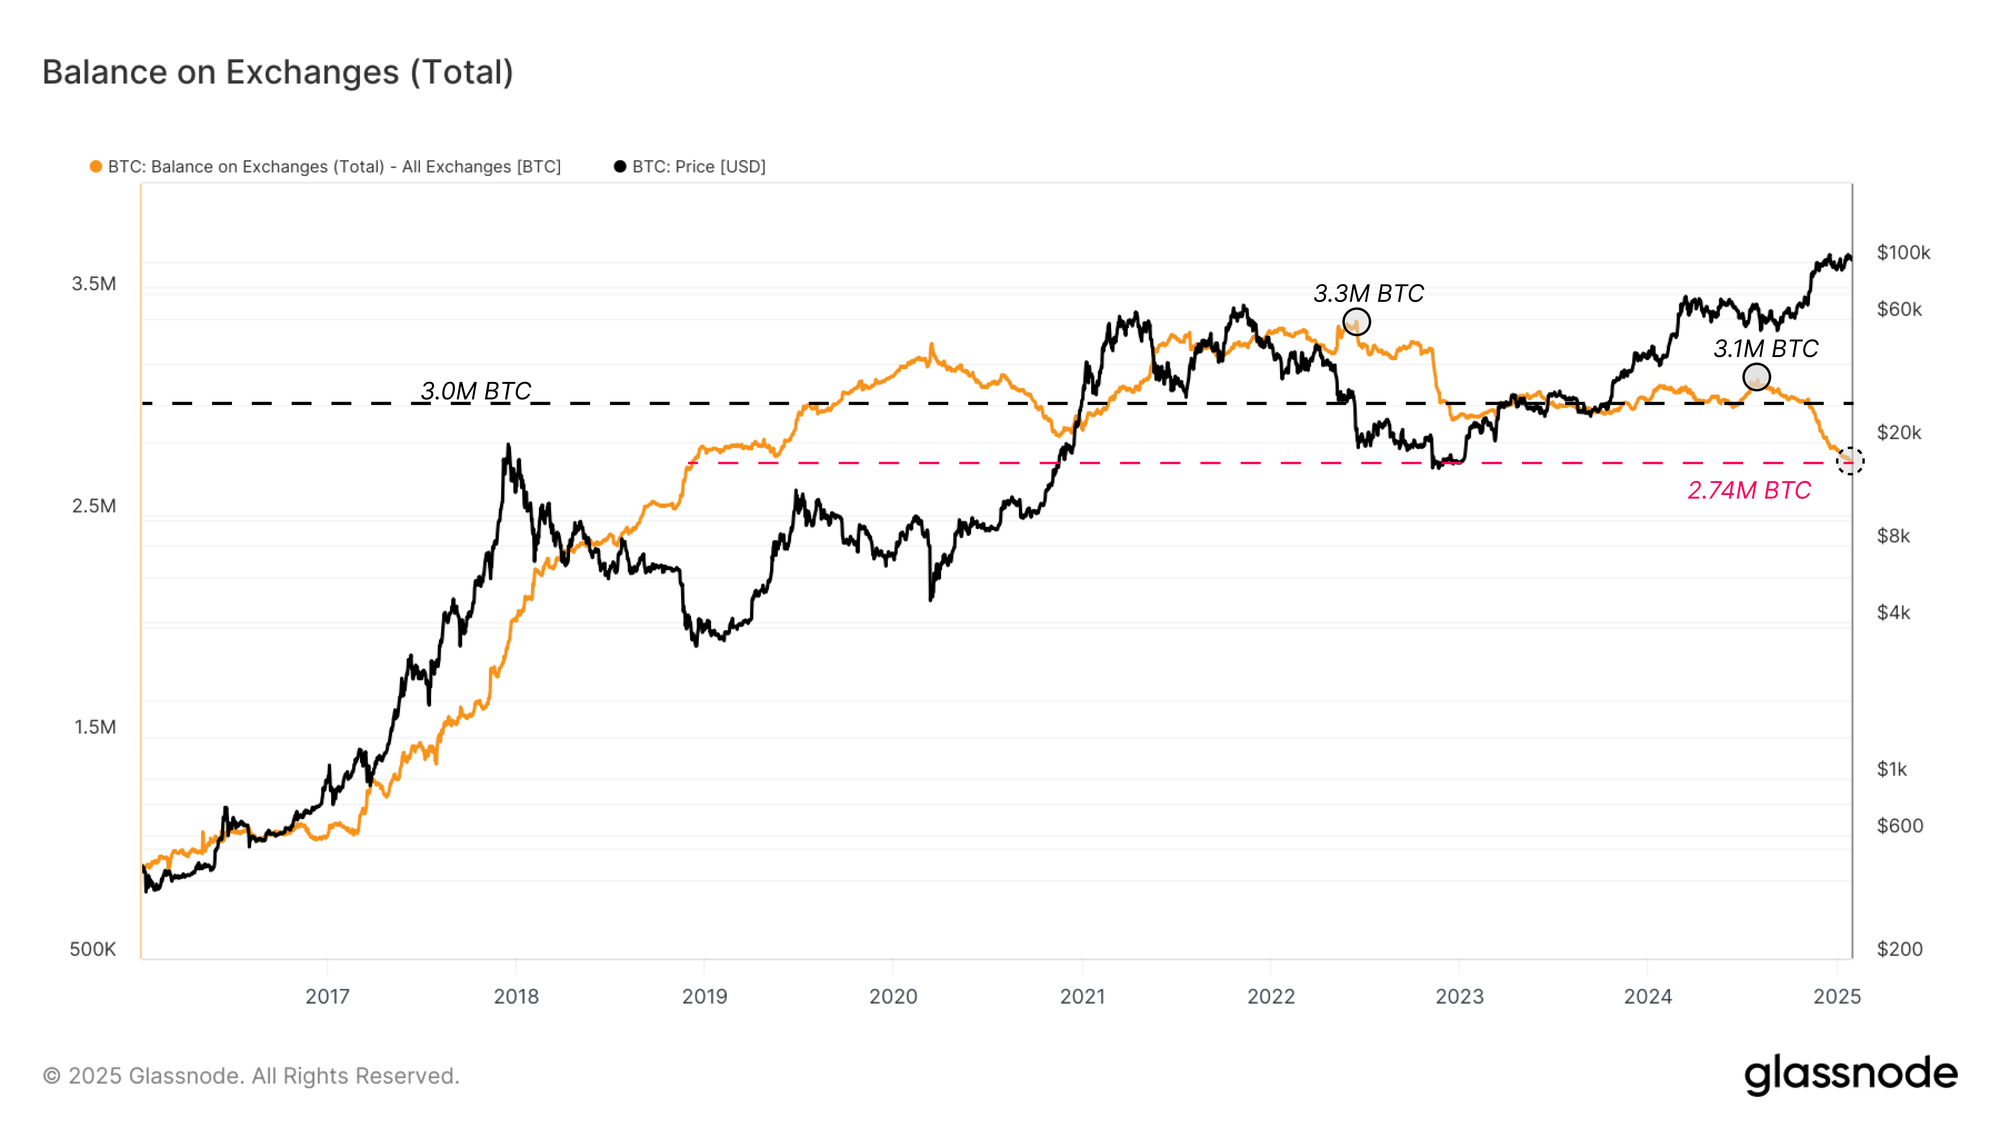
Bitcoin balances on centralized exchanges have fallen to 2.7M BTC, down from 3.1M BTC in July 2024. While many interpret this as a form of supply shock caused by a mass of coins being withdrawn by individual investors—potentially creating upward price pressure—we believe the majority of this decline stems from coins reshuffling into ETF wallets managed by custodians like Coinbase.
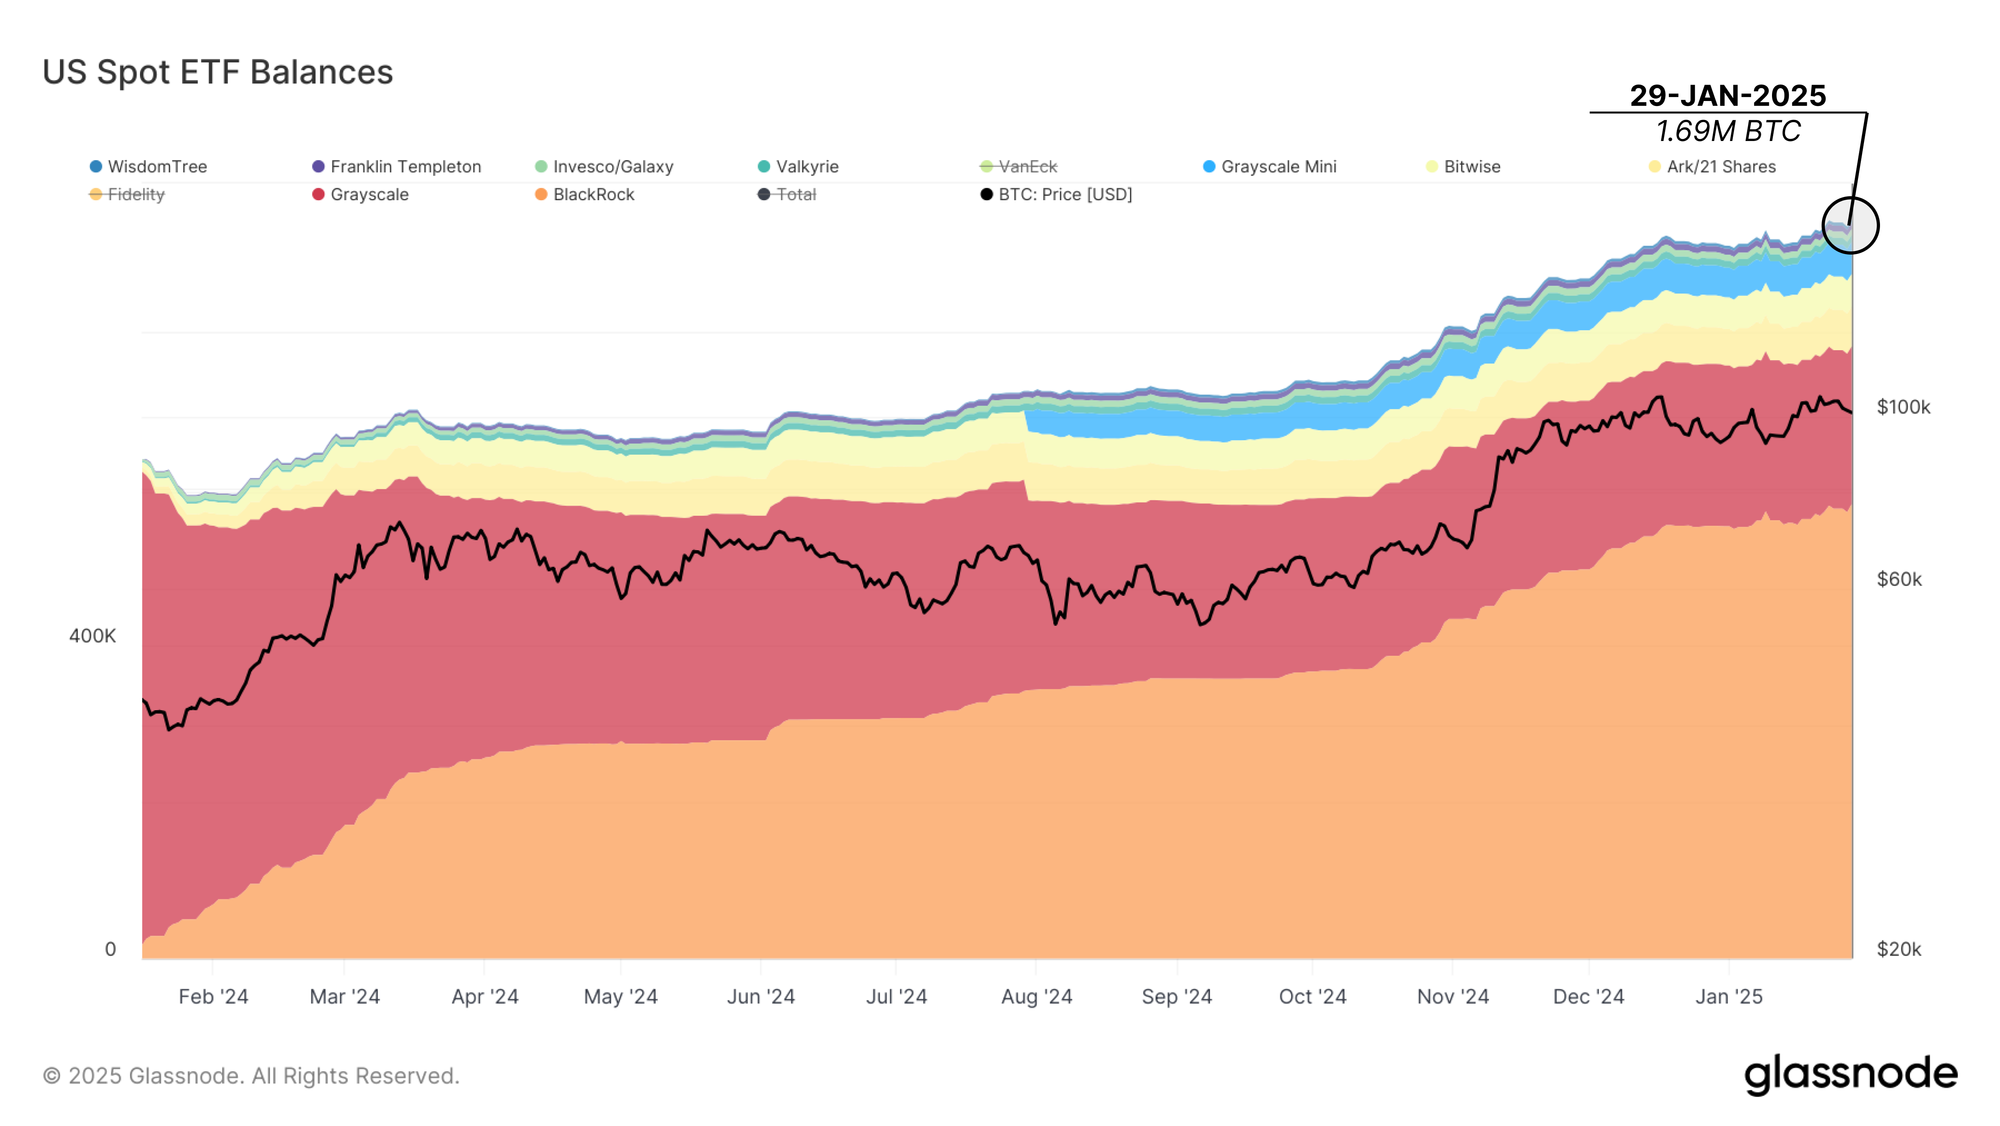
After the SEC approved Bitcoin Spot ETFs in January 2024, eight of eleven spot ETFs selected Coinbase as their custodian. As demand for ETF products picked up, a significant migration of coins from exchange wallets into Coinbase’s institutional custodian wallets occurred.
For clarity, the labels applied by Glassnode to exchange balances consider both the exchange wallets and those of Coinbase custody within the ‘Coinbase entity’.
In order to fully account for all ETFs, we can take the assets under management of the remaining ETFs that do not use Coinbase custody (FBTC and HODL) and add them to the total balance on exchanges.
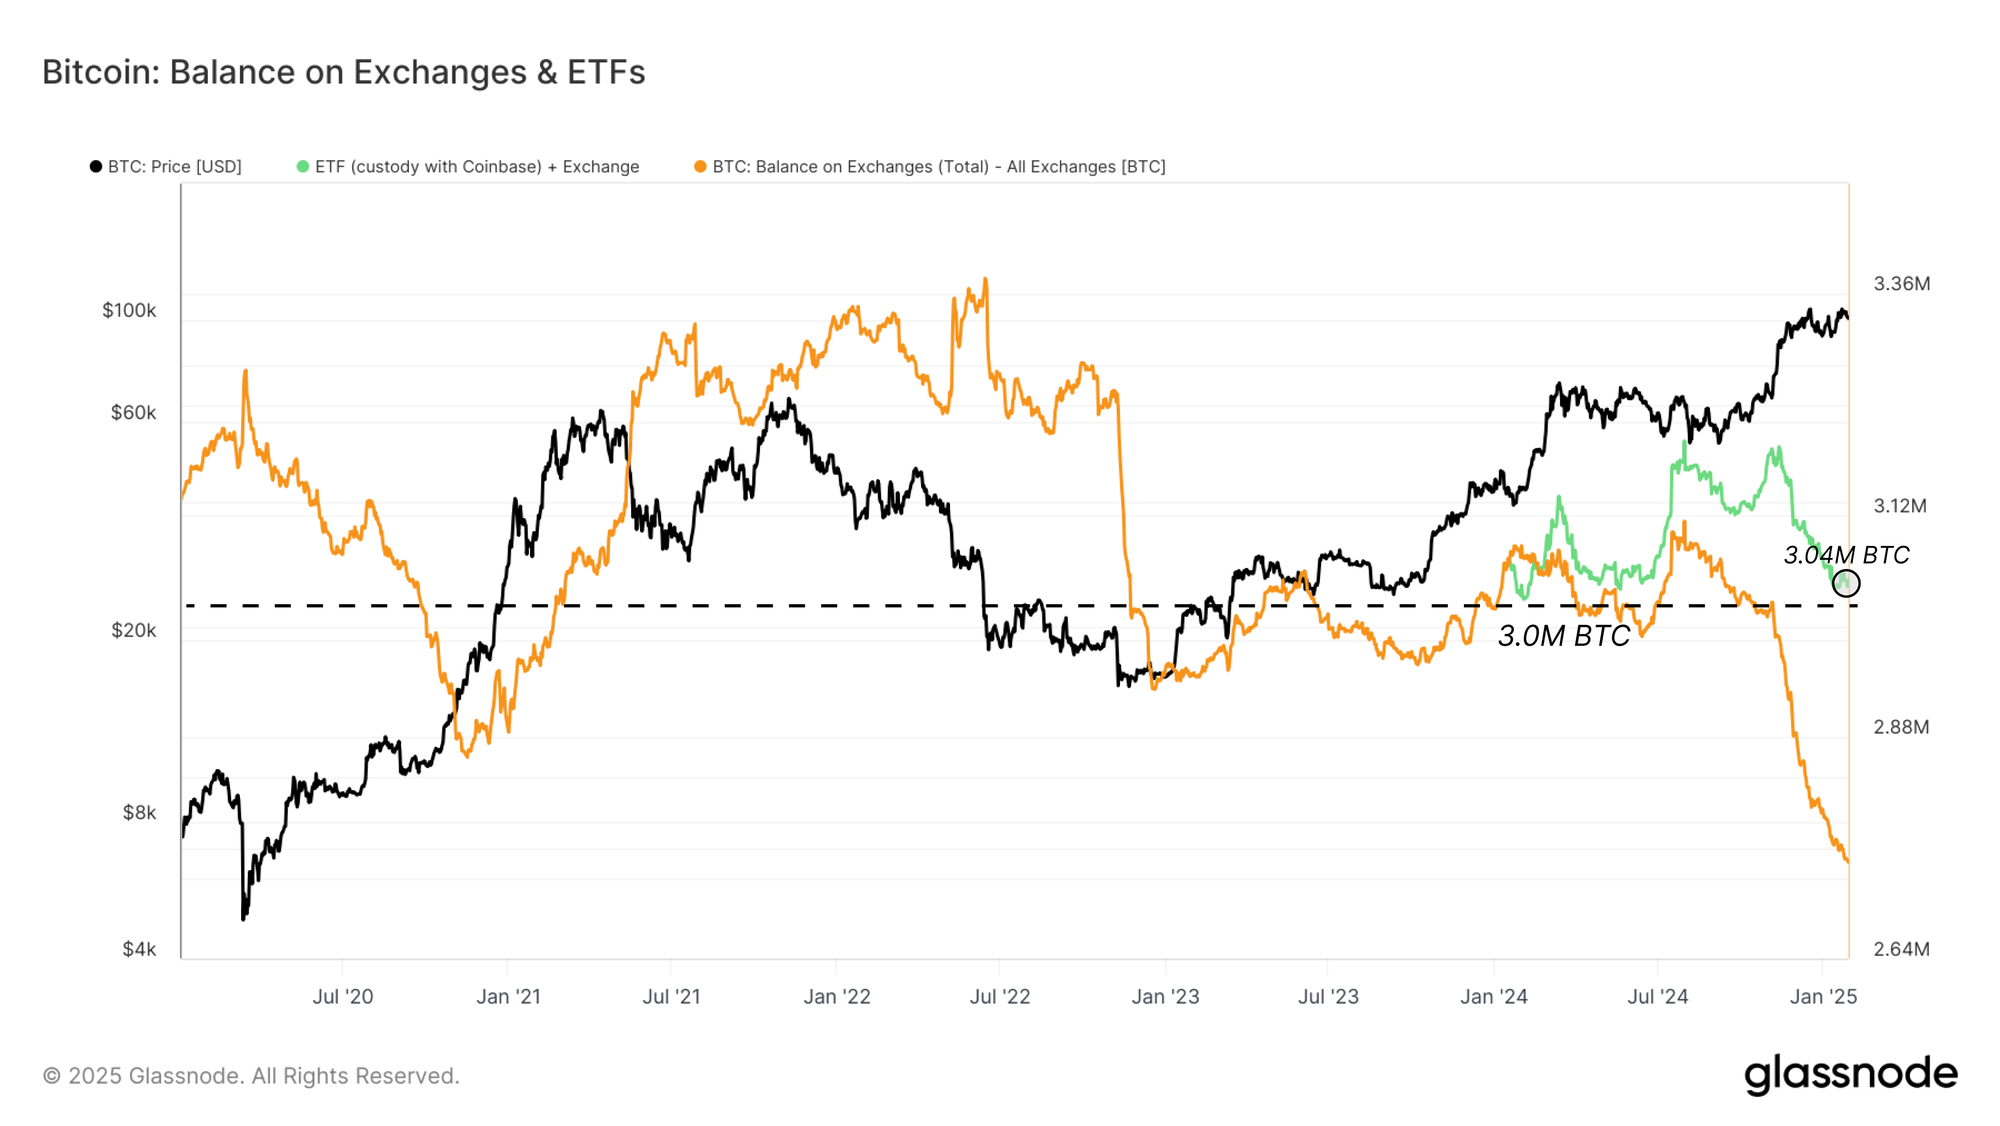
Accounting for the net AUM growth of these ETFs since their inception, the combined balance of exchanges and ETF wallets has oscillated around 3M BTC, which is the same level as exchanges alone held in January 2024.
As a result, the apparent decline in exchange balances since November is more likely to represent a shift in market structure rather than an overall reduction in available supply due to individual withdrawals.
Conclusion and Summary
Bitcoin’s rally reflects a maturing market with reduced overall cyclical growth, measured bull market drawdowns, and moderated Realized Cap expansion. Though lower than prior peaks, the current cycle's 2.1x Realized Cap growth aligns with the 2015–2018 cycle, leaving room for potential euphoria-driven expansion in the longer term.
We also clarified that the widely discussed drop in exchange balances does not signal a drastic depletion when accounting for the supply migration to ETF wallets. Therefore, the notion of an imminent supply shock due to declining exchange balances is inaccurate.
Instead, capital rotation from long-term holders to new investors remains the primary driver of market cycles. Following two distribution waves, the current cycle’s wealth rotation size and rate mirror the late 2017 and early 2021 bull markets. This suggests a demand exhaustion phase may follow in the short term, potentially leading to a predominant HODLing sentiment in the market.
Disclaimer: This report does not provide any investment advice. All data is provided for information and educational purposes only. No investment decision shall be based on the information provided here and you are solely responsible for your own investment decisions.
Exchange balances presented are derived from Glassnode’s comprehensive database of address labels, which are amassed through both officially published exchange information and proprietary clustering algorithms. While we strive to ensure the utmost accuracy in representing exchange balances, it is important to note that these figures might not always encapsulate the entirety of an exchange’s reserves, particularly when exchanges refrain from disclosing their official addresses. We urge users to exercise caution and discretion when utilizing these metrics. Glassnode shall not be held responsible for any discrepancies or potential inaccuracies. Please read our Transparency Notice when using exchange data.
- Join our Telegram channel.
- For on-chain metrics, dashboards, and alerts, visit Glassnode Studio.